For those of you using Apache Kafka and Docker Cloud or considering it, we’ve got a Sematext user case study for your reading pleasure. In this use case, Ján Antala, a Software Engineer in the DevOps Team at @pygmalios, talks about the business and technical needs that drove their decision to use Docker Cloud, how they are using Docker Cloud, and how their Docker and Kafka monitoring is done.
Pygmalios – Future of data-driven retail.

Pygmalios helps companies monitor how customers and staff interact in real-time. Our retail analytics platforms tracks sales, display conversions, customers and staff behavior to deliver better service, targeted sales, faster check-outs and the optimal amount of staffing for a given time and location. Among our partners are big names such as dm drogerie or BMW.
I am a software engineer on a DevOps position so I know about all the challenges from both sides – infrastructure as well as software development.
Our infrastructure
In Pygmalios we have decided to use the architecture based on microservices for our analytics platform. We have a complex system of Apache Spark, Apache Kafka, Cassandra and InfluxDB databases, Node.js backend and JavaScript frontend applications where every service has its own single responsibility which makes them easy to scale. We run them mostly in Docker containers apart from Spark and Cassandra which run on the DataStax Enterprise stack.
We have around 50 different Docker services in total. Why Docker? Because it’s easy to deploy, scale and you don’t have to care about where you run your applications. You can even transfer them between node clusters in seconds. We don’t have our own servers but use cloud providers instead, especially AWS. We have been using Tutum to orchestrate our Docker containers for the past year (Tutum was acquired by Docker recently and the service is now called Docker Cloud).
Docker Cloud is the best service for Docker container management and deployment and totally matches our needs. You can create servers on any cloud provider or bring your own, add Docker image and write stack file where you can list rules which specify what and where to deploy. Then you can manage all your services and nodes via a dashboard. We really love the CI & CD features. When we push a new commit to Github the Docker image is built and then automatically deployed to the production.

DevOps Challenges
As we use a microservices architecture we have a lot of applications across multiple servers so we need to orchestrate them. We also have many physical sensors outside in the retail stores which are our data sources. In the end, there are a lot of things we have to think about including correlations between them:
Server monitoring
Basic metrics for the hardware layer such as memory, cpu and network.
Docker monitoring
In the software layer we want to know whether our applications inside Docker containers are running properly.
Kafka, Spark and Cassandra monitoring
Our core services. They are crucial, so monitoring is a must.
Sensors monitoring
Sensors are deployed outside in the retail stores. We have to monitor them as well and use custom metrics.
Notifications
We want alerts whenever anything breaks.
Centralized logging
Store all logs in one place, combine them with hardware usage and then analyze anomalies.
Monitoring & Logging on Docker Cloud
There is already a great post about Docker Cloud Monitoring and Logging so more information go to this blog: Docker Cloud Monitoring and Logging.
Kafka on Docker Cloud
We use a cluster of 3 brokers each running in a Docker container across nodes because Kafka is crucial for us. We are not collecting any data when Kafka is not available so they are lost forever if Kafka is ever down. Sure, we have buffers inside sensors, but we don’t want to rely on them. All topics are also replicated between all brokers so we can handle outage of 2 nodes. Our goal is also to scale it easily.
Kafka and Zookeeper live together so you have to link them using connection parameters. Kafka doesn’t have a master broker but the leader is automatically elected by Zookeeper from available brokers. Zookeeper elects its own leader automatically. To scale Kafka and Zookeeper to more nodes we just have to add them into Docker Cloud cluster as we use every_node deployment strategy and update connection link in the stack file.
We use our own fork of wurstmeister/kafka and signalfx/docker-zookeeper Docker images and I would encourage you to do the same so you can easily tune them to your needs.
To run Kafka + Zookeeper cluster launch the following stack on Docker Cloud.
Code from https://gist.github.com/janantala/c93a284e3f93bc7d7942f749aae520af
kafka:
image: 'pygmalios/kafka:latest'
deployment_strategy: every_node
environment:
- JMX_PORT=9999
- KAFKA_ADVERTISED_HOST_NAME=$DOCKERCLOUD_CONTAINER_HOSTNAME
- KAFKA_ADVERTISED_PORT=9092
- KAFKA_DEFAULT_REPLICATION_FACTOR=3
- KAFKA_DELETE_TOPIC_ENABLE=true
- KAFKA_LOG_CLEANER_ENABLE=true
- 'KAFKA_ZOOKEEPER_CONNECT=zookeeper-1:2181,zookeeper-2:2181,zookeeper-3:2181'
- KAFKA_ZOOKEEPER_CONNECTION_TIMEOUT_MS=6000
ports:
- '9092:9092'
- '9999:9999'
restart: always
tags:
- kafka
volumes:
- '/var/run/docker.sock:/var/run/docker.sock'
zookeeper:
image: 'pygmalios/zookeeper-cluster:latest'
deployment_strategy: every_node
environment:
- CONTAINER_NAME=$DOCKERCLOUD_CONTAINER_HOSTNAME
- SERVICE_NAME=zookeeper
- 'ZOOKEEPER_INSTANCES=zookeeper-1,zookeeper-2,zookeeper-3'
- 'ZOOKEEPER_SERVER_IDS=zookeeper-1:1,zookeeper-2:2,zookeeper-3:3'
- ZOOKEEPER_ZOOKEEPER_1_CLIENT_PORT=2181
- ZOOKEEPER_ZOOKEEPER_1_HOST=zookeeper-1
- ZOOKEEPER_ZOOKEEPER_1_LEADER_ELECTION_PORT=3888
- ZOOKEEPER_ZOOKEEPER_1_PEER_PORT=2888
- ZOOKEEPER_ZOOKEEPER_2_CLIENT_PORT=2181
- ZOOKEEPER_ZOOKEEPER_2_HOST=zookeeper-2
- ZOOKEEPER_ZOOKEEPER_2_LEADER_ELECTION_PORT=3888
- ZOOKEEPER_ZOOKEEPER_2_PEER_PORT=2888
- ZOOKEEPER_ZOOKEEPER_3_CLIENT_PORT=2181
- ZOOKEEPER_ZOOKEEPER_3_HOST=zookeeper-3
- ZOOKEEPER_ZOOKEEPER_3_LEADER_ELECTION_PORT=3888
- ZOOKEEPER_ZOOKEEPER_3_PEER_PORT=2888
ports:
- '2181:2181'
- '2888:2888'
- '3888:3888'
restart: always
tags:
- kafka
volumes:
- '/var/lib/zookeeper:/var/lib/zookeeper'
- '/var/log/zookeeper:/var/log/zookeeper'
We use private networking and hostname addressing (KAFKA_ADVERTISED_HOST_NAME environment variable) for security reasons in our stack. However, you can use IP addressing directly when you replace hostname by IP address. To connect to Kafka from outside environment you have to add records into /etc/hosts file:
KAFKA_NODE.1.IP.ADDRESS kafka-1
KAFKA_NODE.2.IP.ADDRESS kafka-2
KAFKA_NODE.3.IP.ADDRESS kafka-3
KAFKA_NODE.1.IP.ADDRESS zookeeper-1
KAFKA_NODE.2.IP.ADDRESS zookeeper-2
KAFKA_NODE.3.IP.ADDRESS zookeeper-3
Or on Docker Cloud add extra_hosts into service configuration.
extra_hosts:
- 'kafka-1:KAFKA_NODE.1.IP.ADDRESS'
- 'kafka-2:KAFKA_NODE.2.IP.ADDRESS'
- 'kafka-3:KAFKA_NODE.3.IP.ADDRESS'
- 'zookeeper-1:KAFKA_NODE.1.IP.ADDRESS'
- 'zookeeper-2:KAFKA_NODE.2.IP.ADDRESS'
- 'zookeeper-3:KAFKA_NODE.3.IP.ADDRESS'
Then you can use following Zookeeper connection string to connect Kafka:
zookeeper-1:2181,zookeeper-2:2181,zookeeper-3:2181
And Kafka broker list:
kafka-1:9092,kafka-2:9092,kafka-3:9092
Guide: Monitoring of Dockerized Kafka on Docker Cloud https://t.co/Y9hSU0l6RQ @apachekafka #docker #DockerCloud #kafka
— Sematext Group, Inc. (@sematext) April 19, 2016
Kafka + SPM
To monitor Kafka we use SPM by Sematext which provides Kafka monitoring of all metrics for Brokers, Producers and Consumers available in JMX interface out of the box. They also provide monitoring for other apps we use such as Spark, Cassandra, Docker images and we can also collect logs so we have it all in one place. When we have this information we can find out not only when something happened, but also why.
Our Kafka node cluster with Docker containers is displayed in the following diagram:
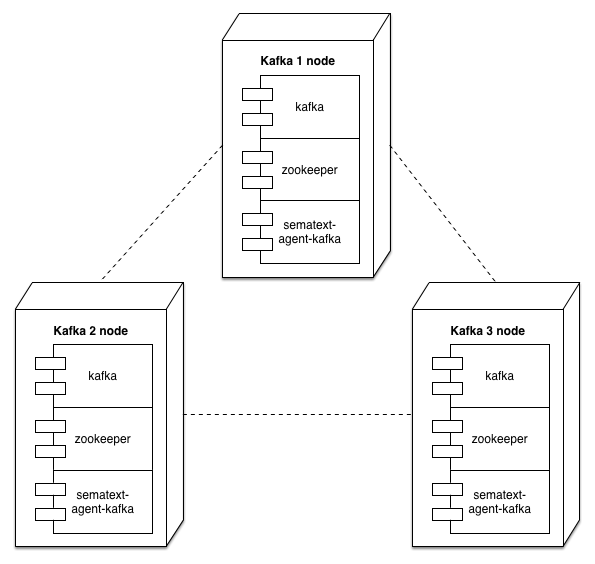
SPM Performance Monitoring for Kafka
SPM collects performance metrics of Kafka. First you have to create an SPM application of type Kafka in the Sematext dashboard and connect SPM client Docker container from sematext/spm-client image. We use SPM client in-process mode as a Java agent so it is easy to set up. Just add SPM_CONFIG environment variable to SPM client Docker container, where you specify monitor configuration of Kafka Brokers, Consumers and Producers. Note, that you have to use your own SPM token, instead of YOUR_SPM_TOKEN.

sematext-agent-kafka:
image: 'sematext/spm-client:latest'
deployment_strategy: every_node
environment:
- 'SPM_CONFIG=YOUR_SPM_TOKEN kafka javaagent kafka-broker;YOUR_SPM_TOKEN kafka javaagent kafka-producer;YOUR_SPM_TOKEN kafka javaagent kafka-consumer'
restart: always
tags:
- kafka
Kafka
You have to also connect Kafka and SPM monitor together. This can be done by mounting volume from the SPM monitor service into Kafka container using volumes_from option. To enable the SPM monitor just add KAFKA_JMX_OPTS environment variable into Kafka container by adding the following arguments to your JVM startup script for Kafka Broker, Producer & Consumer.
KAFKA_JMX_OPTS=-Dcom.sun.management.jmxremote -javaagent:/opt/spm/spm-monitor/lib/spm-monitor-kafka.jar=YOUR_SPM_TOKEN:kafka-broker:default -Dcom.sun.management.jmxremote -javaagent:/opt/spm/spm-monitor/lib/spm-monitor-kafka.jar=YOUR_SPM_TOKEN:kafka-producer:default -Dcom.sun.management.jmxremote -javaagent:/opt/spm/spm-monitor/lib/spm-monitor-kafka.jar=YOUR_SPM_TOKEN:kafka-consumer:default -Dcom.sun.management.jmxremote.authenticate=false -Dcom.sun.management.jmxremote.ssl=false
Done! Your Kafka cluster monitoring is set up. Now you can monitor requests, topics and other JMX metrics out of the box or you can create custom dashboards by connecting other apps.
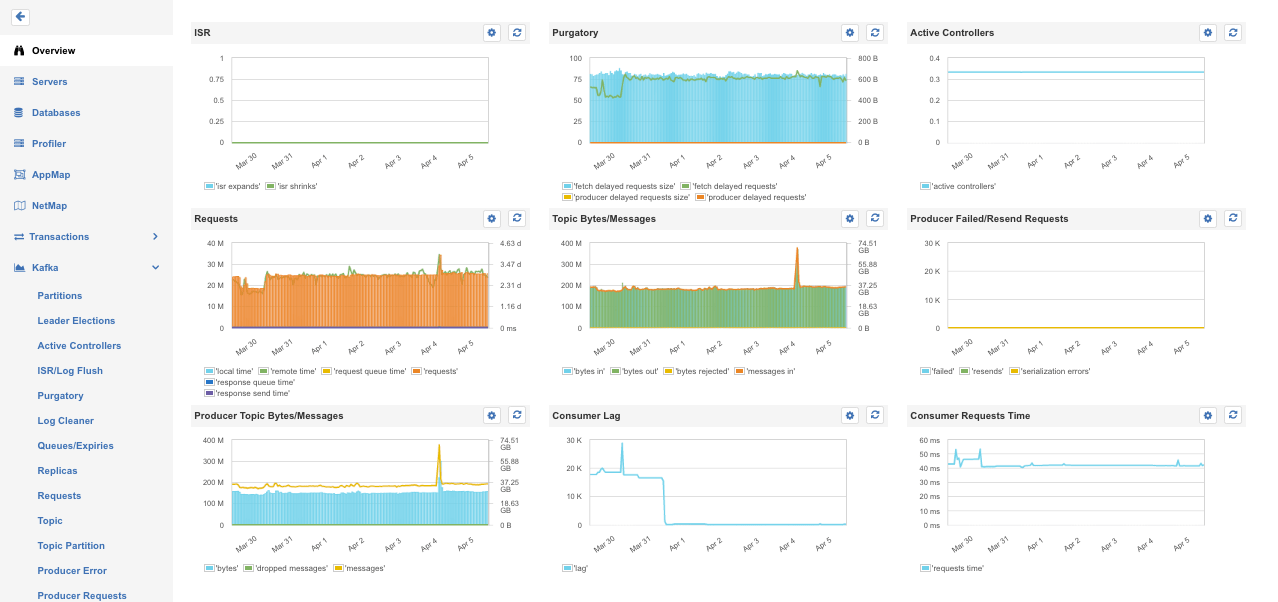
Kafka metrics overview in SPM

Requests

Topic Bytes/Messages
Stack file
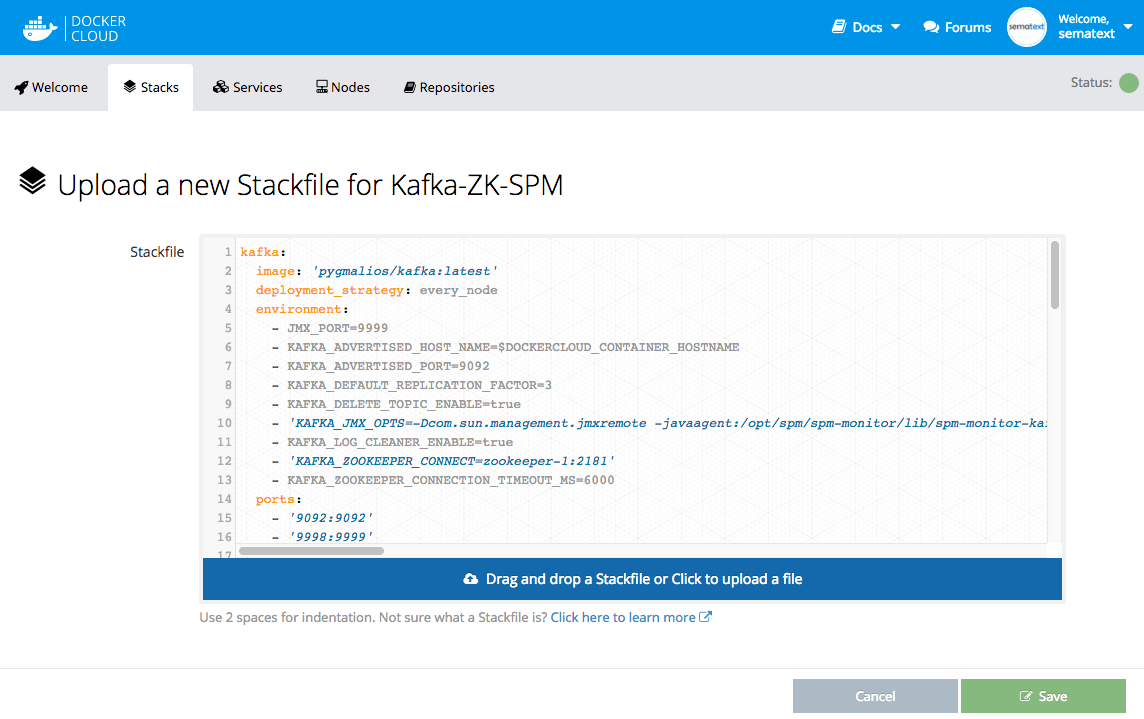
To run Zookeeper + Kafka + SPM monitoring cluster just launch following stack and update these environment variables in your stack file:
- YOUR_SPM_TOKEN inside SPM_CONFIG in Sematext monitoring service and KAFKA_JMX_OPTS in Kafka service
Code from https://gist.github.com/janantala/d816071a7a00eefeea934ec630a57c07
kafka:
image: 'pygmalios/kafka:latest'
deployment_strategy: every_node
environment:
- JMX_PORT=9999
- KAFKA_ADVERTISED_HOST_NAME=$DOCKERCLOUD_CONTAINER_HOSTNAME
- KAFKA_ADVERTISED_PORT=9092
- KAFKA_DEFAULT_REPLICATION_FACTOR=3
- KAFKA_DELETE_TOPIC_ENABLE=true
- **'KAFKA_JMX_OPTS=-Dcom.sun.management.jmxremote -javaagent:/opt/spm/spm-monitor/lib/spm-monitor-kafka.jar=YOUR_SPM_TOKEN:kafka-broker:default -Dcom.sun.management.jmxremote -javaagent:/opt/spm/spm-monitor/lib/spm-monitor-kafka.jar=YOUR_SPM_TOKEN:kafka-producer:default -Dcom.sun.management.jmxremote -javaagent:/opt/spm/spm-monitor/lib/spm-monitor-kafka.jar=YOUR_SPM_TOKEN:kafka-consumer:default -Dcom.sun.management.jmxremote.authenticate=false -Dcom.sun.management.jmxremote.ssl=false'
** - KAFKA_LOG_CLEANER_ENABLE=true
- 'KAFKA_ZOOKEEPER_CONNECT=zookeeper-1:2181,zookeeper-2:2181,zookeeper-3:2181'
- KAFKA_ZOOKEEPER_CONNECTION_TIMEOUT_MS=6000
ports:
- '9092:9092'
- '9999:9999'
restart: always
tags:
- kafka
volumes:
- '/var/run/docker.sock:/var/run/docker.sock'
**volumes_from:
- sematext-agent-kafka**
sematext-agent-kafka:
image: 'sematext/spm-client:latest'
deployment_strategy: every_node
environment:
- **'SPM_CONFIG=YOUR_SPM_TOKEN kafka javaagent kafka-broker;YOUR_SPM_TOKEN kafka javaagent kafka-producer;YOUR_SPM_TOKEN kafka javaagent kafka-consumer'**
restart: always
tags:
- kafka
zookeeper:
image: 'pygmalios/zookeeper-cluster:latest'
deployment_strategy: every_node
environment:
- CONTAINER_NAME=$DOCKERCLOUD_CONTAINER_HOSTNAME
- SERVICE_NAME=zookeeper
- 'ZOOKEEPER_INSTANCES=zookeeper-1,zookeeper-2,zookeeper-3'
- 'ZOOKEEPER_SERVER_IDS=zookeeper-1:1,zookeeper-2:2,zookeeper-3:3'
- ZOOKEEPER_ZOOKEEPER_1_CLIENT_PORT=2181
- ZOOKEEPER_ZOOKEEPER_1_HOST=zookeeper-1
- ZOOKEEPER_ZOOKEEPER_1_LEADER_ELECTION_PORT=3888
- ZOOKEEPER_ZOOKEEPER_1_PEER_PORT=2888
- ZOOKEEPER_ZOOKEEPER_2_CLIENT_PORT=2181
- ZOOKEEPER_ZOOKEEPER_2_HOST=zookeeper-2
- ZOOKEEPER_ZOOKEEPER_2_LEADER_ELECTION_PORT=3888
- ZOOKEEPER_ZOOKEEPER_2_PEER_PORT=2888
- ZOOKEEPER_ZOOKEEPER_3_CLIENT_PORT=2181
- ZOOKEEPER_ZOOKEEPER_3_HOST=zookeeper-3
- ZOOKEEPER_ZOOKEEPER_3_LEADER_ELECTION_PORT=3888
- ZOOKEEPER_ZOOKEEPER_3_PEER_PORT=2888
ports:
- '2181:2181'
- '2888:2888'
- '3888:3888'
restart: always
tags:
- kafka
volumes:
- '/var/lib/zookeeper:/var/lib/zookeeper'
- '/var/log/zookeeper:/var/log/zookeeper'
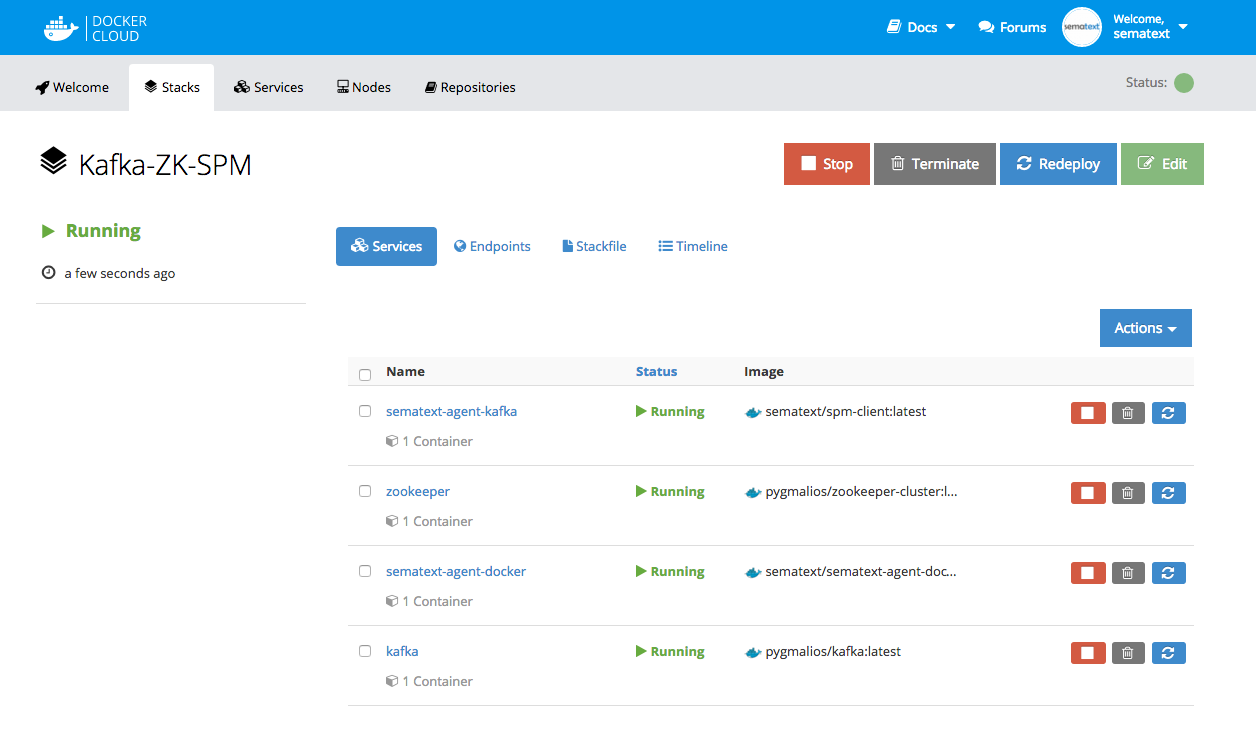
Summary
Thanks to Sematext you can easily monitor all important metrics. Basic setup should take only a few minutes and then you can tune it to your needs, connect with other applications and create custom dashboards.
If you have feedback for monitoring Kafka cluster get in touch with me @janantala or email me at j.antala@pygmalios.com. You can also follow us @pygmalios for more cool stuff. If you have problems setting your monitoring and logging don’t hesitate to send an email to support@sematext.com or tweet @sematext.