As you know, in Sematext we looooove logs and metrics and we enjoy playing with them on a daily basis. We have our Logsene, which is all about logs and their analysis. We have our SPM which can monitor half of the world when it comes to performance metrics, give you a perfect view of class level performance with transaction tracing, and give you a perfect view of your environment with components view. And that’s not all.
Because we enjoy working with metrics, we decided to take a look at the shiny, new Solr metrics API that came out with recently released Solr 6.4. It comes with the promise of providing a convenient method to fetch data in various formats. It also makes it possible to report metrics to external systems. As metrics aficionados and Solr users ourselves we are thrilled to have this at our disposal and jumped on the opportunity to play around with Solr’s new metrics goodness. Let’s start with some history on how it used to be in “the good old days”.
Back in the day…
A long, long time ago, in the Apache country ruled by king Solr and queen Lucene there was a messenger called JMX. Ok, wrong story. To make the long story short – till now the only thing you could do to fetch metrics from Solr is to use JMX. If you wanted to see what is happening inside Solr you had to either use the Solr admin panel and look into what you were interested in or use a Java tool that could read those metrics. Actually, any kind of tool that is able to read data from JMX, for example jconsole that is shipped in the JDK package, can be used to fetch metrics from Solr.
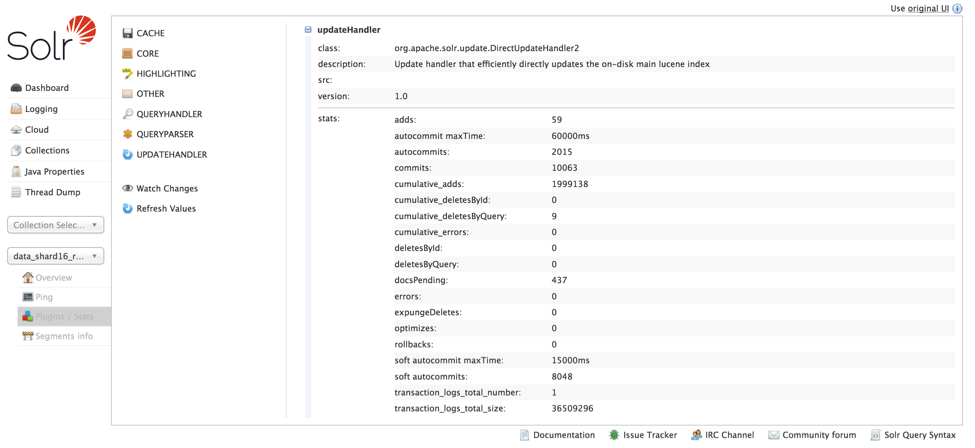
This gives us some visibility, but there are issues with such approach. The main problem is that we don’t have a full view of the historical data. We see cumulative statistics or changes since the time we started looking into metrics, but if we want to see what was happening one hour ago, we couldn’t do that or at least not out of the box.
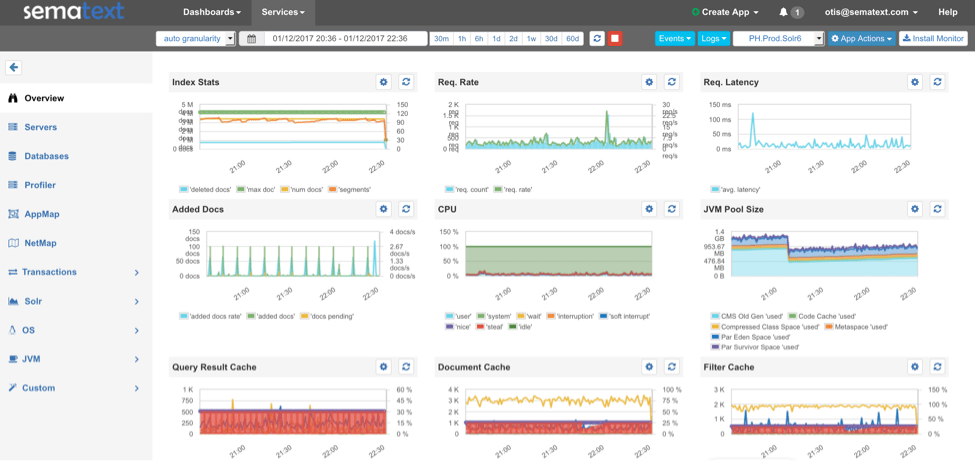
Of course, those obstacles can be overcome by using monitoring tools for Solr. We can either use something open source like Ganglia and configure everything from scratch using information available out in the wild places of the Internet or we can use something that does everything for us and we only need to install an agent, as is the case with SPM from Sematext.
However, if you are allergic to any kind of UI that helps you with understanding your metrics you were forced to use JMX and tools that could fetch metrics from it. Until now.
Metrics in Solr – the new kid on the block
So what can we do now? Well, with SOLR-4735 Solr metrics evolved. Metrics are no longer limited to being exposed for polling via JMX. Instead, Solr can now also send metrics to external destinations and file, exposes a nice REST API and extended set of metrics. What’s more, the extended metrics are now not only about Solr components, but you can also retrieve JVM level information or Jetty and HTTP-related statistics. Sounds fun if you ask me!
However, this is not all. Right now Solr can export metrics to other systems and that functionality is available out of the box. Yes, apart from the standard JMX reporting, we can save metrics to log file using SLF4J reporter or even send metrics to Ganglia or Graphite. All of that is available out of the box without any special plugins or additions.
Finally, one last thing – the API. Once you know what you want to fetch, it is as easy as pointing your browser or curl command to /admin/metrics, providing the type and group of metrics you would like to retrieve, and Solr will return all the requested information.
Next, let’s dig a bit deeper and see what we need to do to make all of that working or configured.
Types of meters
The improvements around Solr metrics are based on DropWizard metrics – a Java library supporting easy metrics reporting and different kinds of meters. The ones used by Solr are:
- counters
- gauges
- histograms
- meters
- timers
The counters are there to measure simple counts – for example number of queries processed by the request handler. The gauges allow one to check the current value – for example the length of a queue or number, like number of pending documents. Histograms let Solr calculate approximate distribution of certain values and provide statistics around them. For example, histogram can be used to give us percentiles for query response times. Meters are there to provide rates of events, like average number of query requests per second in the periods of 1, 5 and 15 minutes. Finally, the timers are there to count the duration of certain events and allow for both counts and histograms.
Solr metric groups
Solr uses the above mentioned standardized meters to gather the data from various metric, categorizing them into the following groups:
- Core information (solr.core.<collection_name> group, each for one core)
- HTTP information (solr.http group)
- Jetty information (solr.jetty group)
- JVM information (solr.jvm group)
- Solr node information (solr.node group)
- More metrics are coming in the future, like shard leaders metrics, cluster nodes metrics and aggregated per-core metrics. However, these are available in Solr 6.4.
So what can we get from those metrics? The core information group lets us get merics request handlers (counters, timers, errors, timeouts, etc), index-related events (meters and gauges for merges, both current and historical, deleted documents information), Lucene Directory I/O information (read and writes meters and histograms with split per file type – like doc values or terms dictionary). In the future, we will also see shard replication, transaction log information and caches.
The HTTP group provides information regarding available, open and pending connections for shard handler and update handler.
The Jetty related group gives us view on a few very important statistics related to the servlet container in which Solr runs. We can look at threads and thread pools usage, connection and request timers, and meters for various HTTP response codes – like number of request with 200 response code, number of 400 or 500 and so on.
Very interesting JVM group gives us low level information on what is happening inside Solr and inside the JVM itself. We have the direct and mapped buffer pools information, class loading and unloading related information, garbage collection meters and timers, operating system memory, CPU timer, file descriptors count, system load and swap usage (btw, remember that JVM hates its memory to be swapped – it reacts with poor performance).
Finally, the node related group provides information related to Solr node, such as number of cores that are loaded on the core, lazy or unloaded, information about request handlers, collections, configuration sets and so on.
Solr Metrics API
One of the possible methods of retrieving Solr metrics is using the Metrics API. The admin/metrics endpoint provides access to all the metrics that we can get. We should just send a HTTP GET request to that endpoint and let Solr know what we are interested in via available parameters. The parameters of the endpoint are as follows:
- group – comma separated metric group names we are interested or all value if we are interested in all of them, for example node,jvm.
- type – comma separated types of metrics that we would like to retrieve or all if we are interested in all types. Possible values are the same as type of metrics that we already mentioned, so: counter, gauge, histogram, meter and timer.
- prefix – the filter that will display metrics starting with the specified prefix. For example saying prefix=INDEX will return only indexing specific metrics.
Let’s now look at some example responses from Solr, so we know what to expect.
For example, to retrieve minor merge related metrics we could run:
http://localhost:8983/solr/admin/metrics?group=all&type=all&prefix=INDEX.merge.minorThe response looks as follows:
<?xml version="1.0" encoding="UTF-8"?>
<response>
<lst name="responseHeader">
  <int name="status">0</int>
  <int name="QTime">0</int>
</lst>
<lst name="metrics">
  <lst name="solr.jvm"/>
  <lst name="solr.jetty"/>
  <lst name="solr.node"/>
  <lst name="solr.core.data.shard1.replica1">
    <lst name="INDEX.merge.minor">
      <long name="count">2</long>
      <double name="meanRate">0.022729587366906834</double>
      <double name="1minRate">0.018095662944349354</double>
      <double name="5minRate">0.00588664962556148</double>
      <double name="15minRate">0.0021316664456582147</double>
      <double name="min_ms">1132.643211</double>
      <double name="max_ms">1415.985689</double>
      <double name="mean_ms">1253.221722818028</double>
      <double name="median_ms">1132.643211</double>
      <double name="stddev_ms">140.09224396740174</double>
      <double name="p75_ms">1415.985689</double>
      <double name="p95_ms">1415.985689</double>
      <double name="p99_ms">1415.985689</double>
      <double name="p999_ms">1415.985689</double>
    </lst>
    <lst name="INDEX.merge.minor.running">
      <int name="value">0</int>
    </lst>
    <lst name="INDEX.merge.minor.running.docs">
      <long name="value">0</long>
    </lst>
    <lst name="INDEX.merge.minor.running.segments">
      <int name="value">0</int>
    </lst>
  </lst>
</lst>
</response>
We can also look at directory related metrics like this:
http://localhost:8983/solr/admin/metrics?group=core&prefix=DIRECTORY&wt=jsonThe response, this time in JSON (because of wt=json in the request) should have the structure that looks as follows:
{
  "responseHeader":{
    "status":0,
    "QTime":0},
  "metrics":[
    "solr.core.gettingstarted.shard1.replica1",[
      "DIRECTORY.total.reads",[
        "count",44502443,
        "meanRate",266358.17622526025,
        "1minRate",111103.14910078928,
        "5minRate",101317.5852718284,
        "15minRate",43604.83723238706],
      "DIRECTORY.total.writes",[
        "count",28269374,
        "meanRate",169199.22568953407,
        "1minRate",65274.18238346925,
        "5minRate",63257.474658024876,
        "15minRate",27508.27281761715]]]}
Reporters
Finally, all the metrics that we discussed so far can be reported automatically by Solr. In Solr 6.4 the following out of the box reporters are available:
- JMX reporter (class org.apache.solr.metrics.reporters.SolrJmxReporter)
- SLF4J reporter (class org.apache.solr.metrics.reporters.SolrSlf4jReporter)
- Graphite reporter (class org.apache.solr.metrics.reporters.SolrGraphiteReporter)
- Ganglia reporter (class org.apache.solr.metrics.reporters.SolrGangliaReporter)
So instead of retrieving the data on demand we can just let Solr report to an external place or log file. We include appropriate configuration in the solr.xml file (in the metrics section) and that is all what needs to be done.
For example, to include all the Solr node query related metrics on the console output of Solr we would include the following fragment in the solr.xml file:
<solr>
 <metrics>
  <reporter name="queryNodeReporter" registry="solr.node" class="org.apache.solr.metrics.reporters.SolrSlf4jReporter">
   <int name="period">60</int>
   <str name="prefix">example_query_stats</str>
   <str name="logger">CONSOLE</str>
   <str name="filter">QUERY</str>
  </reporter>
 </metrics>
</solr>
The above configuration tells Solr, that we want a new reporter called queryNodeReporter to be registered (this name needs to be unique) and we want it to look at the core information for the collection called data reported using the SolrSlf4jReporter, so written to a file. The data will be written to the console file every minute (period number of seconds) and will include information query related metrics (filter value of QUERY). The information written to the console looks as follows:
2017-01-14 20:23:30.940 INFO  (metrics-logger-reporter-1-thread-1) [   ] CONSOLE type=GAUGE, name=QUERY.httpShardHandler.availableConnections, value=0
2017-01-14 20:23:30.940 INFO  (metrics-logger-reporter-1-thread-1) [   ] CONSOLE type=GAUGE, name=QUERY.httpShardHandler.leasedConnections, value=0
2017-01-14 20:23:30.941 INFO  (metrics-logger-reporter-1-thread-1) [   ] CONSOLE type=GAUGE, name=QUERY.httpShardHandler.maxConnections, value=10000
2017-01-14 20:23:30.941 INFO  (metrics-logger-reporter-1-thread-1) [   ] CONSOLE type=GAUGE, name=QUERY.httpShardHandler.pendingConnections, value=0
2017-01-14 20:23:30.941 INFO  (metrics-logger-reporter-1-thread-1) [   ] CONSOLE type=COUNTER, name=QUERY.httpShardHandler.threadPool.httpShardExecutor.running, count=0
2017-01-14 20:23:30.941 INFO  (metrics-logger-reporter-1-thread-1) [   ] CONSOLE type=METER, name=QUERY.httpShardHandler.threadPool.httpShardExecutor.completed, count=0, mean_rate=0.0, m1=0.0, m5=0.0, m15=0.0, rate_unit=events/second
2017-01-14 20:23:30.941 INFO  (metrics-logger-reporter-1-thread-1) [   ] CONSOLE type=METER, name=QUERY.httpShardHandler.threadPool.httpShardExecutor.submitted, count=0, mean_rate=0.0, m1=0.0, m5=0.0, m15=0.0, rate_unit=events/second
2017-01-14 20:23:30.941 INFO  (metrics-logger-reporter-1-thread-1) [   ] CONSOLE type=TIMER, name=QUERY.httpShardHandler.threadPool.httpShardExecutor.duration, count=0, min=0.0, max=0.0, mean=0.0, stddev=0.0, median=0.0, p75=0.0, p95=0.0, p98=0.0, p99=0.0, p999=0.0, mean_rate=0.0, m1=0.0, m5=0.0, m15=0.0, rate_unit=events/second, duration_unit=milliseconds
Of course, we can have numerous reporters defined in the solr.xml and have mixed type of reporters. For example, we can have all core related metrics reported to Graphite and to log file at the same time:
<solr>
 <metrics>
  <reporter name="queryNodeReporter" registry="solr.node" class="org.apache.solr.metrics.reporters.SolrSlf4jReporter">
   <int name="period">60</int>
   <str name="prefix">example_query_stats</str>
   <str name="logger">CONSOLE</str>
   <str name="filter">QUERY</str>
  </reporter>
  <reporter name="exampleGraphiteReporter" group="solr.core.data" class="org.apache.solr.metrics.reporters.SolrGraphiteReporter">
   <str name="host">graphite.my.host.com</str>
   <int name="port">9999</int>
   <int name="period">60</int>
  </reporter>
 </metrics>
</solr>
Which Solr metrics reporter to use
Now that we know that Solr 6.4 can report all these new metrics you’ll need to decide where to write it. If you already have Ganglia or Graphite in your organization and you use it for monitoring other services you may choose to continue using them.
While Ganglia and Graphite were sysadmins’ darlings at some point roughly a decade ago, they are (have been) showing their age. Thus, if you don’t use Ganglia or Graphite today, I strongly suggest you don’t set them up just to have Solr monitoring. There are better options. Similarly, if you need to set up any infrastructure or extra tooling just so you can monitor your Solr clusters you may want to reconsider. That tends to be too costly in terms of people’s time and/or infrastructure, although initially it almost always doesn’t feel that way. You can want to use Sematext SPM for Solr. It’s simple to install (you just need an agent to collect and ship metrics), pre-configured with various out of the box dashboards and alerts and, in short, it lets you troubleshoot Solr performance issues very quickly. What’s more, SPM integrates with Logsene, a hosted log management and analysis service, which makes it even easier to have a single pane of glass for all your operations data, not just Solr, not just metrics, but also metrics for other parts of your infrastructure and other logs. SPM will be soon able to collect and show all the additional metrics introduced with Solr 6.4, so watch out for announcement from us.
Changes in Solr 6.4.2
Starting from Solr 6.4.2 some of the metrics are disabled and some completely removed, because of performance degradation. Keep in mind, that by default, the IndexWriter metrics are disabled and the Directory metrics are completely removed until a better and more performant approach is found.
Where to go from here?
In this post we covered the basics of the new Solr metrics. For more information about Solr metrics visit Solr CWiki pages.
If you are into metrics and monitoring like we are, you will like the new Solr exposing more of its metrics. If you only need this information from time to time for troubleshooting then the new API will come in handy for ad-hoc calls. For production monitoring you should use a good Solr monitoring solution that lets you not only look at the numbers and pretty charts, but also trigger alerts, correlate metrics with logs coming from different sources so that you can find, identify, troubleshoot, and fix problems faster.
To learn more about Solr ops, including its monitoring and metrics, consider Sematext’s Solr training, specifically the Intermediate Solr class that covers Solr monitoring.