[Updated: Instructions for Node.js 4.x / 5.x / 6.x]
We have been using Node.js here at Sematext and, since eating one’s own dogfood is healthy, we wanted to be able to monitor our Node.js apps with SPM (we are in performance monitoring and big data biz). So, the first thing to do in such a case is to add monitoring capabilities for technology we use in-house (like we did for Java, Solr, Elasticsearch, Kafka, HBase, NGINX, and others). For example we monitor Kibana4 servers (based on Node.js), which we have in production for our “1-click ELK stack”.
You may have seen our post about SPM for Node.js — but I thought I’d share a bit about how we monitor Node.js to help others with the same DevOps challenges when introducing new Node.js apps, or even the additional challenge of operating large deployments with a mix of technologies in the application stack:
1) Install the monitoring agent
npm i spm-agent-nodejs
It’s open-sourced on Github: sematext/spm-agent-nodejs
2) add a new SPM App for Node.js — each monitored App is identified by its App-Token (and yes — there is an API to automate this step)
3) set the Environment variable for the application token
export SPM_TOKEN=YOUR_TOKEN
4) add one line to the beginning of your source code when using Node 0.12 – Node 4.x / 5.x got a better option/see below …
var spmAgent = require ('spm-agent-nodejs')5) Run your app and after 60 seconds you should start seeing node.js metrics in SPM
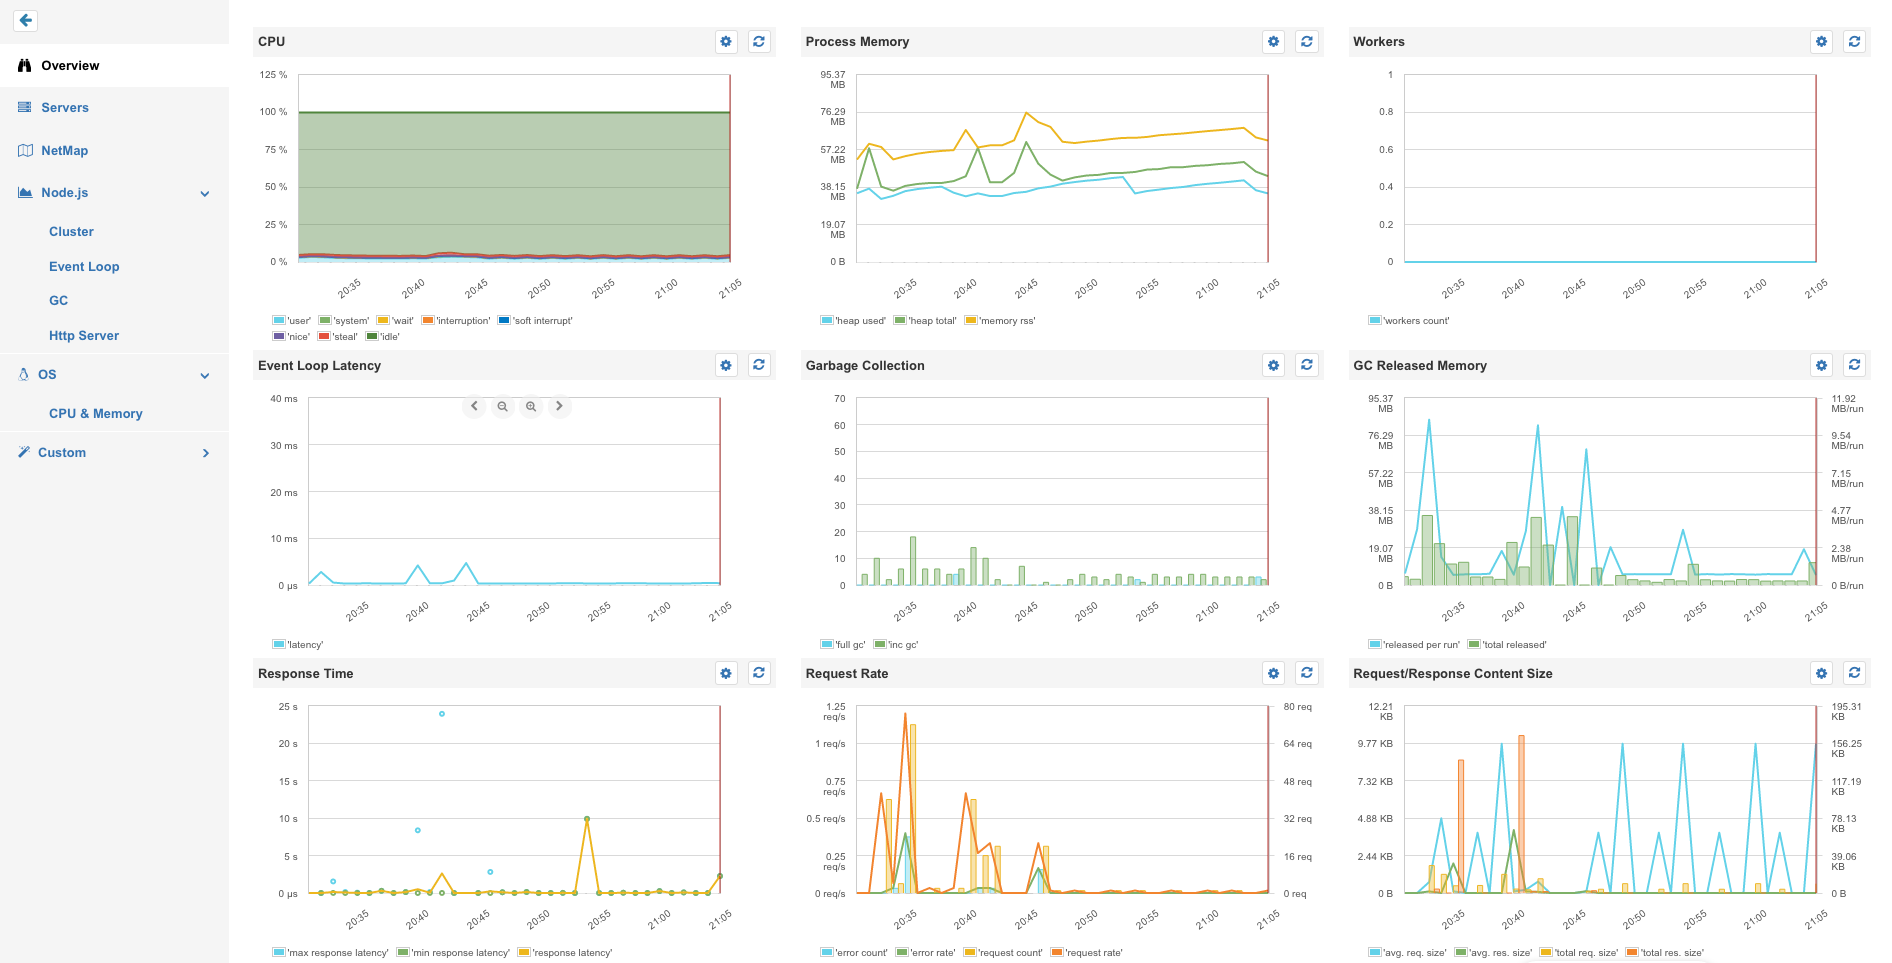
At this point what do I get? I can see pre-defined metric charts like these, with about 5 minutes of work 🙂

I saved time already —there’s no need to define metric queries/widgets/dashboards
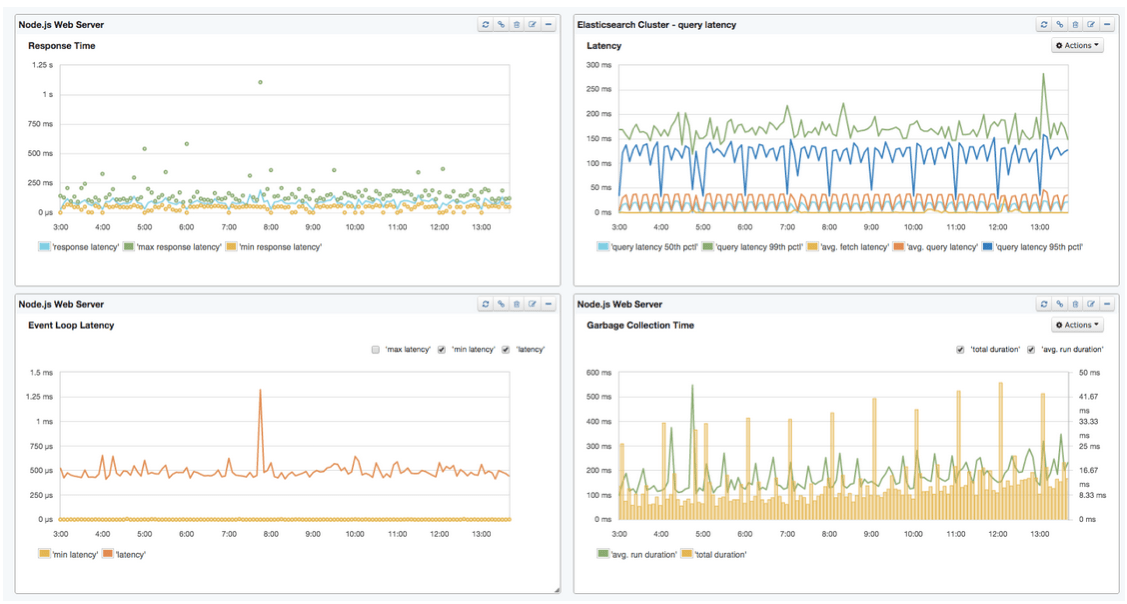
Now I can set up alerts on Latency or Garbage Collection, or I can have anomaly detection tell me when the number of Workers in a dynamic queue changes drastically. I typically set ‘Algolerts’ (basically machine learning-based anomaly detection) to get notified (e.g. via PagerDuty) when a service suddenly slows down because they produce less noise than regular threshold alerts. In addition, I recommend adding Heartbeat alerts for each monitored service to be notified of any server outages or network problems. In our case, where a Node.js app runs tasks on Elasticsearch, it makes sense to create a custom dashboard to see Elasticsearch and Node.js metrics together (see 2nd screenshot above) — of course, this is applicable for other applications in the stack like NGINX, Redis or HAProxy — and can be combined with Docker container metrics
In fact, you can use the application token for multiple servers to see how your cluster behaves using the “birds eye view” (a kind of top + df to show the health of all your servers)
Now, let’s have a look at how the procedure differs when using Node 4.x or Node 5.x
Node 4.x/5.x/6.x Supports Preloading Modules
When we use the new node.js preload command-line option, we can add instrumentaion without adding the require statement for ‘spm-agent-nodejs’ to the source code:
That’s why Step 4) could be done even better with node 4.x/5.x:
node -r spm-agent-nodejs yourApp.js
This is just a little feature but it shows how the node.js community is listening to the needs of users and is able to release such things quickly.
If you want to try node 4.x/5.x, here is how to install it using n:
npm i n -g
n lts      # for node 4.x or
n stable   # for node 6.x
The ‘node’ executable is now linked to the new node version 4.x/5.x /6.x — to switch back to node 0.12 simply use
n 0.12
I hope this helps. If you’d like to see some Node.js metrics that are currently not being captured by SPM then please hit me on Twitter — @seti321 — or drop me an email. Or, even better, simply open an issue here: https://github.com/sematext/spm-agent-nodejs/ Enjoy!
