Apache – the technology that powers the web. I’m not sure if that is correct, but I think that we wouldn’t see the world wide web in its current shape without it. Launched in 1995 and since April 1996, it has been the most popular web server around the world.
Because of handling your users’ requests, Apache serves as the front application. It is crucial to understand what your server is doing, what file users are accessing, from where they came, and much, much more.
The visibility that Apache logs give you is invaluable in understanding the traffic coming to your application, the errors that happen, and the performance of the user-facing elements. Today, we will look into what the Apache web server logs are, how to interpret them, and how to analyze them easily.
What Are Apache Logs?
Apache logs are text files that contain all the information on what the Apache server is doing. They provide insight into which resources were accessed, when they were accessed, who accessed them, and metrics related to that. They also include information about the errors that happened, resource mapping process, the final resolution of the connection, and many, many more.
In general, the whole Apache logging process comes in multiple phases. First, you need to store the logs somewhere for historical analytical purposes. Second, you need to analyze the logs and parse them to retrieve useful information and metrics. And finally, you may want to graph the data as the visual representation is easier to analyze and understand for a human person.
What Is the Apache Access Log?
The Apache access logs are text files that include information about all the requests processed by the Apache server. You can expect to find information like the time of the request, the requested resource, the response code, time it took to respond, and the IP address used to request the data.
Apache Access Logs Location
The location of the Apache server access log differs depending on the operating system that you are using.
- On Red Hat, CentOS, or Fedora Linux, the access logs can be found in the
/var/log/httpd/access_logby default. - On Debian and Ubuntu, you can expect to find the Apache logs in the
/var/log/apache2/access.logand - FreeBSD will have the Apache server access logs stored in
/var/log/httpd-access.logfile.
You can configure its location using the CustomLog directive, for example:
CustomLog "/var/log/httpd-access.log"
Apache Access Log Format Configuration
Before we learn about the different log formats, let’s discuss what the Apache HTTP can do when it comes to formatting. There are two most common access log types that you can use and that the Apache server will translate to meaningful information:
- Common Log Format
- Combined Log Format
The log formatting directives are used in combination with the LogFormat option:
LogFormat "%t %h %m \"%r\"" custom
The above line tells that the “%t %h %m \”%r\”” format should be used and assigned to an alias called custom. After that, we can use the custom alias when defining Apache logging. For example:
CustomLog "logs/my_custom_log" custom
The above section will tell Apache to write logs in the logs/my_custom_log file with the format defined by the custom alias. The above configuration will result in logging:
- time of the request thanks to the %t directive,
- remote hostname thanks to the %h directive,
- HTTP method thanks to the %m directive,
- the first line of the request surrounded by double quotes thanks to the %r directive.
Of course, there are way more directives that can be used and the complete list can be found in the mod_log_config documentation of the Apache server.
Common Log Format
The Apache Common Log Format is one of the two most common log formats used by HTTP servers. You can expect it to see its definition to look similar to the following line:
LogFormat "%h %l %u %t \"%r\" %>s %b" common
Here’s how an access log from that log file looks like:
10.1.2.3 - rehg [10/Nov/2021:19:22:12 -0000] "GET /sematext.png HTTP/1.1" 200 3423
As you can see the following elements are present:
- %h, resolved into 10.1.2.3 – the IP address of the remote host that made the request.
- %l, remote log name provided by identd, in our case a hyphen is provided, which is a value that we can expect to be logged in a case when the information provided by the logging directive is not found or can’t be accessed.
- %u, resolved into rehg, the user identifier determined by the HTTP authentication.
- %t, the date and time of the request with the time zone, in the above case it is [10/Nov/2021:19:22:12 -0000]
- \”%r\”, the first line of the request inside double quotes, in the above case it is: “GET /sematext.png HTTP/1.1”
- %>s, the status code reported to the client. This information is crucial because it determines whether the request was successful or not.
- %b, the size of the object sent to the client, in our case the object was the sematext.png file and its size was 3423 bytes.
Combined Log Format
The Apache Combined Log Format is another format often used with access logs. It’s very similar to the Common Log Format but includes two additional headers – the referrer and the user agent. Its definition looks as follows:
LogFormat "%h %l %u %t \"%r\" %>s %b \"%{Referer}i\" \"%{User-agent}i\"" combinedAnd the example log line produced by the above log line looks like this:
10.1.2.3 - grah [12/Nov/2021:14:25:32 -0000] "GET /sematext.png HTTP/1.1" 200 3423 "http://www.sematext.com/index.html" "Mozilla/5.0 (Windows NT 10.0; Win64; x64) AppleWebKit/537.36 (KHTML, like Gecko) Chrome/79.0.3945.74 Safari/537.36 Edg/79.0.309.43"
Custom Log Format
There is one more thing that we should discuss when it comes to Apache Server logging configuration – the CustomLog directive. We’ve already seen that configuration directive, but let’s discuss that in greater details.
Multiple Access Logs
It is possible to have multiple Apache access logs at the same time without any additional effort. We may want a limited set of information available in some files for quick scanning and the full log using the Combined Log Format if we need the complete information. For example, we could have three access log files – one that includes time, user agent, and the status code, the second that includes the time, IP address, and referrer used, and the third – the Common Log Format.
To do that we need to include multiple CustomLog sections in our configuration file:
LogFormat "%h %l %u %t \"%r\" %>s %b" common
CustomLog logs/agent_log "%t %{User-agent}i %>s"
CustomLog logs/referer_log "%t %h %{Referer}i"
CustomLog logs/access_log common
You can see that this time we didn’t use three separate LogFormat configuration options, but we’ve specified the apache log format in the CustomLog format line. This is also possible and very convenient when the formatting of the log lines is used only in that given file.
Conditional Logs
There are cases when you would like to write logs only when a certain condition is met. This is what Apache Server calls conditional logging. It is done by using the CustomLog directive and environment variables. For example, if you would like to log all requests accessing your PNG files in a separate file you can do that the following way:
SetEnvIf Request_URI \.png$ png-image-log
CustomLog "png-access.log" common env=png-image-log
Logs Rotation and Piped Logs
Depending on the logging configuration and the traffic that your Apache servers are handling, logging can be extensive. All the logs that you keep on the machine take space and if you are not using a log centralization solution like Sematext Logs, you will have to deal with space and management of logs.
Let’s talk about log rotation first. Log rotation is a process of creating a new log file that the Apache HTTP server will start writing to and renaming the old log file, so it is no longer updated. The log rotation happens when you gracefully restart the server. That means that without any kind of client requests processing interruption a new log file is created. In production environments, you would like to restart the Apache servers though.
That’s why the Apache server supports piped logs. Instead of writing the log events to a file, you use the piped logs to send the log events to a different application that will handle the log processing – for example to rotatelogs:
CustomLog "|/usr/local/apache/bin/rotatelogs /var/log/access.log 86400" common
The rotatelogs application comes with Apache server and is capable of rotating logs without the need of restarting the server. The above example will result in rotating the /var/log/access.log file every 24 hours.
How to Read Apache Access Logs
Apache server access logs are just simple text files. They can be easily opened by any tool that can read such files. On Linux-based systems, this can be the cat command-line tool or tail if you want to monitor the log lines as they go.
There are two caveats, though. The first is access policies. You may not have access to the machines running Apache HTTP server and even if you do, you may not have read access to the appropriate log directories. The second is distribution. It is not uncommon to have multiple Apache servers distributed across multiple data centers. In such a case, it is way easier to use a dedicated observability tool such as Sematext Logs that will provide not only the option to look into the raw files but also aggregated information into the key metrics derived for them.
Understanding Apache Access Logs
Our Apache access logs files are easy to read and not hard to understand either. Just remember about the patterns that you’ve used in your configuration. We’ve already covered the common patterns that you can encounter in the Apache log files. Keep in mind that understanding the log files is even easier with log analysis tools that do the parsing for you and give you an aggregated view of the data which is easier to understand.
What Is the Apache Error Log?
So far, we’ve talked about the Apache access log that gives us information on the accessed resources. But it is not the only thing that we should be interested in. We should also care about everything related to errors. In fact, the error log is the most important log file for the Apache HTTP server.
The Apache error log is where all the errors that happened during the processing of the requests. The most important thing, though, is that the error log will contain information on what went wrong during the Apache server startup and it is very likely that it will also contain hints on how to fix the issue.
Apache Errors Logs Location
Where the Apache error log is stored differs depending on the operating system on which it is running.
- On Red Hat, CentOS, or Fedora Linux, the access logs can be found in the
/var/log/httpd/error_logby default. - On Debian and Ubuntu, you can expect to find the Apache logs in the
/var/log/apache2/error.log - FreeBSD will have the Apache server access logs in
/var/log/httpd-error.logfile.
You can configure its location using the ErrorLog directive, for example:
ErrorLog "/var/log/httpd-error.log"
Apache Error Log Format Configuration
Similar to the Apache access log, you can adjust the format of the error log. The Apache error log format is configured by using the ErrorLogFormat element, for example:
ErrorLogFormat “[%{u}t] [%-m:%l] [pid %P:tid %T] [client\ %a] %M”
The above configuration would produce an Apache error log entry similar to the following one:
[Wed Nov 10 10:21:23.811033 2021] [core:error] [pid 22308:tid 3212342123] [client 10.1.2.3] File does not exist: /usr/local/apache2/htdocs/favicon.ico
In the above example the following formatting options were used:
- %{u}t – the current time including microseconds,
- %-m – the module that produced the error,
- %l – the level of the log event,
- %P – process identifier,
- %T – thread identifier,
- %M – the actual log message.
The full description of the available formatting options is available in the official Apache Server documentation.
Log Levels
In addition to what we discussed so far there is one other thing worth mentioning – the level of log events. The LogLevel directive allows specifying the level of log messages on a per-module basis. For example, if we would like the main log level for all events to be set to the info level but have the error level only for the rewrite module, we could have a configuration directive as follows:
LogLevel info rewrite:error
The following logging levels are described in Apache server documentation:
- emerg
- alert
- crit
- error
- warn
- notice
- info
- debug
- trace1 – trace8
The emerg one is the log event that says that the system is unstable and the trace levels are used for very low-level information logging that you can probably skip.
How to View Apache Error Logs
Viewing the Apache server error logs is just as simple as opening the text file. The error logs are not different from the access logs, so they are just simple text files. You can use whatever tools you want to look into them. But keep in mind that looking into logs from multiple Apache servers distributed across multiple data centers can be challenging. That’s why we strongly suggest using log aggregation tools, such as Sematext Logs, for that job.
Apache Log File Management and Analysis with Sematext
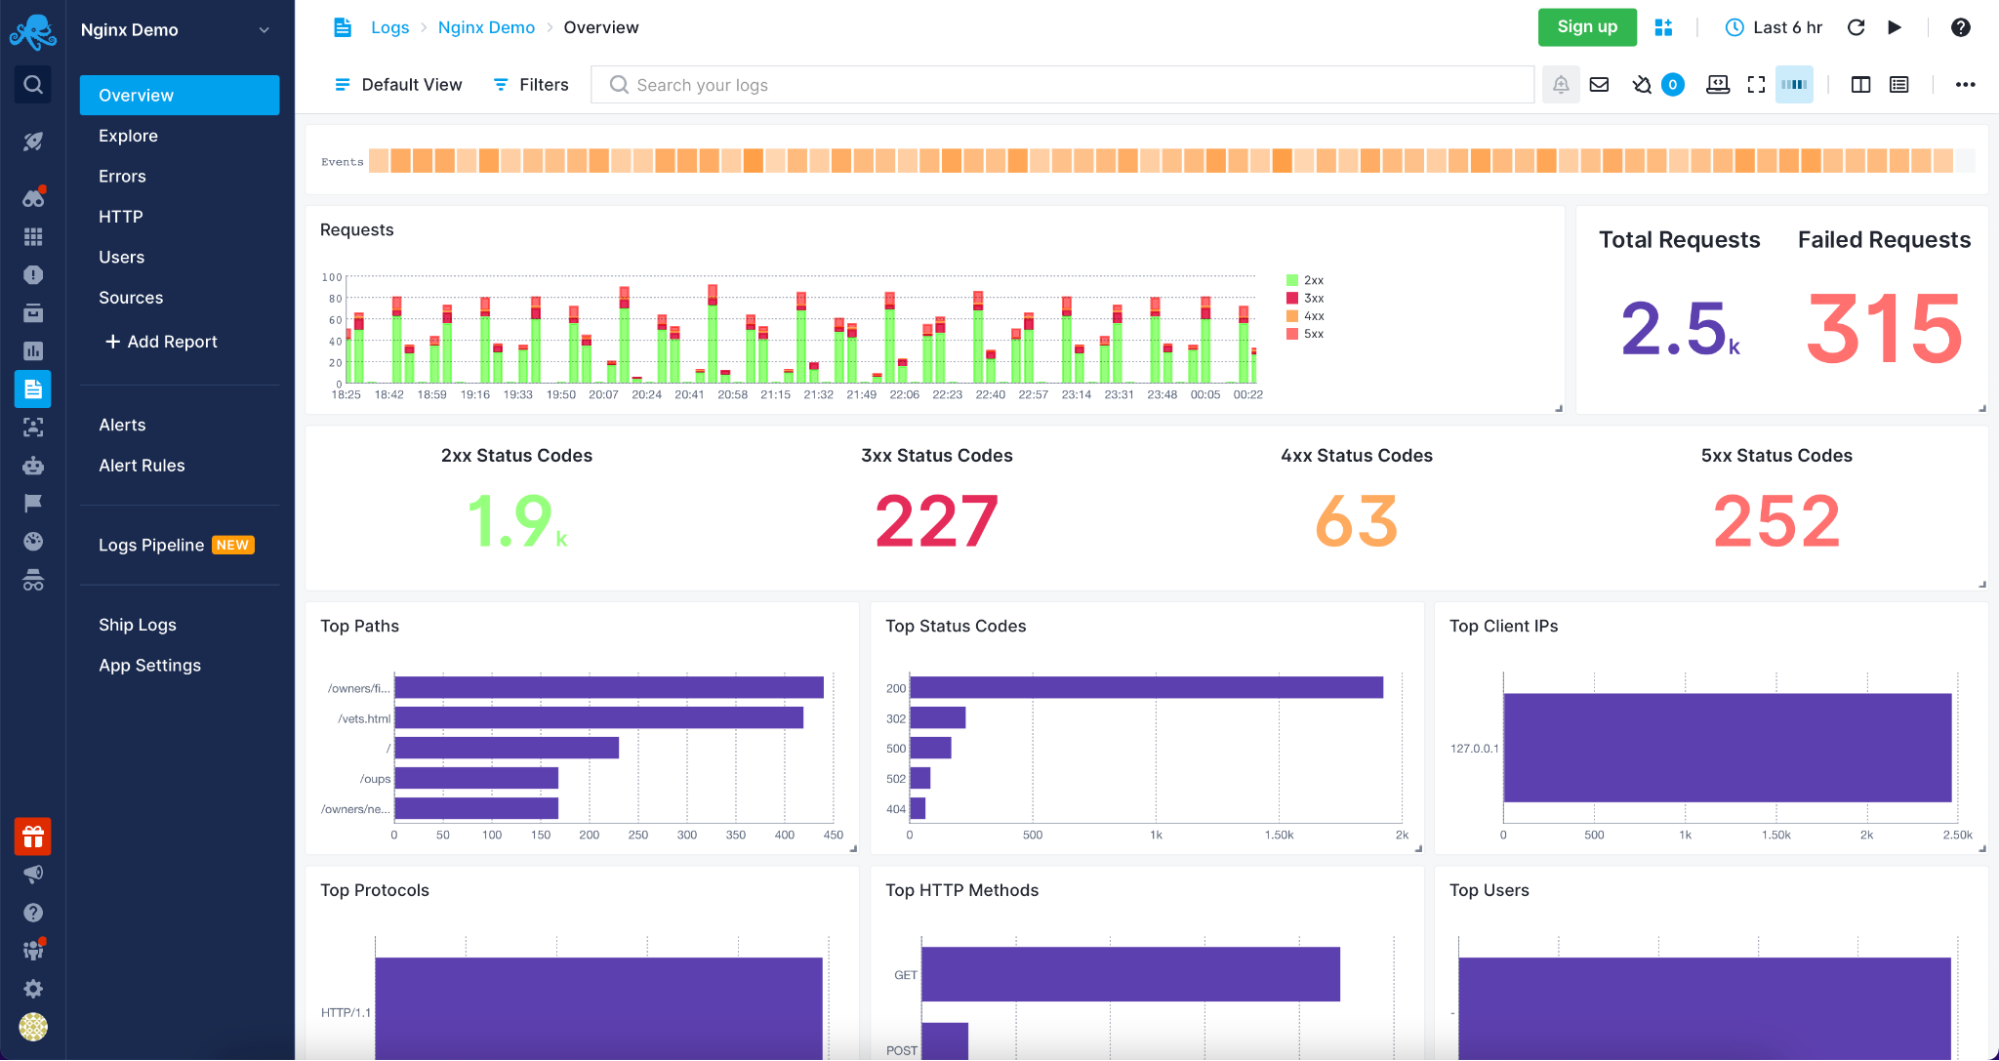
Sematext Cloud Logs – Apache Overview
Understanding and analyzing your Apache servers logs was never easier than with Sematext Logs. The only thing that you need to do is create an account with Sematext, create the Apache Logs App and install the Sematext Agent. You will be guided through the process of setting up the automatic Logs Discovery for your Logs. Your logs will be parsed and sent to the Sematext Logs giving you access to a variety of pre-built reports tailored for your Apache HTTP server.
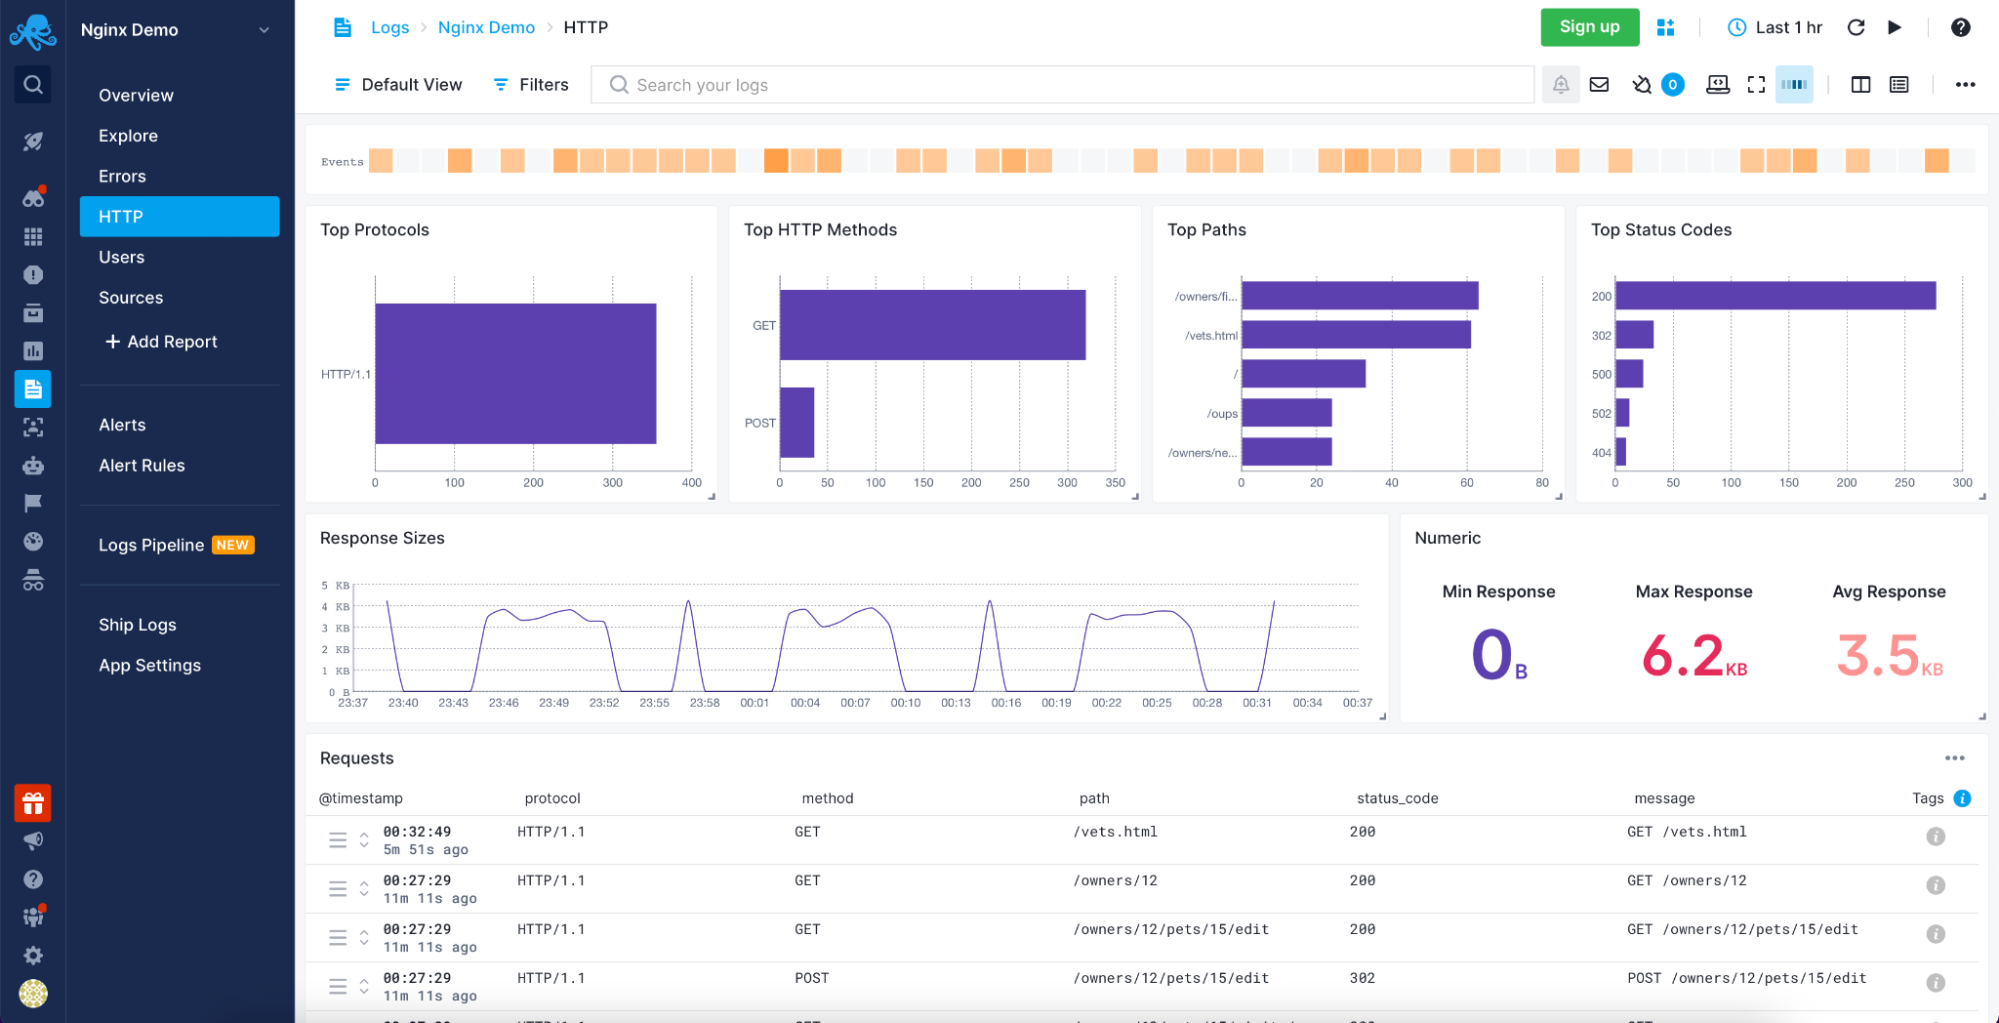
Sematext Logs – Apache HTTP Information
Sematext Logs is part of the Sematext Cloud full-stack monitoring solution providing you with all you need when it comes to observability. With Sematext Cloud, you get an overview of your Apache servers, errors report, HTTP report, including top HTTP methods and paths with an average response size visualization and requests table. You can see your users with the top User Agents used to access resources served by your Apache servers and, finally, the sources for the data. All within a single Apache Logs monitoring in Sematext Cloud.
Still not sure which open-source search engine to use? Check out this quick video comparing Apache Solr and Elasticsearch below:
Conclusion
Analyzing your Apache servers logs is invaluable in understanding the traffic coming to your application, the errors that happen, and the performance of the user-facing elements. A log management tool such as Sematext Logs does this job for you.
More than understanding server logs, knowing what resources were accessed, who accessed them, and how long it took to process the request is crucial to understanding your user’s behavior. You also need to be sure that you are aware of every error that happens so that you can react as soon as possible. Combining that with the need for distributed infrastructures to handle a large number of concurrent users and provide high availability, using an observability tool is a necessity.
Having Apache metrics and logs in the same place, being able to slice and dice them, being alerted when issues appear and having insight into every piece of your environment is no longer something good to have but need to have. All of that and more is provided by Sematext Cloud, an observability platform with dedicated Apache server logs and metrics support. Built with simplicity in mind and requiring no credit card, nothing stops you from giving it a try to see how it can improve your log management and log analysis processes.