When new web browser versions are released, new bugs are inevitably introduced, which can degrade a website’s performance and increase the overall page load time. This can severely impact a user’s engagement and a business’s bottom line.
Studies have shown that if a website takes longer than 4 seconds to load, 1 in 4 visitors will leave the site and seek an alternative. Page load time is also very important when it comes to SEO – some of the popular search engines can penalize a website in favor of a competitor if the competitor’s website offers a faster page load time and, therefore, a better user experience. When it comes to increasing your website’s user base and engagement, page load time plays a crucial role that simply cannot be overlooked.
Let’s look at what a browser update website anomaly is, what causes it and how you can monitor and fix it for different web browsers.
What Is a Browser Update Website Anomaly?
A website performance anomaly caused by browser updates can be anything from a slowdown in page load time to a slowdown while rendering a page element. Anything that affects a website’s overall speed and performance when viewed from an end user’s perspective can be considered a performance anomaly.
How Can Browser Updates Cause Website Performance Anomalies?
Updates for the major web browsers are often released to address security issues, add new features, fix bugs and so on. A browser update website anomaly can be introduced when major web browsers release a new version of their web browser, as the changes to the code base will often introduce unwanted bugs and other side effects.
On average, Google releases a new version of their Chrome web browser every 45 days. As Google Chrome users then update to the latest version, any website that hasn’t been tested against the update runs the risk of suffering a performance bottleneck introduced by the latest release. The risk of losing website visitors and existing customers increases substantially if a performance bottleneck is introduced but subsequently left undetected.
How to Fix Website Performance Problems Caused by Browser Updates?
Real user monitoring records actual user interaction with a website or other cloud-based application. Monitoring the interaction of real users is an important step to ensure a smooth end-user experience, as well as quickly discover any issues when they occur. To detect and avoid performance anomalies caused by different web browser versions, we can use real user monitoring tools like Sematext Experience.
Using Sematext Experience to Monitor Performance Anomalies Caused by Browser Updates
Sematext Experience includes Browser filter, which allows one to filter the displayed results based on the web browser version being used by the website visitors.
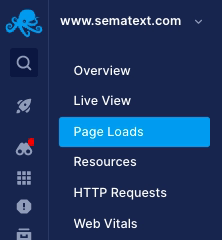
To achieve this, we will open Sematext Experience and select the App we would like to check for performance anomalies. In our example, the App we will check is named after the URL it is monitoring – www.sematext.com. Once opened, choose the web performance metric you would like to monitor from the left-side menu. In our example, we are looking for page load anomalies, so we will select Page Loads.
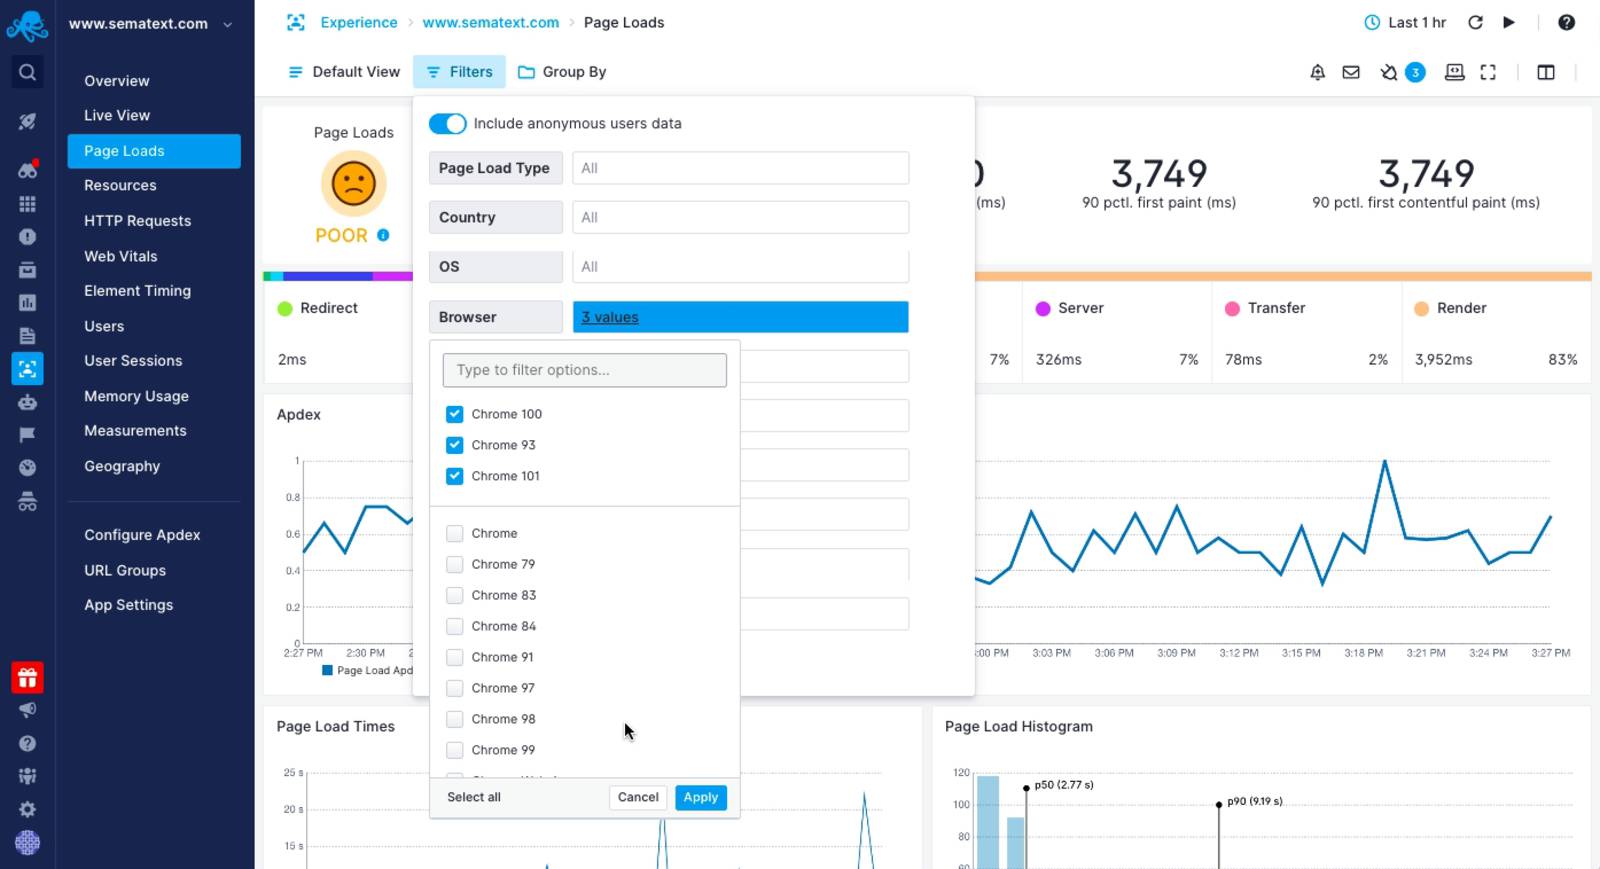
For this example, we would like to check how our website performs in Google Chrome and specifically in versions 93, 100 and 101. To do this, we will set a filter on each of the required browser versions. In the Page Loads overview page, we will select Filters >> Browser >> Browser Version(s) and click Apply.
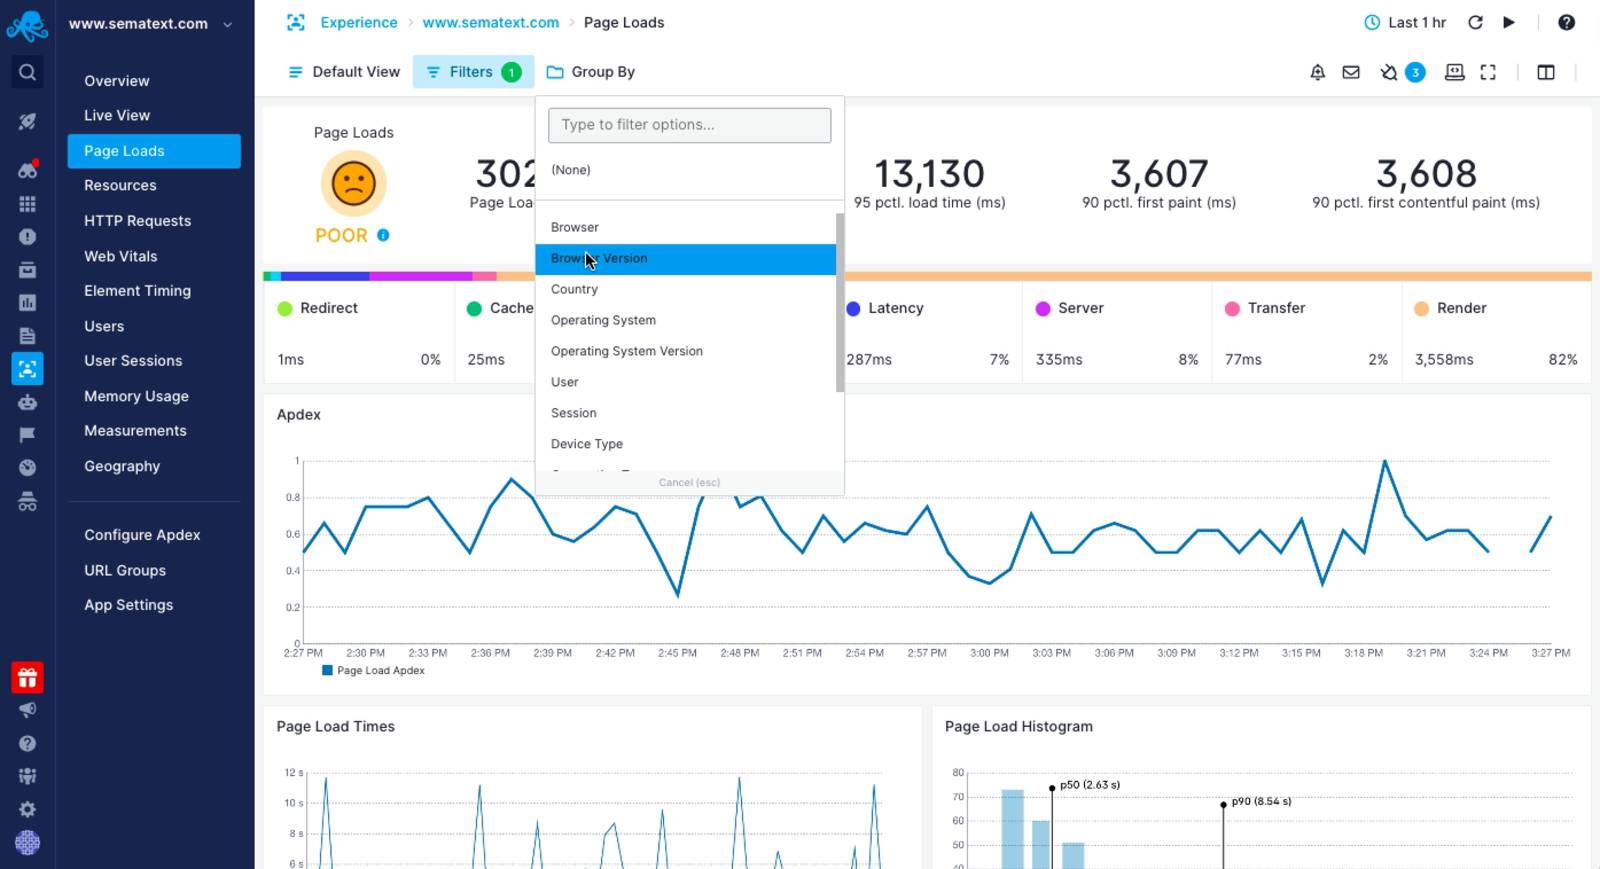
To group the results based on our selected web browser versions, we will select Group By >> Browser Version.
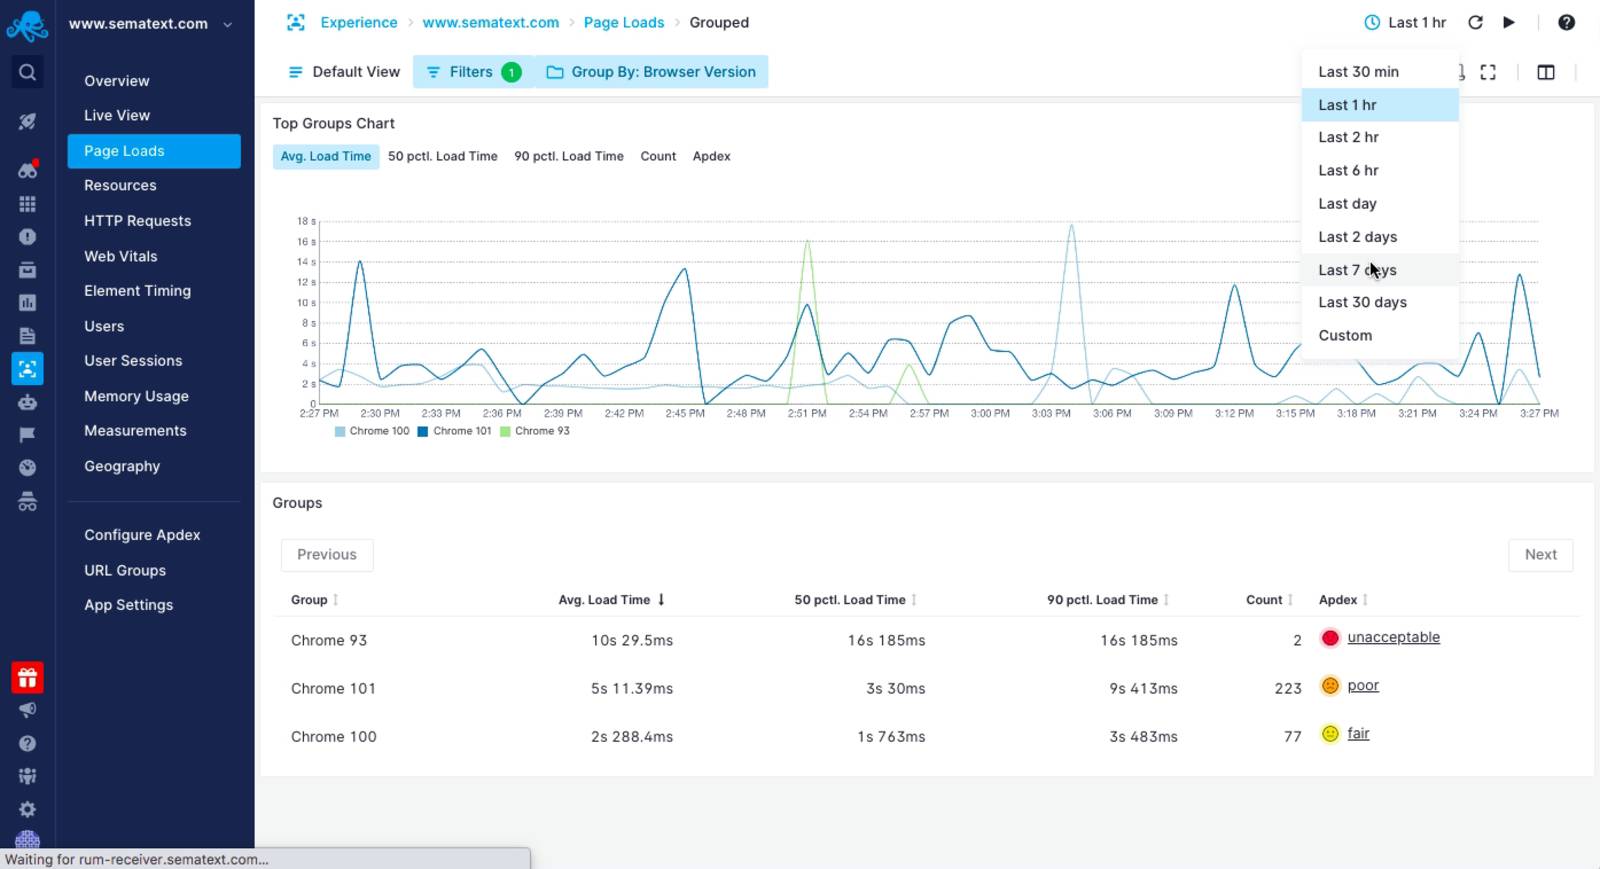
Our chart is now displaying a representation of the Page Load times for every user visiting the website in Google Chrome versions 93, 100 and 101 within the last hour.
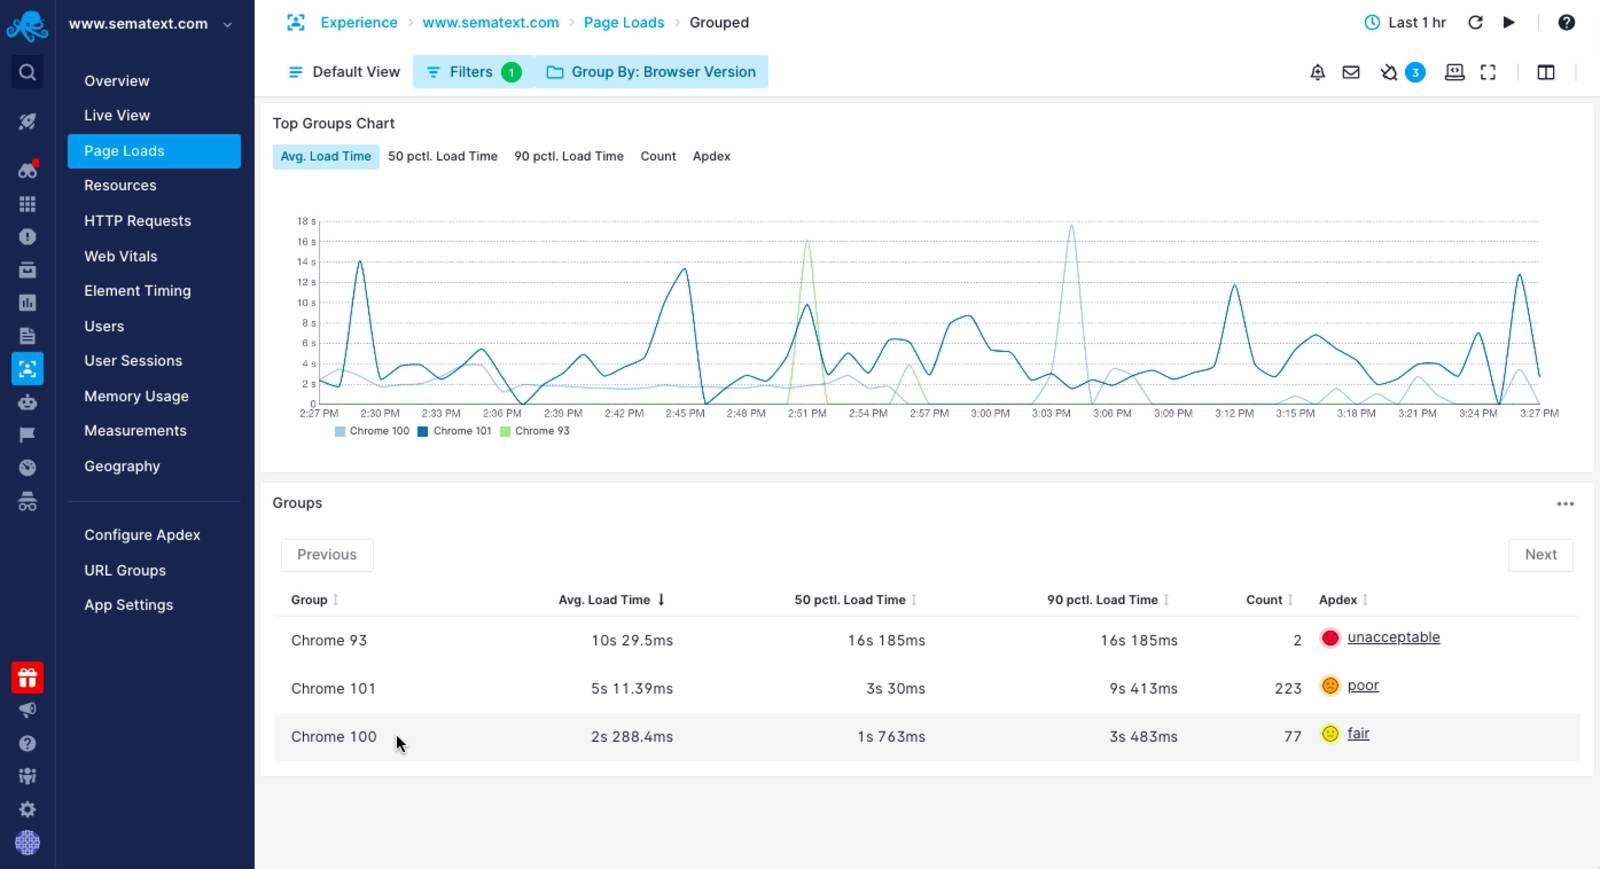
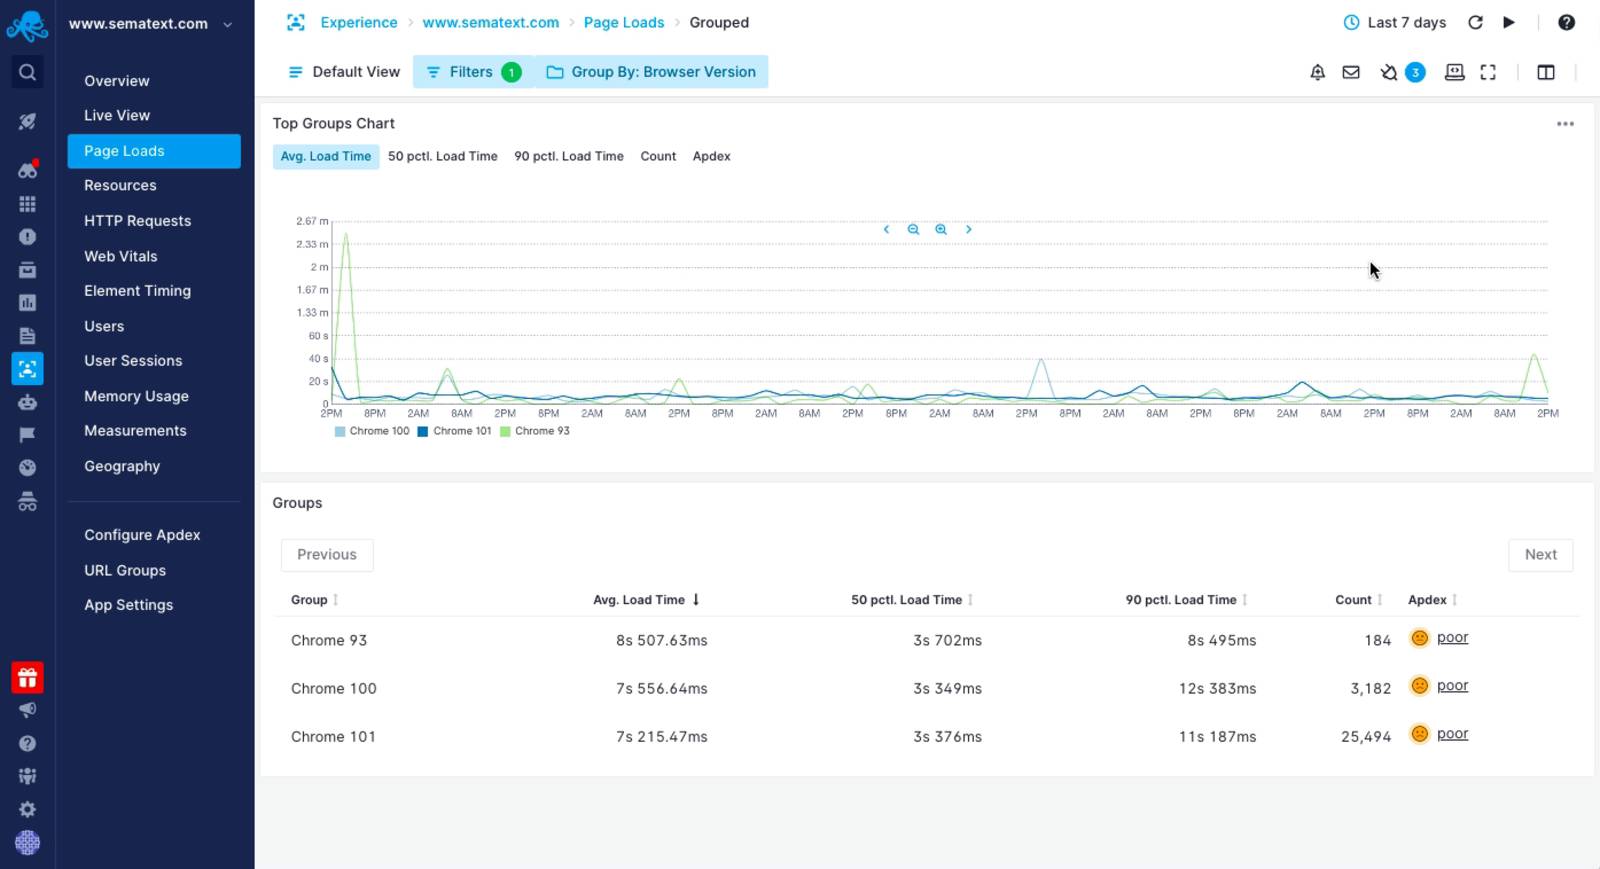
As seen in the image above, we have only two users visiting the website using Google Chrome 93 within the last hour. To get a more accurate representation of how our website is performing for our users, we will increase the measured time period to 7 days. This can be changed as required, though increasing the period to span several months would give an even more accurate representation of real-user performance data.
We can now see that, on average, it takes approximately an extra second for the website to fully load for Google Chrome 93 users.
Now that we have determined that our website is taking an extra second to load, we can then start to debug our website in Google Chrome 93 using the Chrome DevTools to determine the cause of the bottleneck. For further information on debugging performance bottlenecks using the Chrome DevTools, please see the Google Chrome Developer documentation here.
Conclusion
As your website grows, it is crucial to monitor its performance and stay on top of any bottlenecks as and when they arise. Performance bottlenecks can have a detrimental impact on your user base and ultimately lead to lost customers and revenue. That is why we’ve built – and are constantly improving – Sematext Experience so that we can provide you with a comprehensive, affordable, and easy-to-use monitoring solution, helping you to stay ahead of the competition and keep your website performing in top shape.
Don’t hesitate and give Sematext Experience a try if you don’t have a full observability solution yet or if you are evaluating different options. It comes with a 14-day free trial and doesn’t require a credit card. It is as simple as creating a free account and following the onboarding steps!