Keeping an eye on everything that could affect your customers is a key part of providing a service. In the tech world, this would mean monitoring anything from low-level performance metrics to high-level business KPIs. Even server-side logs or stack traces that give you full visibility into business and software processes that underpin your product need to be watched.
This is where cloud monitoring tools and services come into play. Cloud Monitoring tools help you manage, monitor, and assess the performance of your cloud computing architecture, infrastructure, services, and applications. These tools help you provide the best user and customer experience your platform has to offer.
In this blog post, we’re going to introduce you to some of the best cloud monitoring solutions available on the market to help you get started.
What Is Cloud Monitoring?
Cloud monitoring is a process of gaining observability into your cloud-based infrastructure, services, applications, and user experience.
Cloud monitoring lets you observe, review, and predict the performance and availability of the whole infrastructure. A complete monitoring solution should give you a birds-eye view of your system and allow you to drill down into each individual asset.
A cloud monitoring tool works by collecting observability data from your whole IT infrastructure. It then analyses and presents this data in a format understood by humans, like charts, graphs, and alerts. A great monitoring tool will also be able to communicate with other machines via APIs.
Top Cloud Monitoring Tools
There are many types of monitoring tools on the market. Some help you gain observability into your infrastructure, services, applications, while others monitor your website performance and health.
While some of these solutions may only help you with a few aspects of monitoring, others give you full visibility into key performance indicators, metricss, logs, traces , etc. Some of the tools in this list are easy to set up, others more difficult. Some require you to speak with a sales representative, while others have transparent pricing plans.
Each solution has its pros and cons, and we will lay it out here plainly for you to decide. Here’s our comparison of the best cloud performance monitoring services available in 2022:
1. Sematext Cloud
Sematext Cloud is a full-stack cloud monitoring solution that is easy to set up and gives you in-depth visibility into your IT infrastructure. They also offer an on-premise solution – Sematext Enterprise.
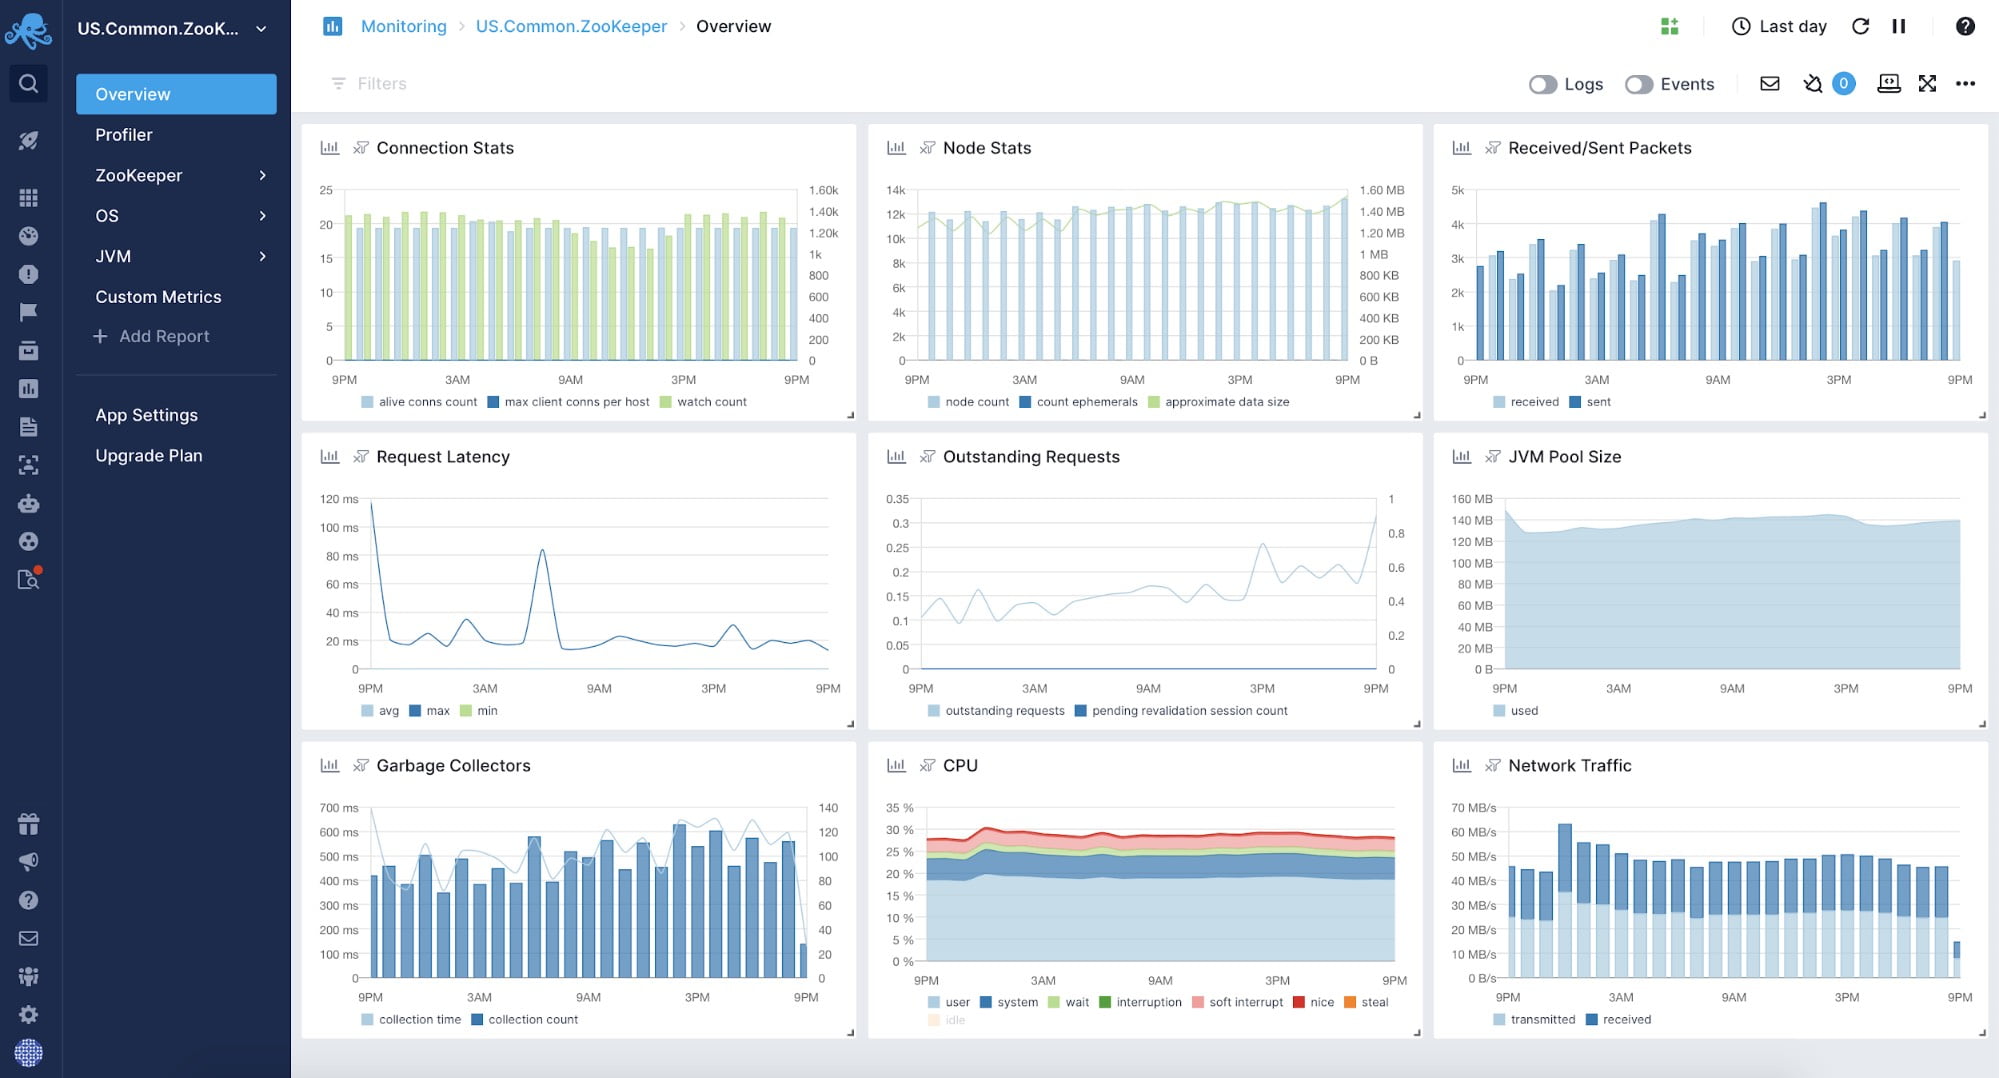
Sematext’s auto-discovery finds your services automatically. This lets you start monitoring all of your services directly through the user interface.
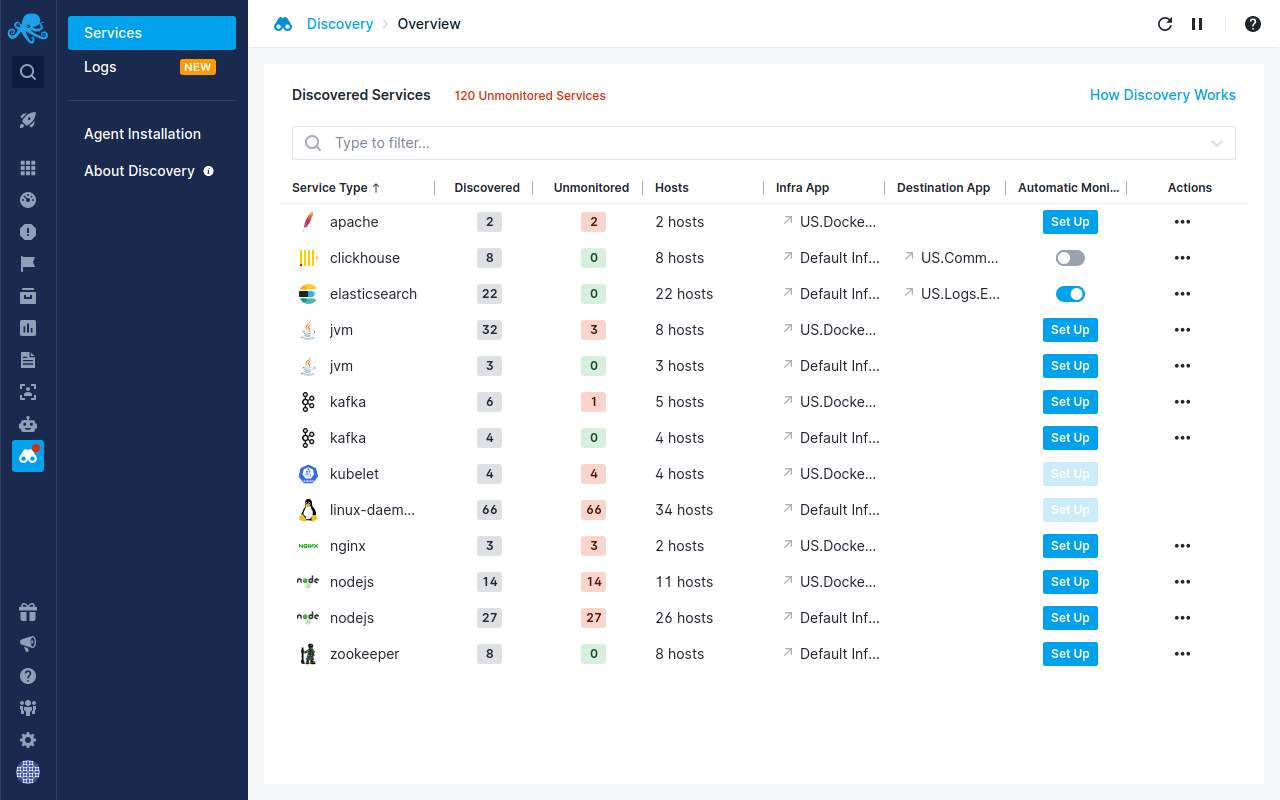
Premade dashboards with key cloud application and infrastructure metrics come out-of-the-box with Sematext. (common databases and NoSQL stores, servers, containers, etc.)
Customize your dashboard to suit your needs and save them as presets to use again in the future.
Sematext also has a powerful alerting system with anomaly detection and scheduling.
More Features:
- Auto-discovery of services enables hands-off auto-monitoring.
- Full-blown log management solution with filtering, full-text search, alerting, scheduled reporting, AWS S3, IBM Cloud, and Minio archiving integrations, Elasticsearch-compatible API, and Syslog support.
- Real user monitoring and synthetic monitoring for full visibility of how your users experience your front-end and your APIs perform.
- Comprehensive support for microservices and containerized environments – support for Kubernetes, Docker, and Docker Swarm with the ability to observe applications running in them, too; collection of their metrics, logs, and events.
- Network, database, processes, and inventory monitoring.
- Alerting with anomaly detection and support for external notification services like Slack, MS Teams, PagerDuty, OpsGenie, VictorOps, WebHooks, etc.
- Powerful dashboarding capabilities for graphing virtually any data shipped to Sematext.
- Scheduled reporting.
Sematext Cloud is the solution that gives you both reactive and predictive monitoring with easy analysis with the purpose of delivering a better experience to your users.
Pros:
- Lots of out of the box integrations, including MySQL, Apache Cassandra, and many more.
- Lightweight, open-sourced, and pluggable agents.
- Quick setup.
- Powerful Machine Learning-based alerting and notifications system to quickly inform you about issues and potential problems with your environment.
- Elasticsearch and InfluxDB APIs allow for the integration of any tools that work with those, like Logstash, Filebeat, Fluentd, Logagent, Vector, etc.
- Easy correlation of performance metrics, logs, and various events.
- Collection of IT inventory – installed packages and their versions, detailed server info, container image inventory, etc.
- Straightforward pricing with free plans available.
Cons:
- Limited support for transaction tracing.
- Lack of full-featured profiler.
Pricing:
There is no need to speak with a sales representative, but they do have one of the highest review ratings for customer service should the need arise.
The pricing for each solution is straightforward and each solution lets you choose your own plan.
Pricing is super flexible for the cost-conscious — you have the flexibility of picking a different plan for each of your Apps.
For Logs, there is a per-GB volume discount as your log volume or data retention goes up. Performance monitoring is metered by the hour, which makes it suitable for dynamic environments that scale up and down.
Real user monitoring allows downsampling that can minimize your cost without sacrificing the value. Synthetic monitoring has a cheap pay-as-you-go option.
If you’re interested to learn about how Sematext Cloud can help you with your cloud monitoring needs, then check out this short video to get started:
2. AppDynamics
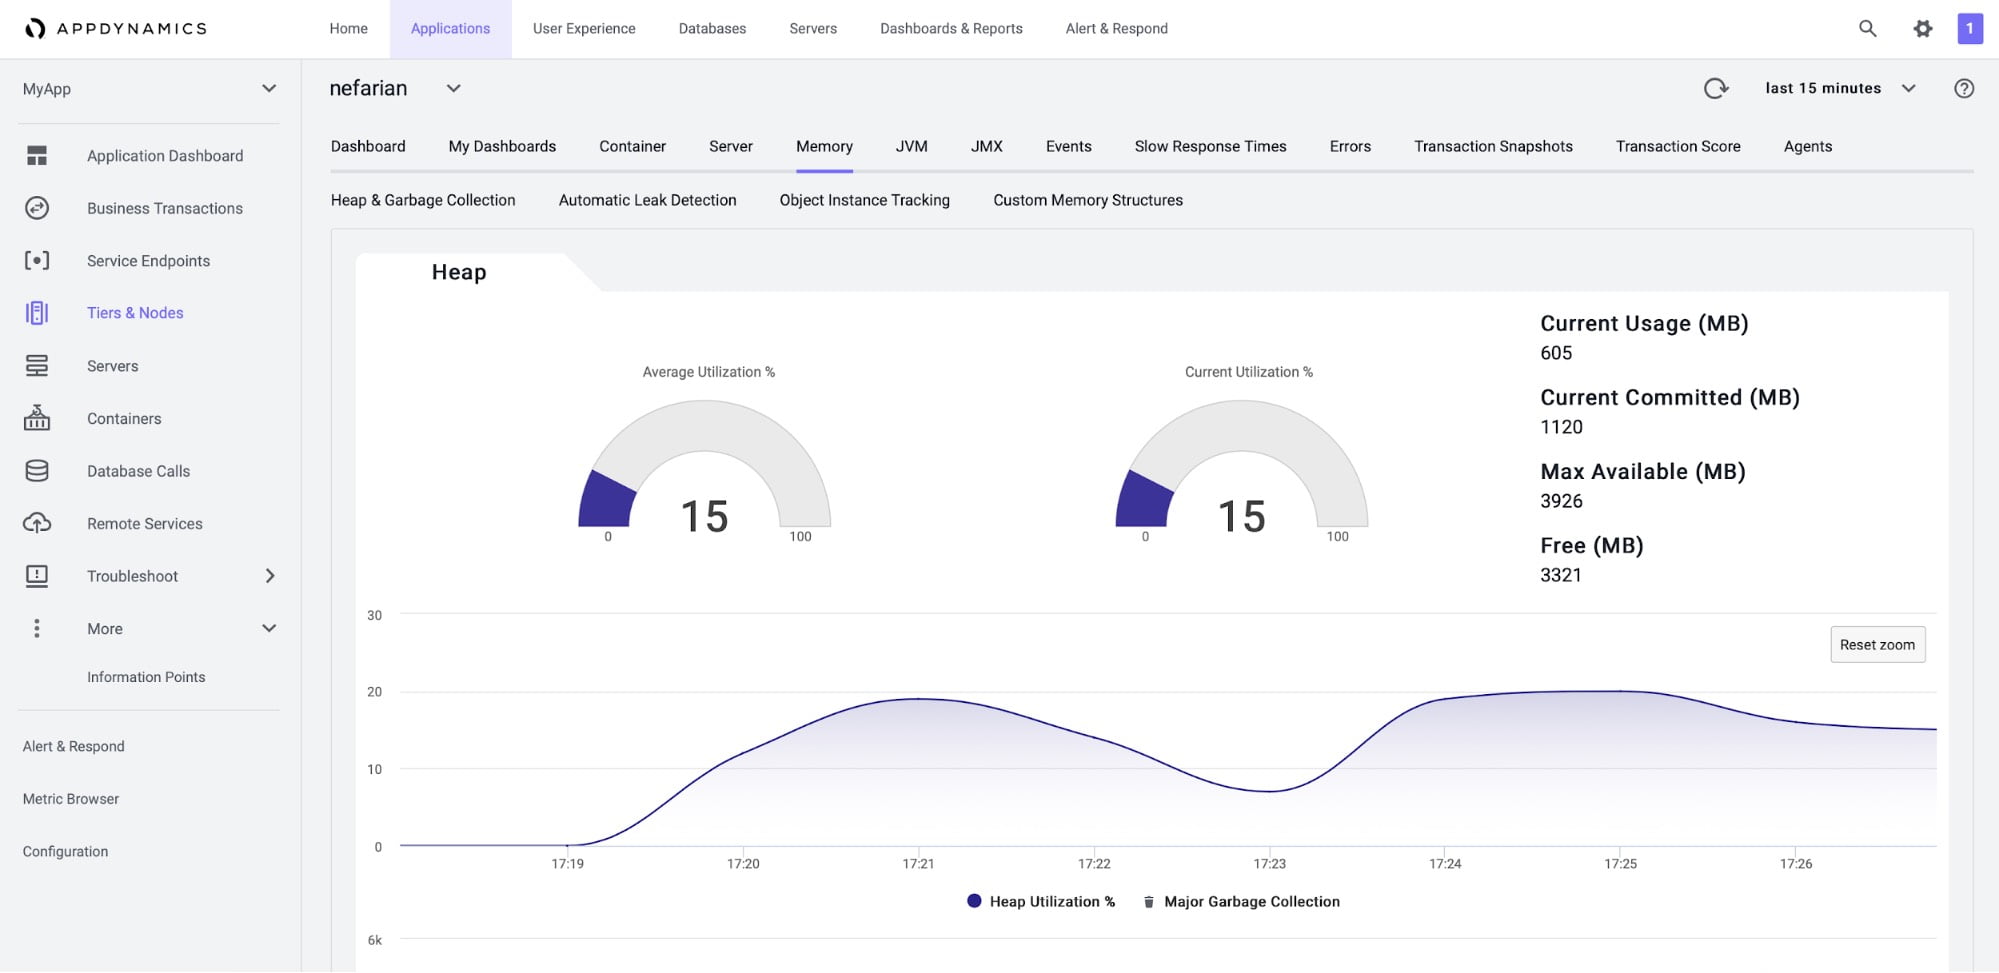
Available in both software as a service and an on-premise model, AppDynamics offers cloud-based network monitoring tools that allow you to evaluate the performance of the whole stack that runs your services. It’s more focused on large enterprises providing the ability to connect application performance metrics with infrastructure data, alerting, and business-level metrics. The platform gives you insights into your environment, from top-level transactions that are understood by the business executives to the code-level information useful for DevOps and developers.
Features:
- End-user monitoring with mobile and browser real user, synthetic, and internet of things monitoring.
- Infrastructure monitoring with network components, databases, and servers visibility providing information about status, utilization, and flow between each element.
- Business-focused dashboards and features provide visualizations and analysis of the connections between performance and business-oriented metrics.
- Machine Learning supported anomaly detection and root cause analysis features.
- Alerting with email templating and period digest capabilities.
Pros:
- Very detailed information about the environment including versions, for example, JVM application startup parameters, JVM version, etc.
- Provides advanced features for various languages – for example, automatic leak detection and object instance tracking for the JVM based stack.
- Visibility into connections between the system components, environment elements, endpoint response times, and business transactions.
- Visibility into server and application metrics with up to code-level visibility and automated diagnostics.
Cons:
- Pricing: very expensive, complex, and non-transparent. Focused on more traditional high-touch sales models and selling to large enterprises.
- Installation of the agent requires manual downloading and starting of the agent – no one-line installation and setup command.
- Some of the basic metrics like system CPU, memory, and network utilization are not available in the lowest, paid plan tier.
- Slicing and dicing through the data is not as easy compared to some of the other tools mentioned in this summary that support rich dashboarding capabilities like Sematext, Datadog, or New Relic.
Pricing:
Agent and feature-based pricing is used which makes the pricing not transparent. The amount of money you will pay for the solution depends on the language your applications are written in and what functionalities you need and want to use from the platform. For example, visibility into the CPU, memory, and disk metrics requires the APM Advanced plan.
Want to see how Sematext stacks up? Check out our page on Sematext vs AppDynamics.
3. Datadog
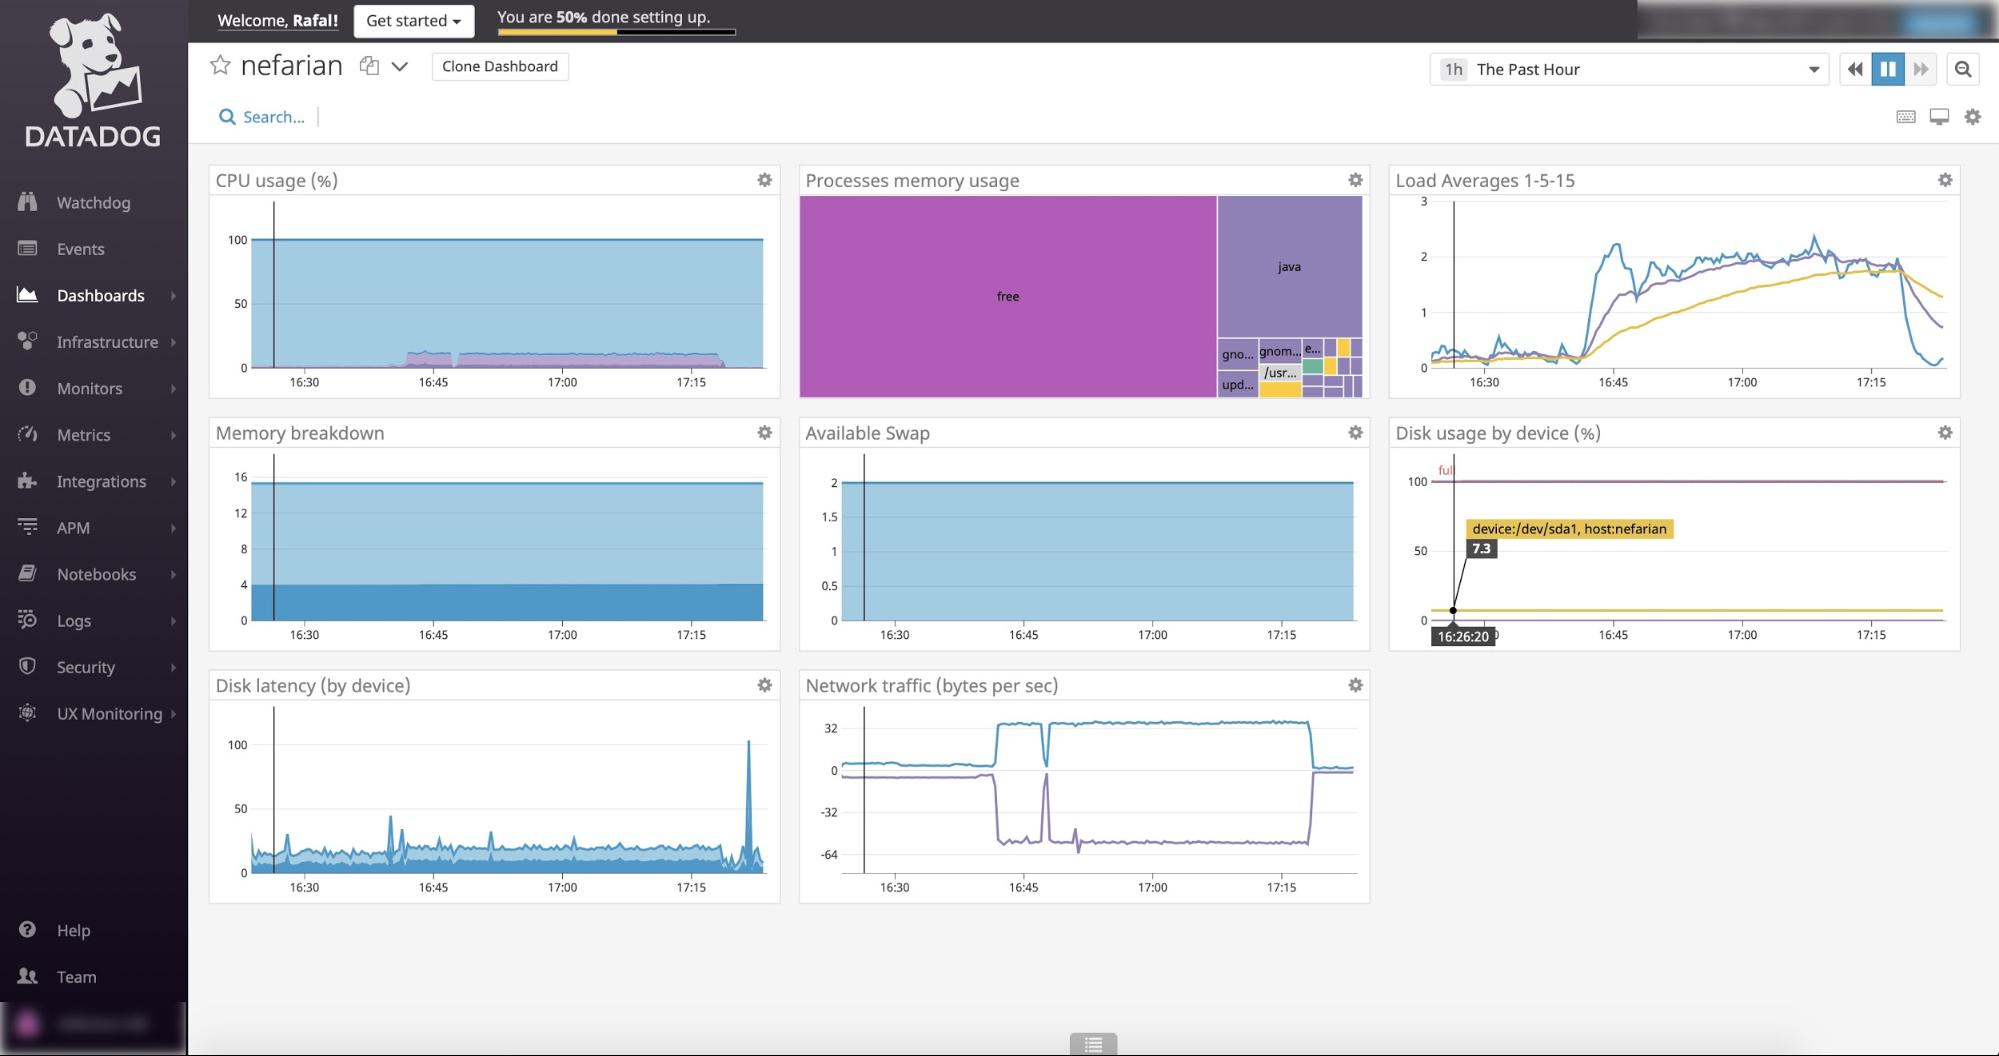
Datadog is a Saas monitoring solution providing an extended set of features needed to monitor your cloud infrastructure, applications, containers, network, logs, or even serverless features such as AWS lambdas. With the flexibility and functionality comes a price though – the configuration based agent installation may be time-consuming to set up (e.g. process monitoring requires agent config editing and agent restart) and quite some time may pass before you start seeing all the metrics, logs, and traces in one place for that full visibility into your application stack that you are after.
Features:
- Cloud application performance monitoring with a large number of integrations available and distributed tracing support.
- Logs centralization and analysis.
- Real user and synthetics monitoring.
- Network and host monitoring.
- Dashboard framework allows building of virtually everything out of the provided metrics and logs and sharing those.
- Alerting with machine learning capabilities.
- Collaboration tools for team-based discussions.
- API allowing to work with the data, tags, and dashboards.
Pros:
- Full observability solution – metric, logs, security, real user, and synthetics all in one.
- Infrastructure monitoring including hosts, containers, processes, networks, and serverless capabilities.
- Rich logs integration including applications, containers, cloud providers, clients, and common log shippers.
- Powerful and very flexible data analysis features with alerts and custom dashboards.
- Provides API allowing interaction with the data.
Cons:
- Overwhelming for newcomers with all the installation steps needed for anything beyond basic metrics.
- Not a lot of pre-built dashboards compared to others. New users have to invest quite a bit of time to understand metrics and build dashboards before being able to make full use of the solution.
Pricing:
Feature, host, and volume-based pricing combined together – each part of the solution is priced differently that can be billed annually or on-demand. The on-demand billing makes the solution about 17 – 20% more expensive than the annual pricing at the time of this writing.
Pay close attention to your bill. We’ve seen a number of reports where people were surprised by bill items or amounts.
Want to see how Sematext stacks up? Check out our page on Sematext vs Datadog.
4. New Relic
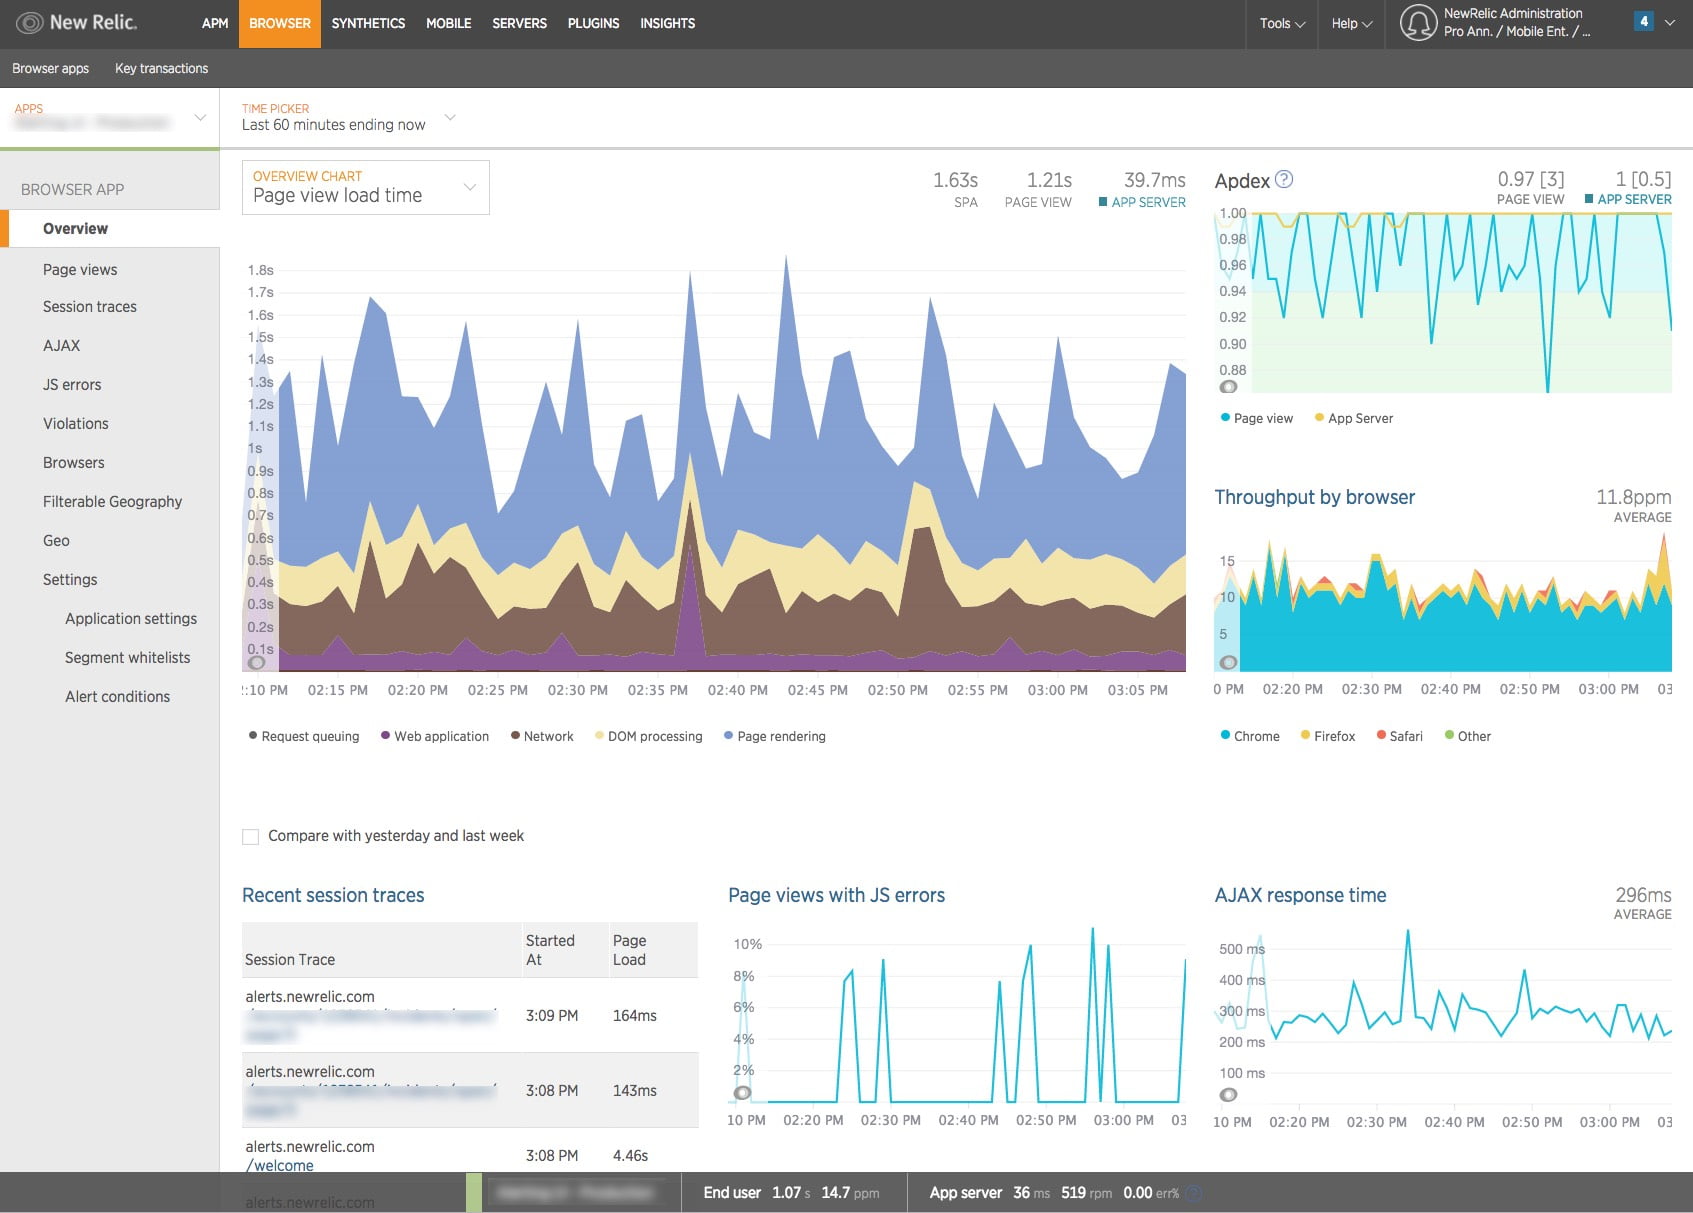
New Relic is a cloud monitoring solution available in software as a service model. Its monitoring capabilities include mobile, web, and server-based application performance monitoring with rich dashboarding support, distributed tracing support, logs along with real user and synthetics monitoring for the top to bottom visibility. Even though the system’s agents require manual steps to download and install they are robust and reliable with a wide range of common programming languages support which is a big advantage.
Features:
- Application Performance Monitoring with dashboarding and support for commonly used languages including C++.
- Log centralization and analysis.
- Integrated alerting with anomaly detection.
- Rich and powerful query language – NRQL.
- Real user and synthetics monitoring.
- Distributed tracing allowing you to understand what is happening from top to bottom.
- Integration with most known cloud providers such as AWS, Azure, and Google Cloud Platform.
- Business level metrics support.
Pros:
- Visibility into the whole system, not only when using physical servers or virtual machines, but also when dealing with containers and microservices.
- Ability to connect business-level metrics together with performance to correlate them together.
- Error analytics tool for quick and efficient issues analysis, like site errors or downtime.
- Rich visualization support allowing to graph metrics, logs, and NRQL queries.
- Ability to define the correlation between alerts and defined logic to reduce alert noise.
Cons:
- The platform itself doesn’t provide agent management functionality, which leads to additional work related to installation and configuration, especially on a larger scale.
- Inconsistent UI: some parts of the product use the legacy interface, while others are already a part of NewRelic One.
- The log management part of the solution is still young.
- Lack of a single pricing page for all features.
Pricing:
Annual and monthly compute unit or host-based pricing and depends on the features. For small services, the computing units may be the best option as they are calculated as the total number of CPUs with the amount of RAM your system has, multiplied by the number of running hours. For example, the infrastructure part of New Relic uses only compute units pricing, while the APM can be charged on both host and compute units-based pricing. This may be confusing and requires additional calculations if you want to control your costs.
Want to see how Sematext stacks up? Check out our page on Sematext vs New Relic.
5. Dynatrace
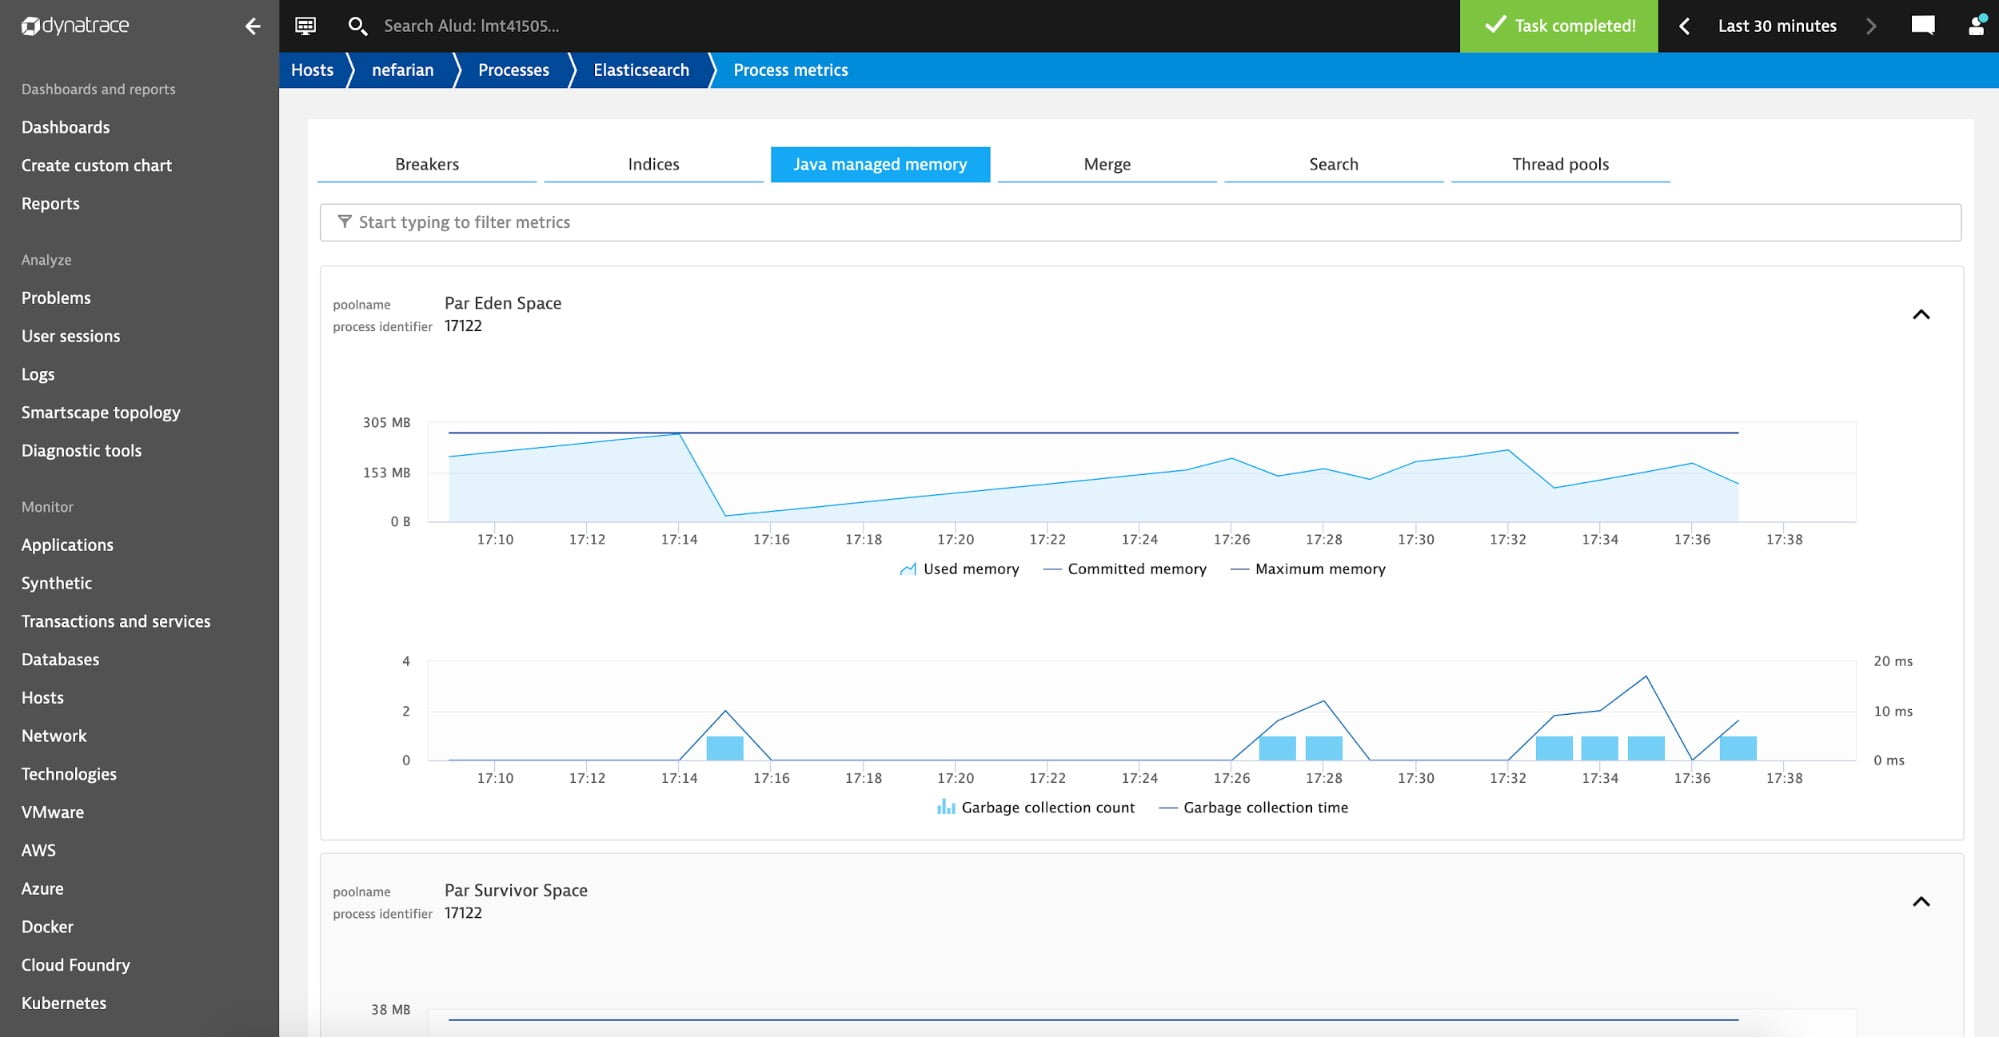
Dynatrace is a full-stack observability solution that introduces a user-friendly approach to monitor your cloud applications, infrastructure, and logs. It supports a single running agent that, once installed, can be controlled via Dynatrace UI making monitoring easy and pleasant to work with. Available in both software as a service and on-premise models it will fulfill most of your monitoring needs when it comes to application performance monitoring, real users, logs, and infrastructure.
Features:
- Cloud application performance monitoring with dashboarding and rich integrations for commonly used tools and code-level tracing.
- First-class Log analysis support with automatic detection of the common system and application log types.
- Real user and synthetic monitoring.
- Diagnostic tools allow taking memory dumps, exceptions and CPU analysis, top database, and web requests.
- Docker, Kubernetes, and OpenShift integrations.
- Support for common cloud providers like Amazon Web Services, Microsoft Azure, and Google Cloud Platform.
- A virtual assistant can make your life easier when dealing with common questions.
Pros:
- Simple and intuitive agent installation with UI guidance for new users with demo data to get to know the product faster.
- A rich integration library enables you to monitor the logs of your cloud systems and applications – almost everything is doable from the UI.
- Easy to navigate and powerful top to bottom view of the whole stack – from the mobile/web application through the middle tier up to the database level.
- Dedicated problem-solving functionalities to help in quick and efficient problem finding.
Cons:
- Lots of options can be overwhelming to start with, but the solution tries to do its best to help new users.
- Business metrics analysis is still limited compared to AppDynamics and Datadog, for example.
- Serverless offering is limited when compared to other solutions on the market, like Datadog, New Relic, and AppDynamics.
- Pricing information is only available once you sign up.
Pricing:
Pricing is organized around features. The application performance monitoring pricing is tied to hosts and the amount of memory available on a host. Each 16GB is a host unit and the price is calculated on the basis of the number of host units in an hour. The real user monitoring price is calculated based on the number of sessions, while the synthetics monitoring pricing is based on the number of actions. Finally, the logs part of the solution is calculated based on the volume, similar to other vendors covered in this article.
Want to see how Sematext stacks up? Check out our page on Sematext vs Dynatrace. There are more alternatives to Dynatrace. Read our comparison before committing.
6. Sumo Logic
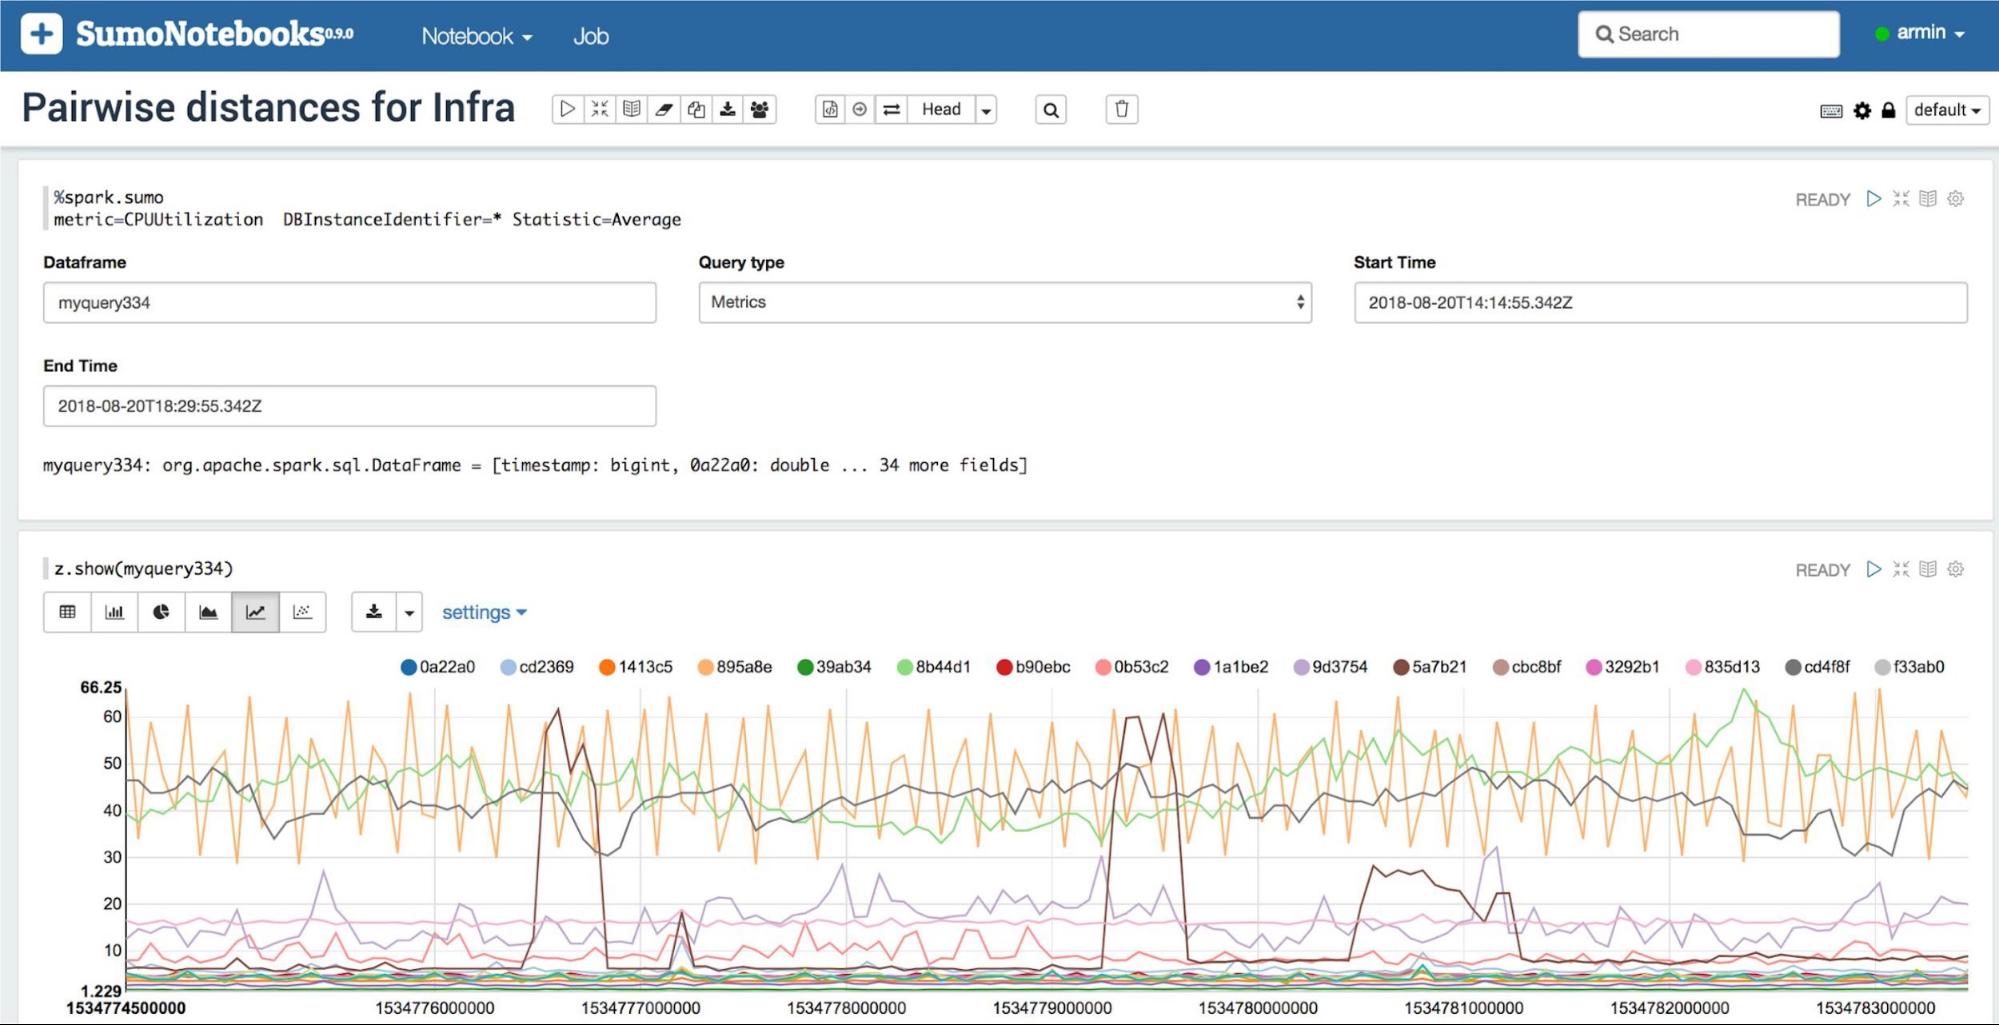
Sumo Logic is a cloud monitoring software with a strong focus on working with logs and it does that very well. With tools like LogReduce and LogCompare you can not only view the logs from a given time period but also reduce the volume of data you need to analyze or even compare periods to find interesting discrepancies and anomalies. Combining that with metrics and security gives a great tool to monitor your environment.
Features:
- Log analysis with the LogReduce algorithm allows clustering of similar messages and LogCompare lets you compare data from two time periods.
- Field extraction enables rule-based data extraction from unstructured data.
- Application performance monitoring with real-time alerting and dashboarding.
- Scheduled views for running your queries periodically.
- Cloud security features for common cloud providers and SaaS solutions with PCI compliance and integrated threat intelligence.
Pros:
- User-friendly interface that doesn’t overwhelm novice users and is still usable for experienced ones.
- Ability to reduce the number of similar logs at read-time and compare periods of time together which can help to spot differences, anomalies, and track down problems quickly.
- Possibility to extract fields from unstructured data allows you to drop the processing component from your local pipeline and move it to the vendor side.
- Limited free tier available that may be enough for very small companies.
Cons:
- Pricing may be confusing and may be hard to pre-calculate when using Cloud Flex credits and larger environments.
- A limited number of out of the box charts compared to the competition.
- Primarily focused on logs puts them at a disadvantage if you are looking for a full-stack observability solution.
Pricing:
Credit and feature-based pricing with a limited free tier is available. A credit is a unit of utilization for ingested data – logs and metrics. The needed features dictate the price of each credit unit – the more features of the platform you need and will use, the more expensive the credit will be. Please keep in mind that the price also depends on the location you want to use. For example, at the time of this writing, the Ireland location was more expensive compared to North America.
7. CA Unified Infrastructure Monitoring (UIM)
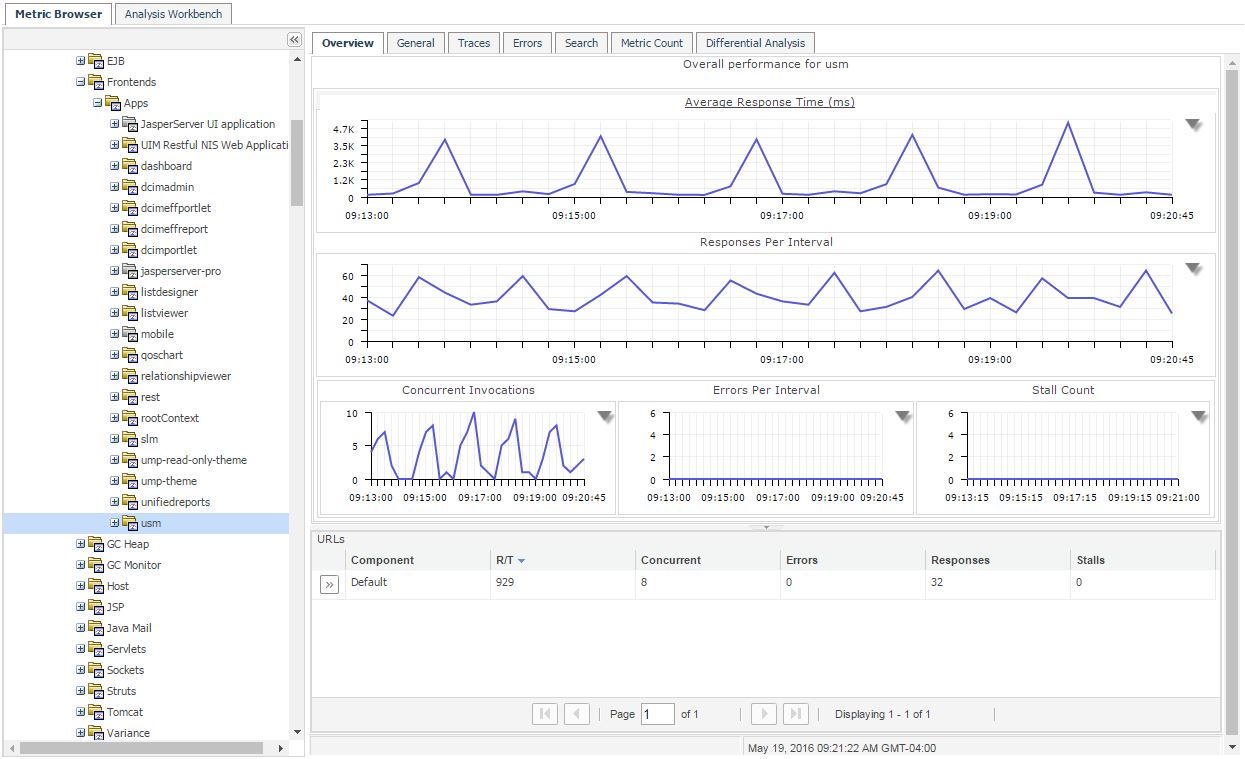
Available in both the SaaS and on-premise models, targeted at the enterprise customers, the DX Infrastructure Manager, formerly called CA Unified Infrastructure Monitoring, is a unified tool that allows you to monitor the performance of your hybrid cloud, services, applications, and infrastructural elements like switches, routers and storage devices. With the actionable log analytics, out of the box dashboard, and alerting with anomaly detection algorithms the solution will give you retrospective and proactive views over your IT environment.
Features:
- Monitoring with various integrations supporting common infrastructure providers and services including packaged applications such as Office 365 and tools like Salesforce Service Cloud.
- Log analytics with actionable, out of the box dashboards and rich visualization support.
- Alerting with anomaly detection and dynamic thresholds.
- Reporting with business-level metrics support and scheduling capabilities.
Pros:
- Easy deployment and configuration with configurable automatic service discovery.
- Templates support which allows you to build templates per environment, devices, and more.
- Advanced correlations for hybrid infrastructures.
- In-depth monitoring of the whole cloud infrastructure with the help of various integrations.
Cons:
- Non-transparent pricing — the pricing is not available on the web site.
- A limited number of alert notification destinations compared to other competitors.
- May be considered complicated for novice users.
- Targeted for enterprise customers.
- Dated UI.
Pricing:
At the time of this writing, the pricing was not publicly available on the vendor’s site.
8. Site24×7
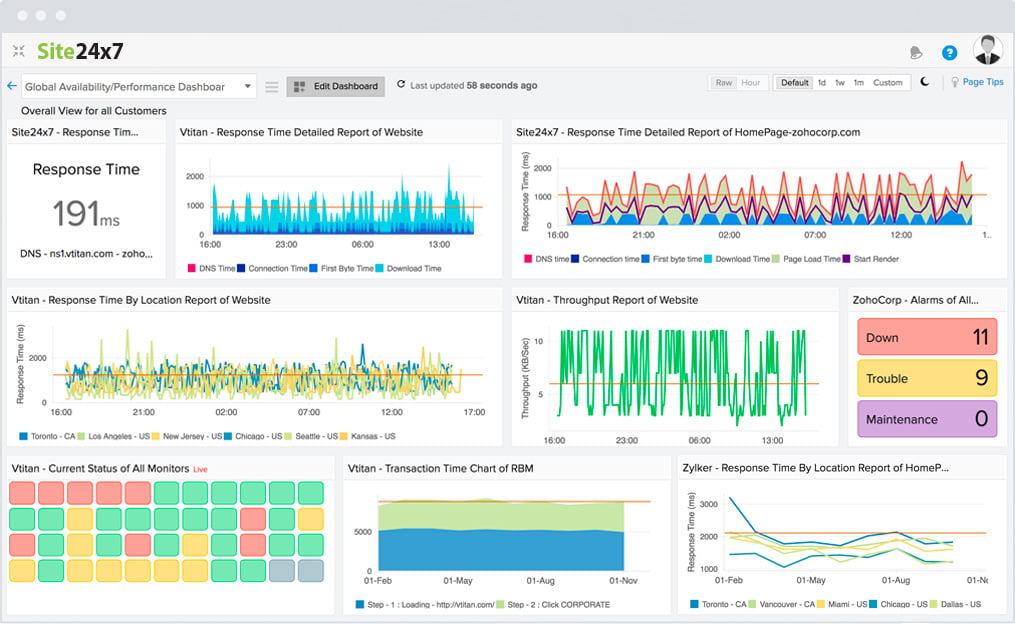
Site24×7 is a cloud monitoring service providing all that is needed to get full visibility into your website’s health, application performance, infrastructure, and network gear. Both when it comes to metrics and logs. Set up alerts based on advanced rules to limit down the alerts fatigue and get insights from your mobile applications. Monitor servers and over 50 common technologies running inside your cloud-based environment including common and widely used Apache or MySQL.
Features:
- Website monitoring with the support for monitoring HTTP services, DNS and FTP servers, SMTP and POP servers, URLs, and REST APIs available both publicly and in private networks.
- Server monitoring with support for Microsoft Windows and Linux and over 50 common technology plugins, like MySQL or Apache.
- Full features network monitoring with routers, switches, firewalls, load balancers, UPS, and storage support.
- Application performance monitoring and log management with support for server, desktop, and mobile applications and alerting capabilities.
- Cloud monitoring with support for hybrid cloud infrastructure.
Pros:
- Quick and easy agent installation.
- Monitoring for various technologies with alerting support based on complex rules.
- Full observability with visibility from your website performance and health up to network-level devices like switches and routers.
- Custom dashboarding support lets you build your own views into the servers, applications, websites, servers, and cloud environments.
- Pluggable server monitoring allows you to write your own plugins where needed.
- Free, limited uptime and server monitoring which might be enough for personal needs or small companies.
Cons:
- The number of features can be overwhelming for novice users.
- It can be time-consuming when setting up in a larger environment because of the lack of autodiscovery.
- A limited number of technologies when it comes to server monitoring.
Pricing:
The pricing depends on the parts of the product that you will use with the free uptime monitoring for a small number of websites and servers available. The infrastructure monitoring starts with the 9 euro per month when billed annually for up to 10 servers, 500MB of logs, and 100K page views for a single site. You can buy additional add-ons for a monthly fee. You can also go for pure website monitoring or application performance monitoring or so-called “All-in-one” plan, which covers all the features of the platform.
Want to see how Sematext stacks up? Check out our page on Sematext vs Site24x7.
9. Zabbix
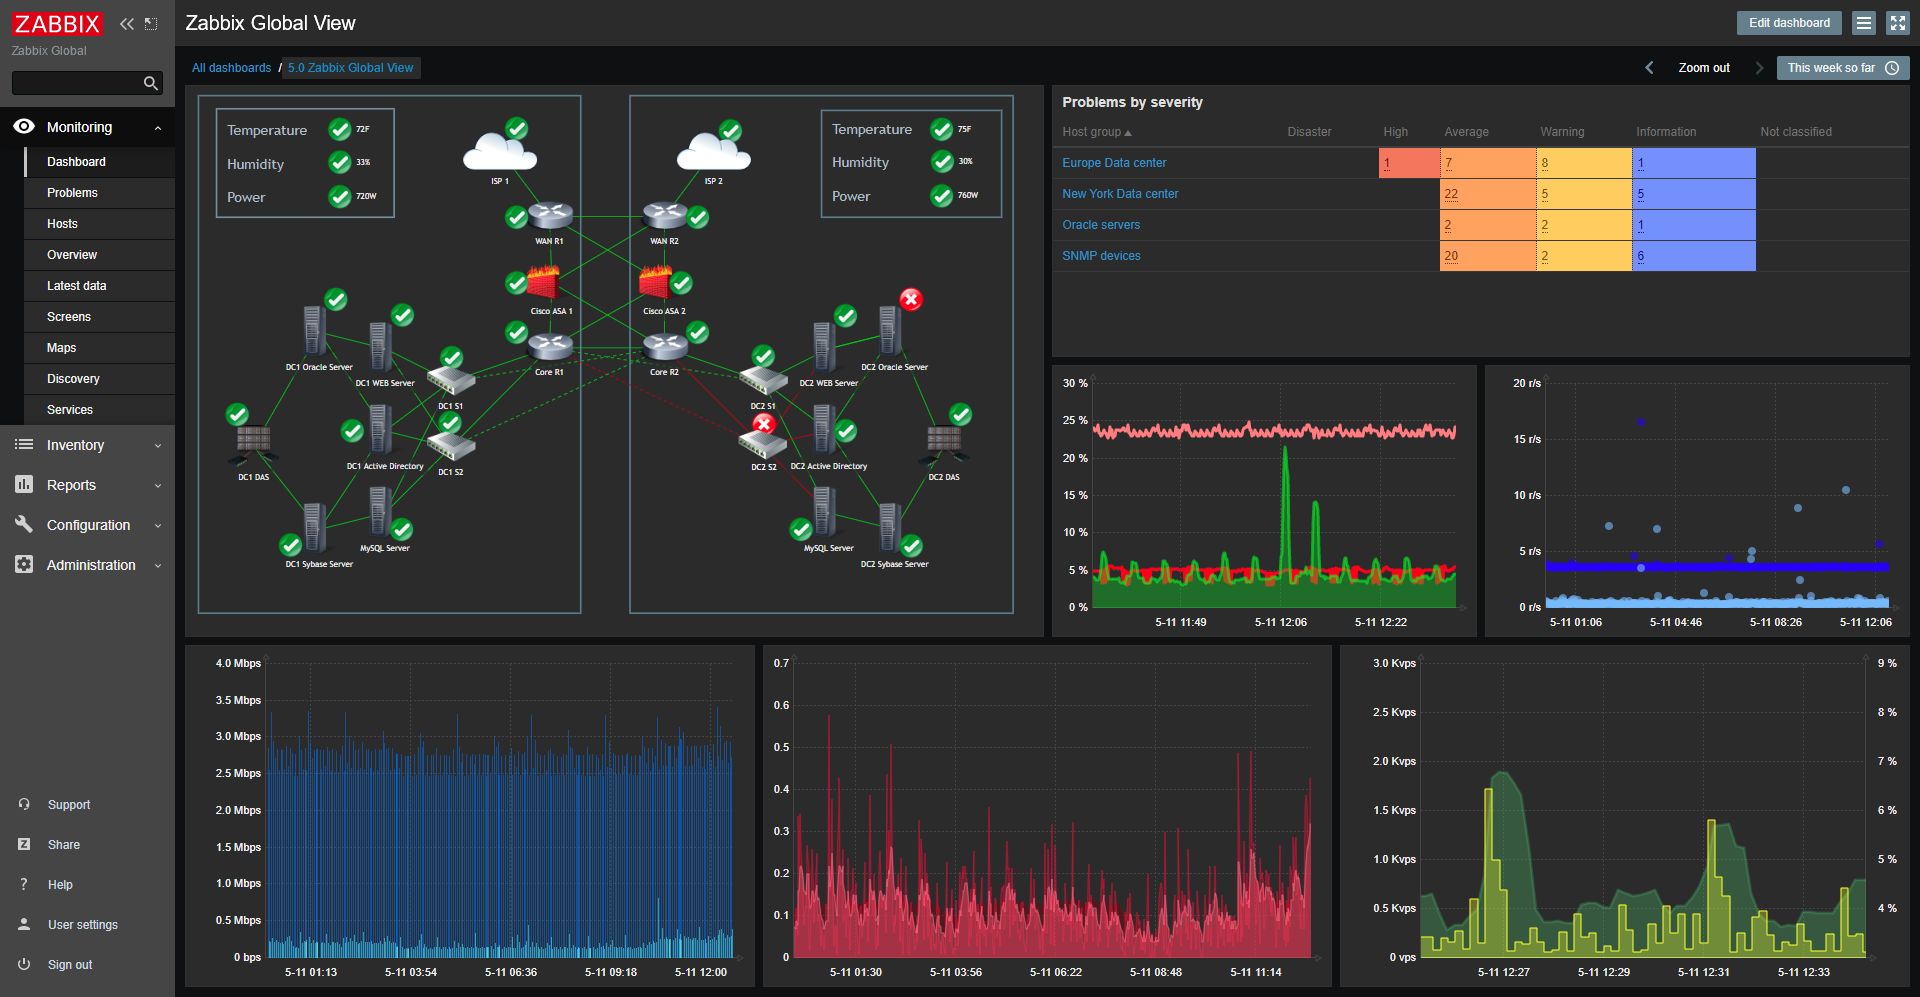
Zabbix is a free and open-sourced monitoring tool capable of real-time monitoring large-scale enterprises and small companies. Its multi-system, small footprint agents allow you to gather key performance indicators from servers, virtual machines, network or IoT devices, and other resources, and use them as a source for your dashboards and alerts. With the template-based setup and auto-discovery, you can speed up even the largest setups.
Features:
- Multi-system, small footprint agent allowing to gather crucial metrics with support for SNMP and IPMI.
- Problem detection and prediction mechanism with flexible thresholds and severity levels defining their importance.
- Multi-lingual, multi-tenant, flexible UI with dashboarding capabilities and geolocation support for large organizations with data centers spread around the world.
- Support for adjustable notifications with out-of-the-box support for email, SMS, Slack, Hipchat, and XMPP and escalation workflow.
- Template-based host management and auto-discovery for monitoring large environments.
Pros:
- Well-known, open-sourced, and free with a large community and commercial support.
- Wide functionality allowing to monitor virtually everything.
- It can be easily integrated with other visualization tools like Grafana.
- Easily extensible for support for technologies and infrastructure elements not covered out of the box.
Cons:
- As an open-sourced and completely free cloud monitoring solution, you need to host it yourself and maintain it, meaning paying for the team that will install and manage it.
- Initial setup can be tedious and not so obvious and requires knowledge, not only about the platform but also about the applications, servers, and infrastructure elements that you plan on monitoring making the initial step quite steep.
- Lack of dedicated functionality to monitor user experience, synthetic monitoring, and no transaction tracing support.
- If you are looking for a software as a service solution, Zabbix Cloud is coming, but as of this writing, it is still in beta.
Pricing:
Zabbix is open-sourced and free. You can subscribe for support, consultancy, and training around it though if you would like to quickly and efficiently extend your knowledge about the platform.
10. Stackify Retrace
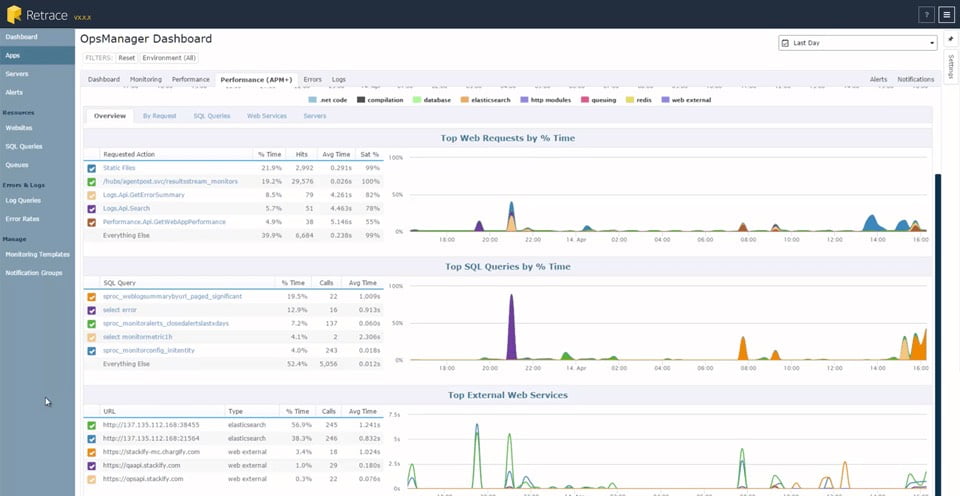
Stackify Retrace is a developer-centric solution providing users full visibility into their cloud applications and infrastructure elements. With the availability of application performance monitoring, centralized logging, error reporting, and transaction tracing it is easy for a developer to connect pieces of information together when troubleshooting. All of that with help from the platform which connects those pieces together gluing the automated transaction tracing with the relevant logs and error data and proving the integrated profiler to give the top to bottom insight into the business transaction.
Features:
- Centralized logging combined with error reporting.
- Transaction tracing and code profiling with automatic instrumentation for databases like MySQL, PostgreSQL, Oracle, SQL Server, and common NoSQL solutions like MongoDB and Elasticsearch.
- Key performance metrics monitoring for your cloud applications with alerting and notifications support.
- Server monitoring gives you insight into the most useful metrics like uptime, CPU & memory utilization, disk space usage, and more.
Pros:
- Top to bottom view starting with the web requests and ending at the relevant log message connected together with the transaction trace.
- Integrated profiler with out of the box instrumentation for common system elements like database or NoSQL store.
- In-line log and error data inclusion in tracing information makes it super easy to connect information together for fast troubleshooting.
- Support for custom dashboards and reports.
Cons:
- No native support for Google Cloud at the time of writing.
- Real user monitoring “coming soon” at the time of writing.
- UI reminiscent of Windows.
Pricing:
The pricing is based on data volume and is provided in three tiers – Essentials, Standard, and Enterprise. The Essentials package starts at $79/month allowing for 7 days of logs and traces retention, with up to 500k traces and 2m logs and up to 8 days of summary data retention with all the standard features provided. The Standard plan starts from $199 with additional features available for an appropriate higher price..
11. Zenoss
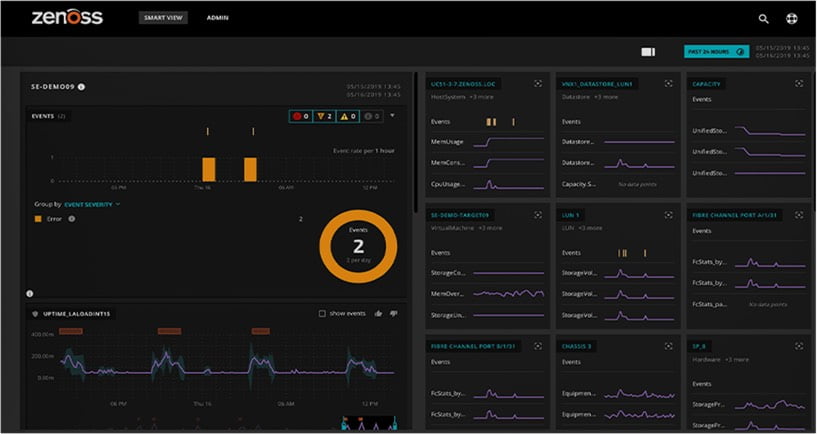
Zenoss provides cloud monitoring tools you can use for end-to-end monitoring, troubleshooting, and real-time dependency mapping. With support for server monitoring including coming metrics, health, and excellent network monitoring, the Zenoss platform gives you visibility into your infrastructure, no matter if it is a private, hybrid, or a public cloud.
Features:
- Infrastructure monitoring with the support for public, private, and hybrid clouds and real-time dependency mapping.
- Server monitoring with support for common metrics, health, physical sensors like temperature sensors, file systems, processes, network interfaces, and routes monitoring.
- Application performance monitoring available via ZenPacks with support for incident root cause analysis and metrics importance voting along with containers and microservices support.
- Support for logs with the support of log format unification.
Pros:
- Multi-vendor support for a wide variety of hardware and software infrastructure elements.
- Automatic discovery for dynamic environments like containers and microservices.
- Extensibility via ZenPacks – available both as driven by the community and commercial extensions with SDK allowing you to develop new extensions easier.
- The self-managed, limited community version of the platform available as a solution with basic functionality and minimum scale.
Cons:
- Application performance monitoring available via ZenPacks extension or integration with third-party services.
- Available only in the on-premise model with no free trial available which makes it hard to test the platform.
- No features like real user monitoring, synthetic monitoring or transaction tracing.
- Focused on medium and large customers.
Pricing:
At the time of writing the pricing was not publicly available on the vendor’s site, but one thing worth noting is the availability of the community version of the solution allowing you to install a limited, self-managed version of the platform.
12. BMC TrueSight Pulse
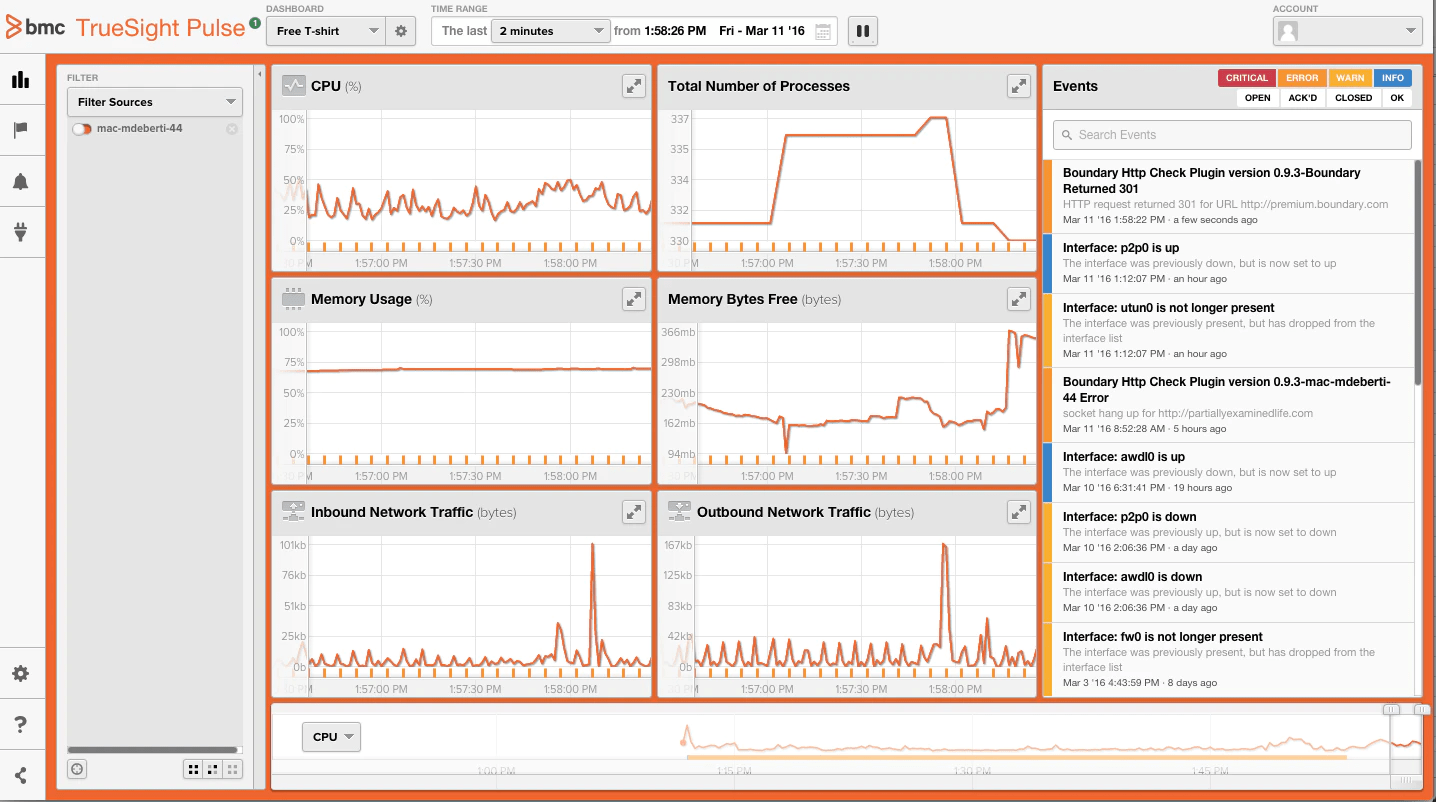
BMC TrueSight Pulse, formerly known as Boundary, is a SaaS-based solution for cloud and server architecture monitoring. BMC helps plan and run various cloud platforms, including AWS and Azure, allowing you to measure end user experience, track and optimize resource usage and costs.
Features:
- Supports for cloud, virtual machines and physical servers
- Powerful alerting on any metric with 3rd party notification hooks
- Sharable and customizable dashboarding
- Common application integration such as MongoDB, MySQL, Redis, HAProxy, Cassandra and Kafka
- Support for custom metrics shippable directly from your own code or via numerous plugins
Pros:
- Infra agnostic – various architectures support
- Easy setup with support for Chef and Puppet
- Low footprint plugins
Cons:
- Compared to other monitoring platforms – small number of supported applications
Pricing:
At the moment of writing, pricing was not publicly available. If you are interested in it, head over to BMC pricing request page.
13. Solarwinds
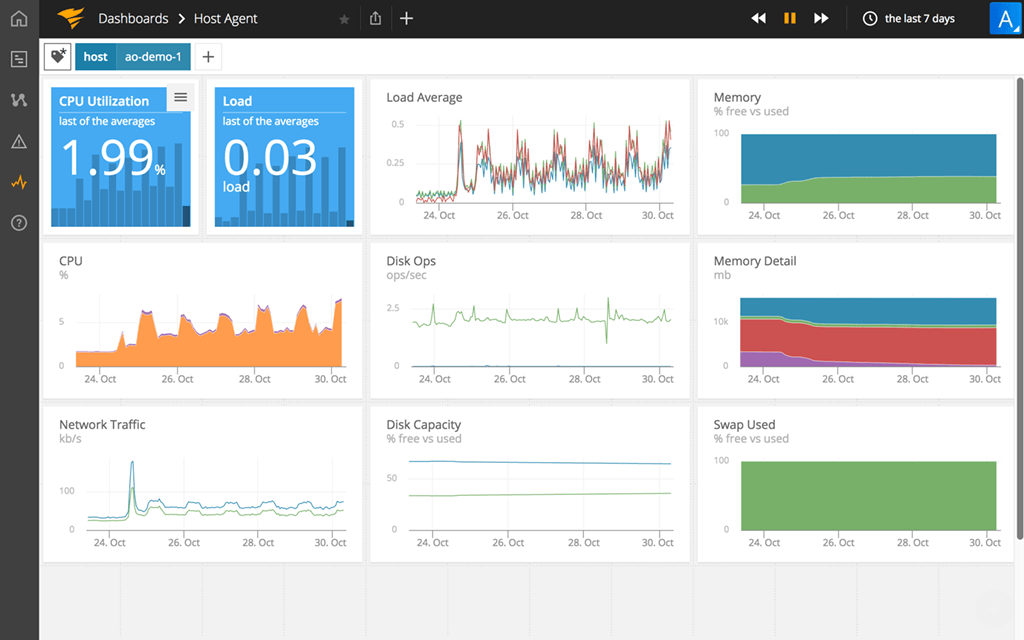
Solarwinds is a full-stack cloud performance monitoring platform available in the SasS model. You can also go for one of the application management products – you can monitor your infrastructure and applications with AppOptics, monitor your web applications and websites using Pingdom, aggregate and analyze your logs using Loggly and quickly look into your logs using Papertrail. In addition, the platform provides network management and monitoring, database monitoring with performance analysis, and more.
Features:
- Full view over the infrastructure and applications with distributed tracing, live code profiling, exception tracking and root cause summary.
- Out of the box support for motoring Azure and AWS cloud services.
- Infrastructure dependency mapping to see how your services interact with each other.
- Real user monitoring for understanding how your visitors experience your web site or web application.
- Synthetics monitoring for site, APIs, and transaction availability monitoring.
- Log aggregation with the ability to search and analyze the stored data.
- Support for various log sources allows shipping a number of different log structures.
Pros:
- Easy to use and start with.
- Powerful application performance monitoring with support for distributed tracing, custom metrics and root cause analysis.
- Help in reducing the mean time to repair and support for speed triage.
- Tail-like functionality for logs for quick and efficient logs streaming in a DevOps friendly way and support for logs encryption.
Cons:
- Multiple products available under the brand with some of the products having similar functionality, which can be misleading.
Pricing:
Depends on the needed functionality. For example, the infrastructure monitoring pricing starts at $9.99 per host per month, but can be only bought in packs of 10 hosts and 100 containers, while the infrastructure and application monitoring included together is $24.99 per host per month with the same package approach. When it comes to logs it depends on your needs, but it all comes down to the amount of data you send and the data retention. If you would like to go with Papertail the paid plan starts with $7 for 1GB/month with 1 week of search and 1 year of archive. Loggly log analytics platform starts with $79 a month billed annually with up to 3 users, 1GB/day and 15 days data retention.
When using Amazon Web Services, Google Cloud Platform, or Microsoft Azure you can rely on the tools provided by those platforms. The cloud provider dedicated solutions may not be as powerful as the platforms that we discussed above, but they offer insight into the metrics, logs, and infrastructure data. They give you not only visibility into the metrics but also proactive monitoring like alerts and health checks that you can use to configure the basic monitoring. If you are using a cloud service solution from Amazon, Microsoft, or Google and you would like to use monitoring provided by those companies have a look at what they offer.
When using Amazon Web Services, Google Cloud Platform, or Microsoft Azure you can rely on the tools provided by those platforms. The cloud provider dedicated solutions may not be as powerful as the platforms that we discussed above, but they provide insight into the metrics, logs, and infrastructure data. They give us not only visibility into the metrics but also proactive monitoring like alerts and health checks that you can use to configure the basic monitoring. If you are using a cloud solution from Amazon, Microsoft, or Google and you would like to use monitoring provided by those companies have a look at what they offer.
14. Amazon CloudWatch
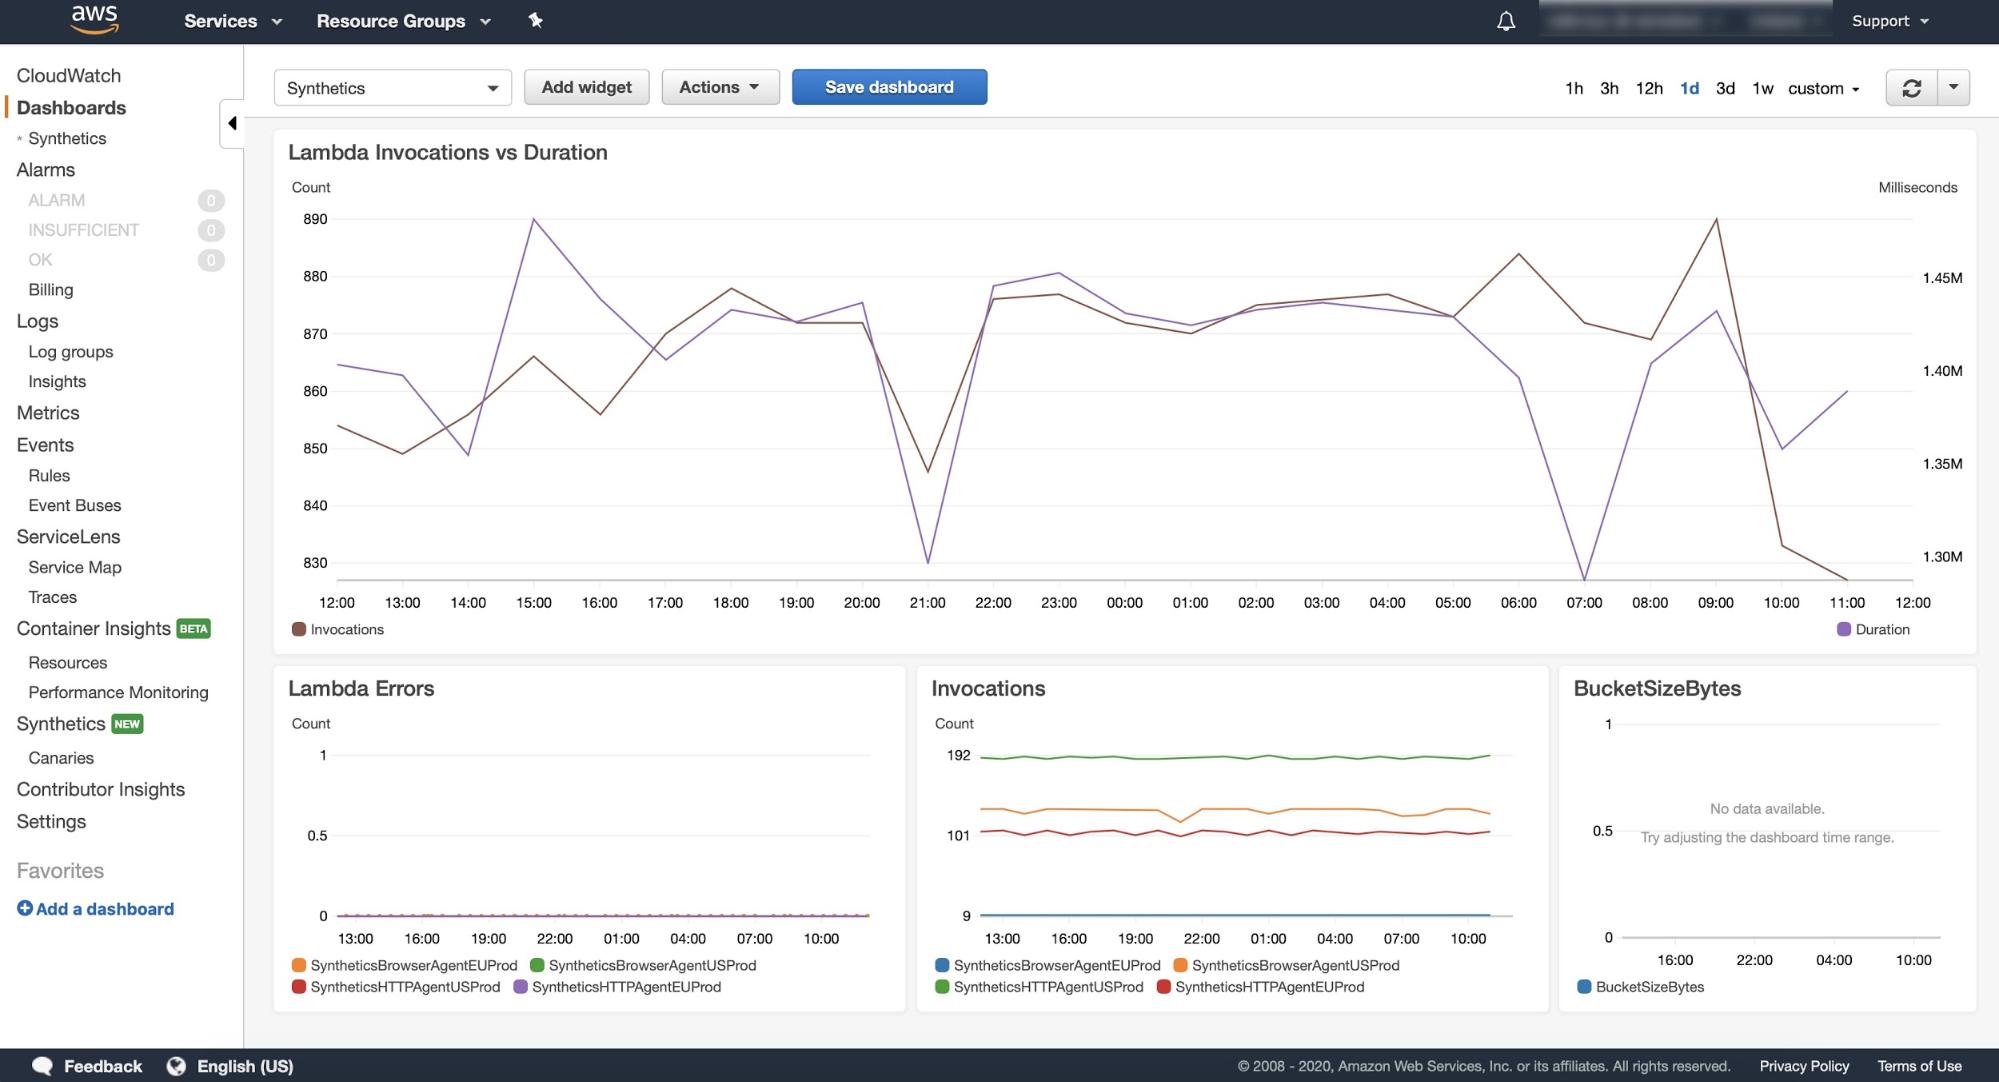
Amazon CloudWatch is primarily aimed at customers using Amazon Web Services, but can also read metrics from statsd and collectd providing a way to ship custom metrics to the platform. You can use it to monitor cloud resource usage, infrastructure, and services and applications running on Amazon AWS. With integrated log support and synthetics monitoring, it allows users to set up basic monitoring quickly to give insights into your system’s overall health and performance.
Features:
- View metrics and logs of your cloud infrastructure, services, and applications.
- Insights into events coming from your AWS environment.
- Service map and tracing support via AWS X-Ray.
- Synthetic service for web application monitoring.
- Alerting with anomaly detection on metrics and logs.
Pros:
- Available out of the box for Amazon Web Services Users.
- Support for custom metrics, so if you would like to stick to CloudWatch you can easily keep all your metrics there.
- Possibility to graph billing-related information and have that under control.
Cons:
- Limited dashboarding and visualization capabilities.
- A limited number of dashboards that can be created in the free tier – if you have more than three dashboards will cost you $3.00 per month.
- Limited metrics granularity even when going for the paid service.
Pricing:
Volume-based pricing – you pay for what you want to have visibility into and how detailed it is. Free tier enables monitoring of your AWS services with 5-minute metric granularity. The free tier is also effective for services like EBS volumes, RDS DB instances, and Elastic Load Balancers. It covers up to ten metrics and then alarms per month. In addition, the free tier includes up to 5GB logs per month, 3 dashboards, and 100 runs of synthetic monitors per month. The paid tier price is based on usage. For example, for metrics, the one-minute granularity metrics starts at $0.30 per metric per month for the first 10,000 metrics and go as low as $0.02 per metric per month when sending over one million metrics. With logs the situation is similar – the more you send the less you pay per gigabyte of data.
15. Azure Monitor
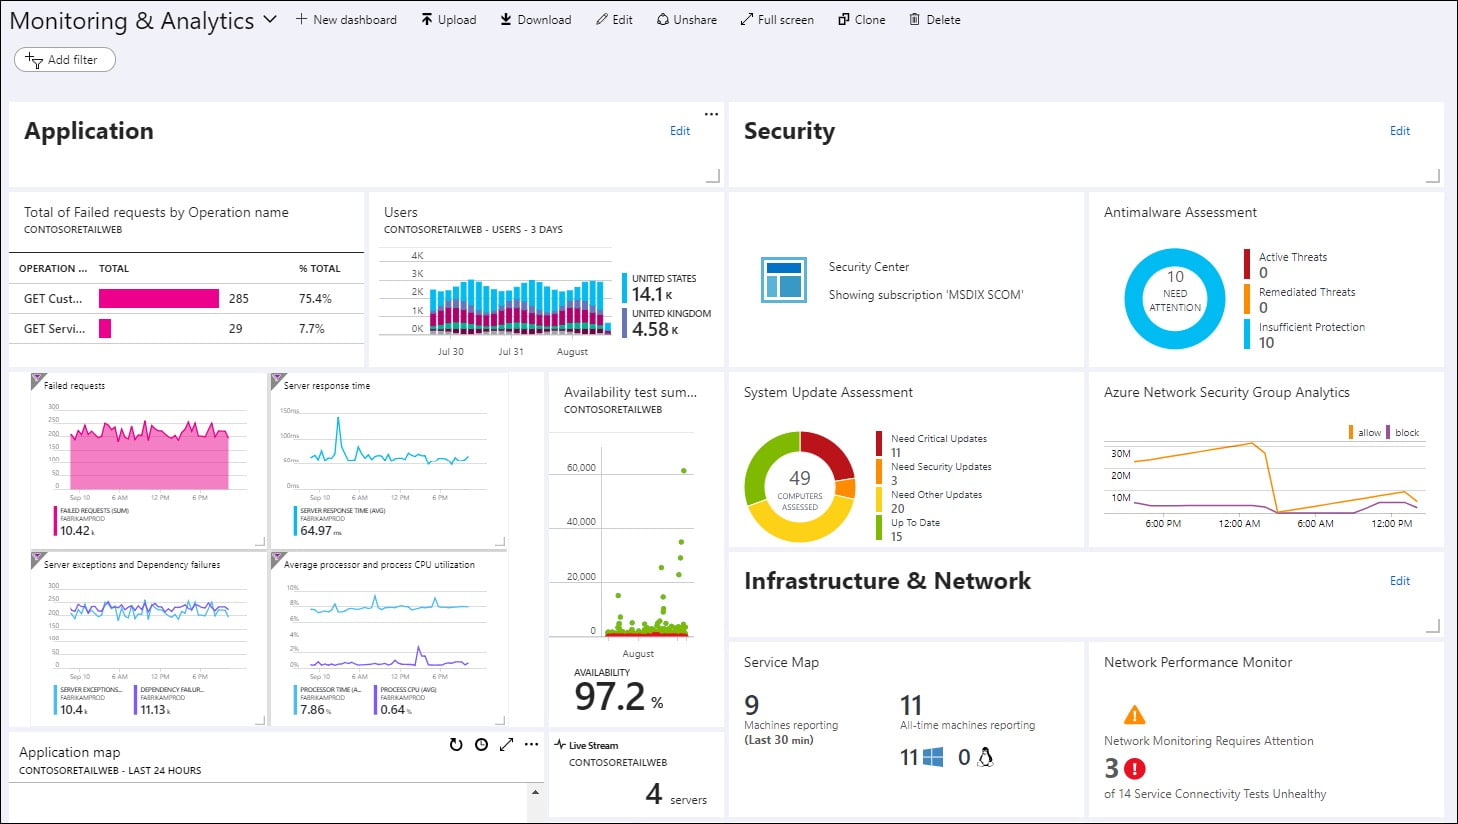
The Azure Monitor is a solution designed to monitor the services located in the Microsoft Azure cloud services, but it also supports custom metrics for resources outside of the cloud. It provides a full-featured observability solution giving you deep insights into your infrastructure, services, applications, and Azure resources with powerful dashboards, BI support, and alerting that will automatically notify you when needed.
Features:
- Monitoring for your Microsoft Azure resources, services, first-party solutions, and custom metrics sent by your applications.
- Detailed cloud infrastructure monitoring for deep insight into the metrics.
- Network activity, layout, and services layout visualization and monitoring.
- Support for alerts and autoscaling based on the metrics and logs.
- Powerful dashboarding capabilities with workbooks and BI support.
Pros:
- Available out of the box for Microsoft Azure users.
- Azure resources, services, and first-party solutions expose their metrics in the free tier and other signals like logs and alerts have a free tier available.
- Support for workbooks and BI allows to connect business-level metrics with the signals coming from the services and infrastructure.
Cons:
- It may be complicated and overwhelming for users that just started with Azure.
Pricing:
The Azure Monitor pricing is based on the volume of the ingested data or reserved capacity. Selected metrics from the Azure resources, services, and first-party solutions are free. Custom metrics are paid once you pass the 150MB per month. Similar to other cloud vendors you pay less per unit of data the more data you send. The logs have the option to pay as you go which gives you up to 5GB of logs per billing account per month free and then $2.76 per GB of data. You can also go for reserved data – for example, 100GB of data per day will cost you $219.52 daily. Other monitoring elements are priced in a similar way with small or no free tier available.
16. Google Operations (formerly Stackdriver)
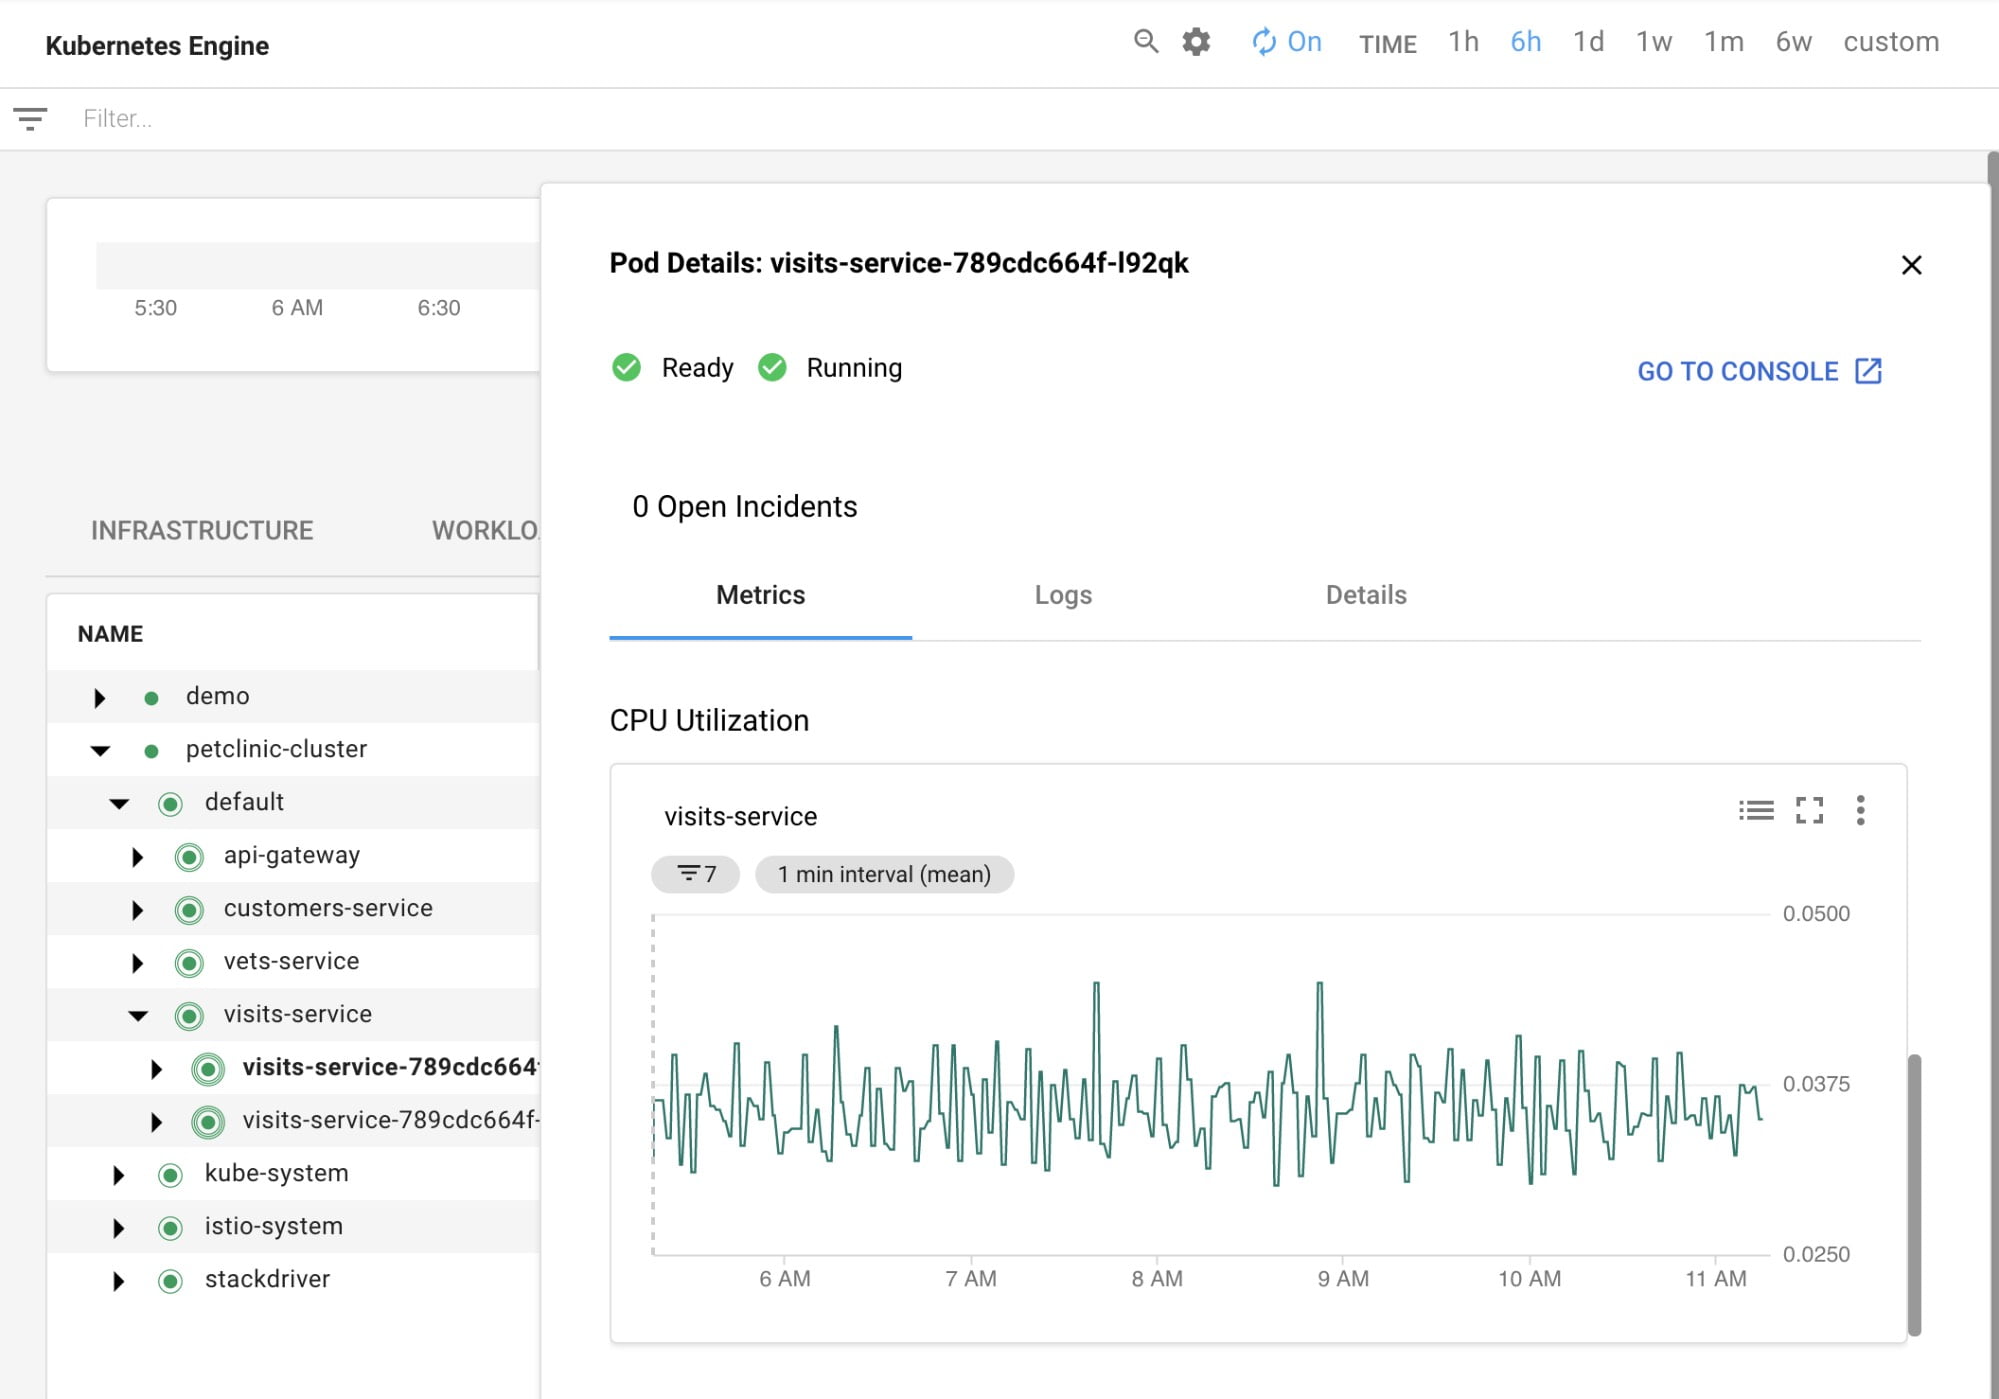
Formerly Stackdriver, Operations suite is designed to monitor Google Cloud Platform infrastructure resources usage and application performance, but it also supports custom metrics and monitoring of other cloud service providers like AWS. The platform provides metrics, logs, and trace support along with the visibility into Google Cloud platform audit logs giving you the full visibility of what is happening inside your GCP account.
Features:
- Metrics and dashboards allowing visibility into the performance of your services with alerting.
- Health check monitoring for web applications and applications that can be accessed from the internet with uptime monitoring.
- Support for logs and logs routing with error reporting and alerting.
- Per-URL statistics based on distributed tracing for App Engine.
- Audit logs for visibility into security-related events in your Google Cloud account.
- Production debugging and profiling.
Pros:
- Rich visualization support out of the box for Google Cloud platform users.
- Free tier available.
- Support for sending data to third-party providers if they provide an integration.
Cons:
- Requires a manual cloud monitoring agent install, before getting visibility into the metrics, compared to AWS CloudWatch where this is not needed.
Pricing:
Similar to Amazon CloudWatch and Microsoft Azure the pricing is based on the amount of data your services and applications are generating and sending to the platform. The free tier includes 150MB metrics per billing account, 50GB of logs per project, 1 million API calls per project, 2.5 million spans ingested per project and 25 million spans scanned per project. Everything above that falls into the paid tier.
Most of the tools that we’ve discussed provide a form of alerting and reporting. Those are usually limited to a number of methods, like e-mail or text messages to your mobile, sometimes other common destinations. Usually, we don’t see scheduling, automation, and workflow control in the monitoring tools themselves. Because of that, the observability solutions provide integrations with third-party incident alerting and reporting tools filling the communication gap and providing additional features like event automation and triage, noise suppression, alerts, and notifications centralization and lots of destinations where the information can be sent to. Let’s see what tools can provide such functionalities.
17. PagerDuty
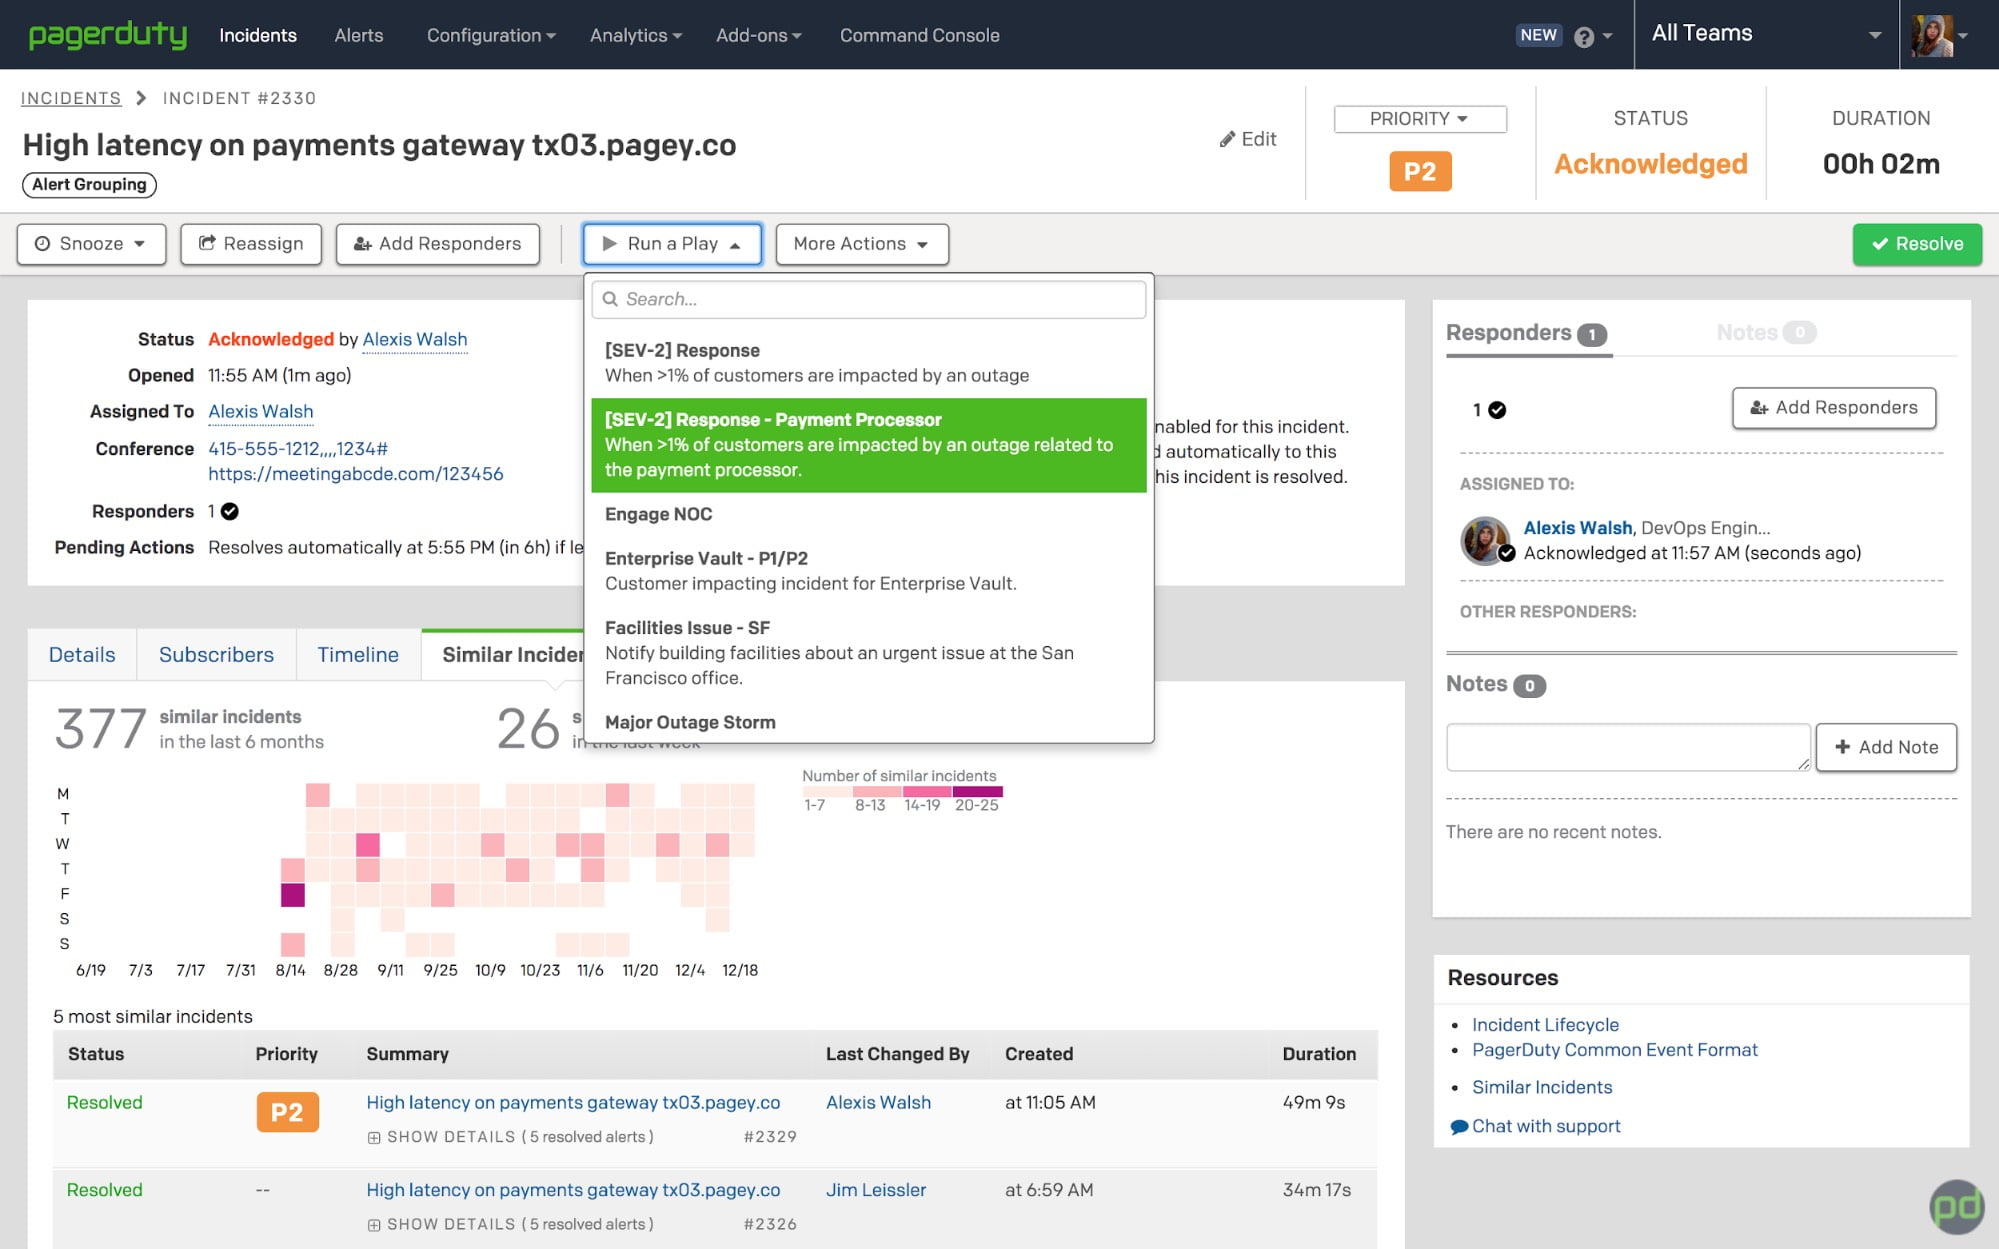
PgerDuty is all-in-one alert and notification management and centralization solution can help reduce incidents in your cloud system. It provides the place where you can centralize notifications coming from various places, organize them, assign, automate, and send to virtually any destination you may think of. It not only provides a simple way of viewing and forwarding the data but also automates incident response, schedule on-call, and escalate incidents.
Features:
- On-call management with flexible schedules, incident escalation, and alerting.
- Context filtering for alert reduction.
- Automated responses with status updates.
- Event automation with triage, alert grouping, and noise suppression.
- Dashboards for a variety of alert related information like operations, service health, responders, and incidents with customization capabilities.
Pros:
- A large number of integrations available out of the box, which gives you the possibility to receive notifications on virtually any destination.
- Scheduling and notifications escalation.
- Services prioritization for controlling what is more important.
Pricing:
The pricing is organized around the features and the number of users that will be using PagerDuty with no free tier available. The most basic plan starts from $10 for up to 6 users per month with an additional $15 per user after that and goes up to $47 per user per month depending on the features of the platform you want to use.
18. VictorOps
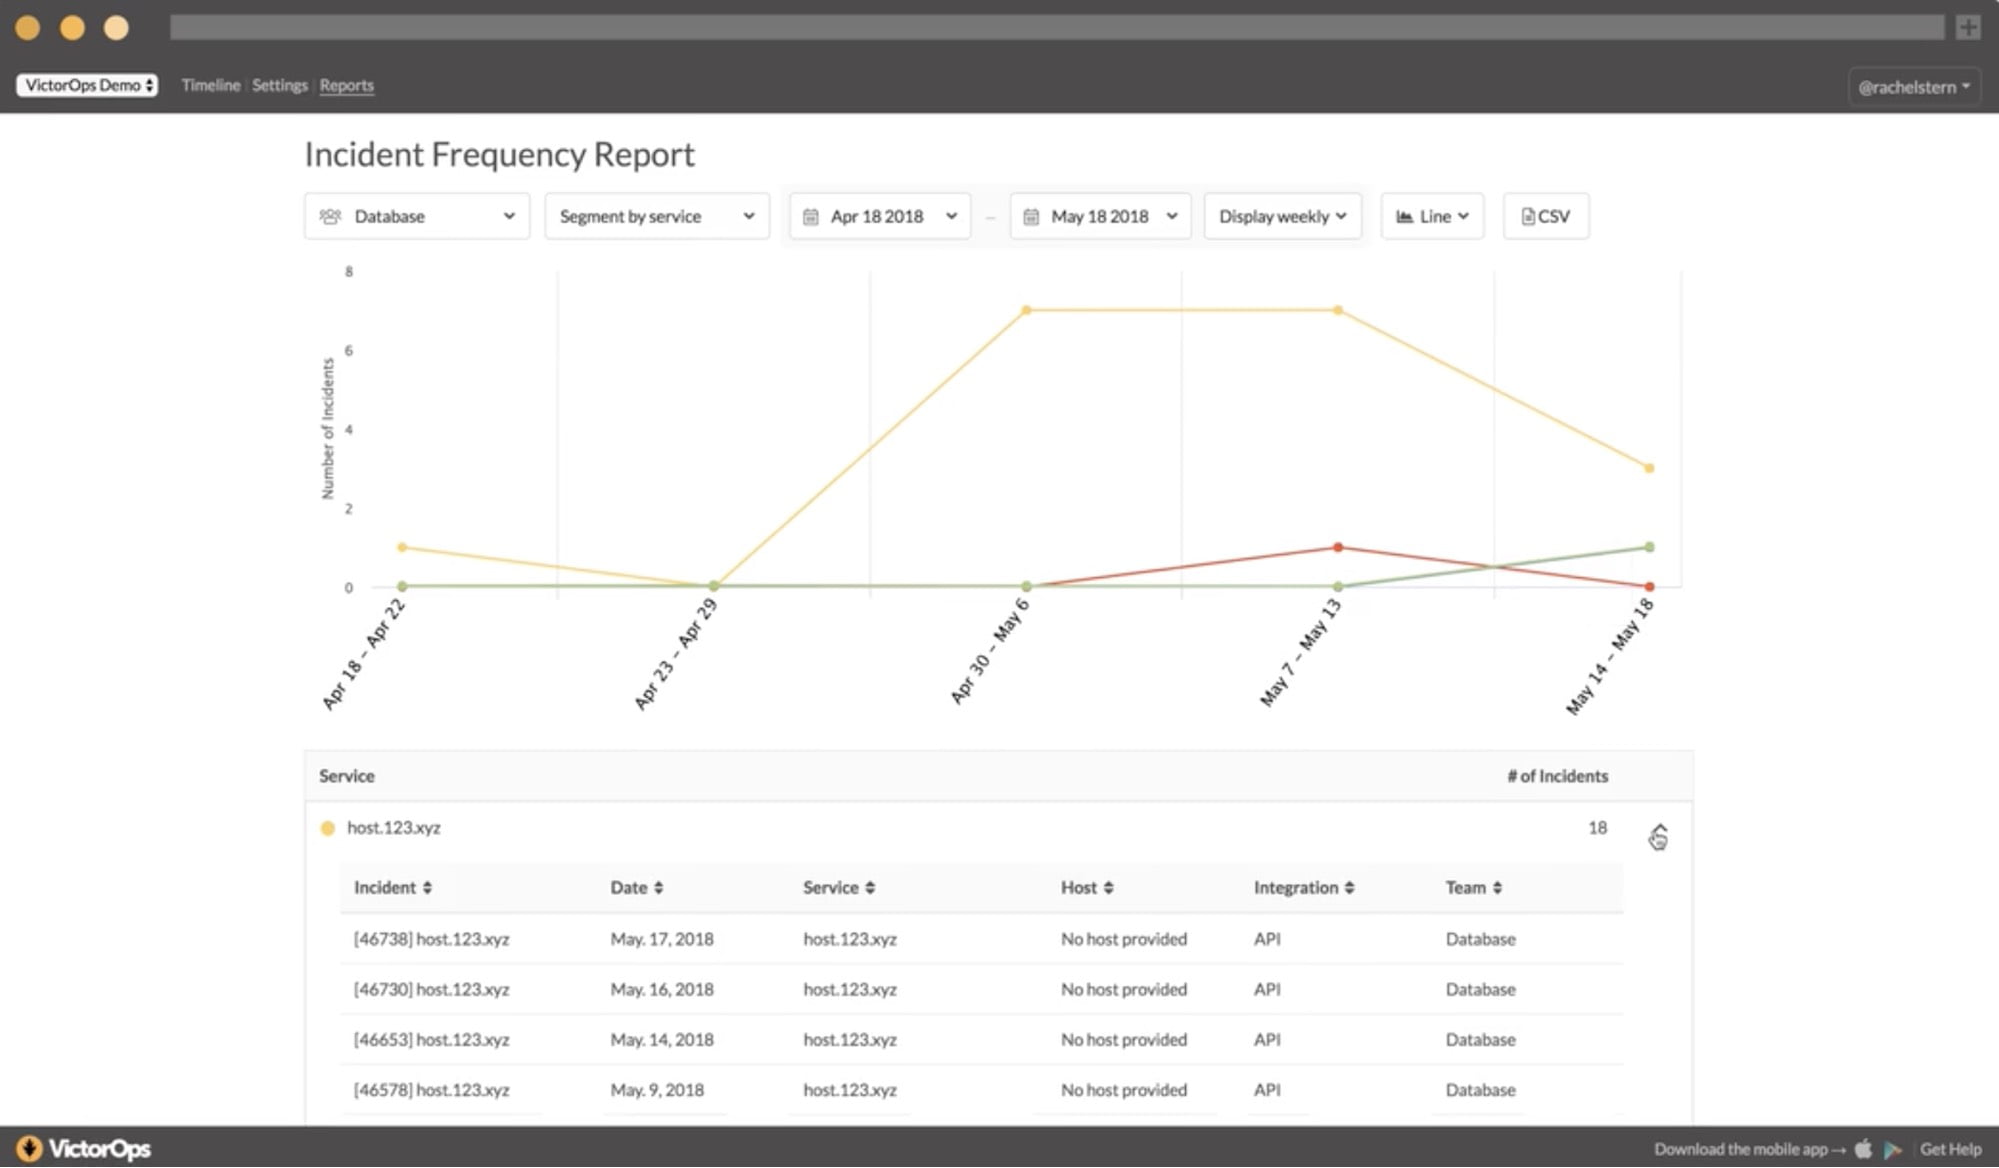
VictorOps is the tool that will quickly become your central place for alerts and notifications. It makes it possible to take action on alerts, schedule who is on-call, and should react to a given incident. With rules-based incident response, it is easy to automate responses for certain alerts to reduce the noise and fatigue generated by notifications coming from various systems hooked up with the rich set of available integrations.
Features:
- On-call scheduling and management with incident escalation and hands-off.
- Alerts and notification centralization.
- Incident automation with alert rules, automatic response, and noise suppression.
- Reports and post-incident reviews.
Pros:
- A large number of integrations available out of the box for centralizing the alerts and notifications in a single place.
- Dedicated tools for teams.
- Scheduling and incident escalation.
Pricing:
The pricing is based one features and the number of users. The basic plan starts from $8 per user per month when paid monthly and goes up to $33 per user per month for the Enterprise plan.
19. OpsGenie
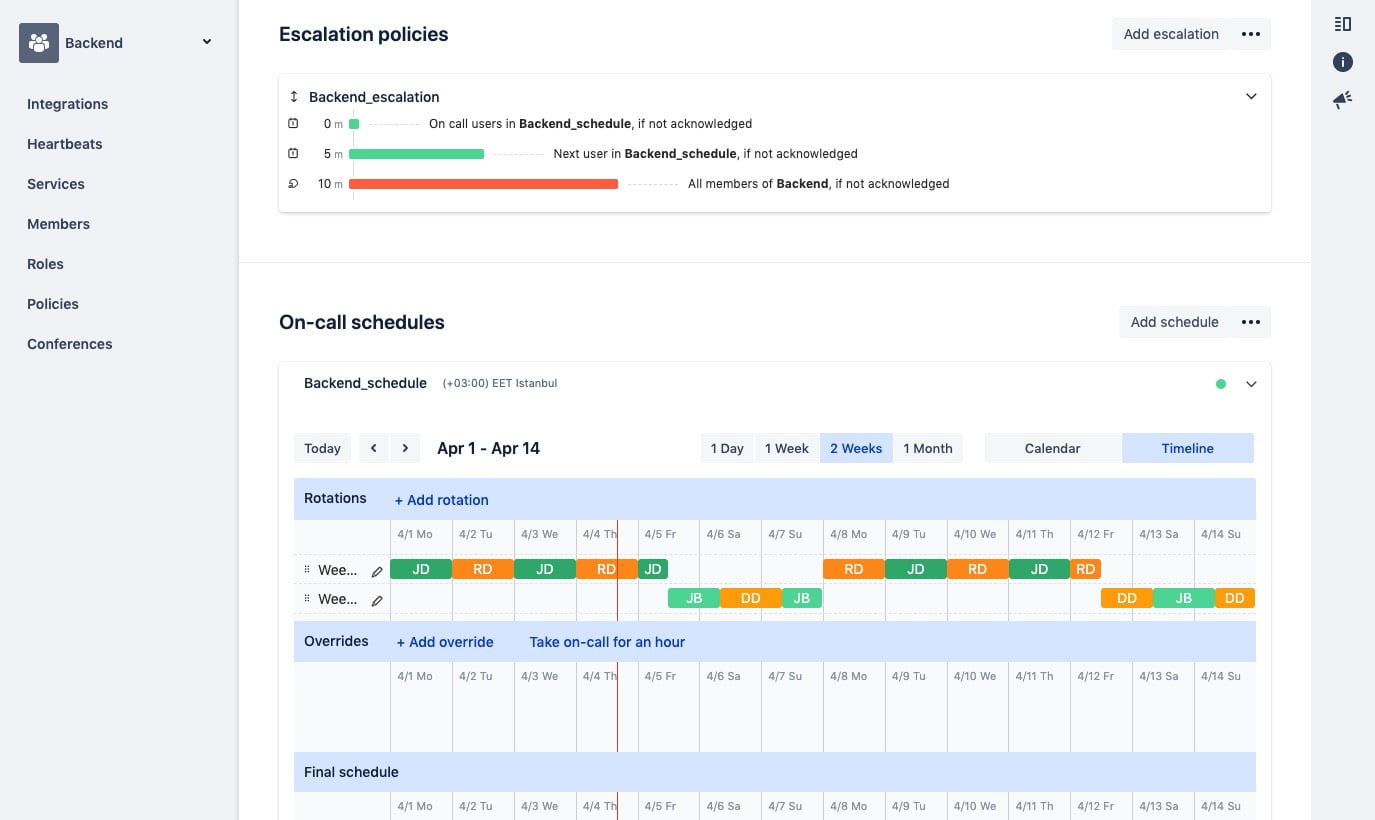
From the creators of JIRA and Confluence comes OpsGenie, the central place for your alerts and notifications. It allows for management of alerts, planning on-call schedules, and reacting automatically based on user-defined rules. With a rich set of integrations, heartbeat monitoring, and alerts deduplication, the platform can be used as a tool for centralizing all of your alerts and notifications.
Features:
- On-call scheduling and management with incident escalation.
- Alerts and notification centralization with rule-based routing.
- Advanced reporting with post-incident analysis.
- ChatOps and stakeholder communications with a web conference bridge.
- Incident command center.
Pros:
- Rich set of integrations available out of the box for centralizing the notifications and alerts in a single place.
- Team centric tools for multiple teams integrations.
- Heartbeat monitoring and alerts deduplication.
- Free tier available.
Pricing:
The pricing is based on features and the number of users. It starts with the limited free tier for up to 5 users with basic alerting and on-call management aimed for small teams. The first non-free tier starts with $11 per user per month when billed monthly and goes up to $35 per user per month with monthly billing. The price depends on the set of features of the platform that you will use. For instance, if you are OK with up to 25 international SMS notifications per user per month you will be fine with the basic, non-free plan.
20. xMatters
xMatters is a user-friendly central place for all your alerts and notifications. It allows managing and reacting on incidents from a single place with on-call schedules, incident escalation, and rule-based responses and resolutions. With the incident timeline, you can see how the reaction on the incident was performed and how well the team reacted to the situation giving your organization a tool helping you in improving alerts handling.
Features:
- On-call scheduling and management with incident escalation.
- Automatic, rule-based responses and resolutions.
- Stakeholder communication.
- Incident timeline with team performance calculations.
Pros:
- Over 100 integrations are available at the time of writing.
- Easy to learn and user-friendly.
- Free tier available.
Pricing:
The pricing, similar to the rest of the competitors like OpsGenie and PagerDuty is organized around features and the number of users. The pricing plans start with a free tier that is available for up to 10 users without any kind of SMS and voice notifications. The first paid plan starts at $16 per user per month and goes up to $59 per user per month making it the most expensive of the tools. Of course, the price depends on the features of the platform you choose to use. For example, if you are OK with up to 50 SMS notifications per user per month you will be fine with the basic, non-free plan.
What Tools Will You Use to Monitor Your Cloud-Based Operations?
Cloud computing, the public, hybrid, and private cloud environments opened up a world of opportunities. Learning cloud computing enables individuals to grasp the flexibility, on-demand scaling, ready-to-use services, and the ease of use that comes with that allow for the next generation of platforms to be built on top of them. However, to leverage all the opportunities you need to deal with a set of challenges. Those require good tools so you can understand the state of the environment along with all the key performance indicators that your environment provides. It is worth mentioning, that in some cases, to fully use the potential of the data and make sense of complex events you may need additional tools that will be able to process those events in real-time before they are pushed to the data store.
The available cloud monitoring tools and services all help you with the gathering of observability data, but they take different approaches, provide different functionalities, and come with different costs. Depending on your use case, some may be a better fit than others so make sure to try different solutions and choose the one that fits your needs the most. If you need help deciding check our monitoring and alerting guide where we discuss the criteria you should consider.
You might also be interested in: Best Infrastructure Monitoring Tools