eBPF has revolutionized the observability landscape in the Linux kernel. Throughout our previous blog post series, I covered the fundamental building blocks of the eBPF ecosystem, scratched the surface of XDP and showed how closely it cooperates with the eBPF infrastructure to introduce a fast-processing datapath in the networking stack.
Nevertheless, eBPF is not exclusive to kernel-space tracing. Wouldn’t it be splendid if we could instrument applications running in production while enjoying all the luxuries of eBPF-driven tracing?
This is where uprobes come into play. Think of them as a sort of kprobes that are attached to userspace tracepoints instead of kernel symbols. Numerous language runtimes, database systems, and other software stacks incorporate hooks that can be consumed by BCC tools. Specifically, the ustat tool collects a bunch of valuable events such as garbage collection events, object creation statistics, method calls and more.
The bad news is that “official” language runtime releases, like Node.js and Python, don’t ship with DTrace support, which means that you’ll have to build from source passing the –-with-dtrace flag to the compiler. This is not a prerequisite for natively compiled languages. As long as the symbol table is available it is possible to apply dynamic tracing to any symbol present in the binary’s text segment. Instrumenting Go or Rust stdlib function calls on live binaries is accomplished this way.
eBPF Techniques for Instrumenting Applications
There are various approaches to tracing user space processes:
- Statically declared USDT
- Dynamically declared USDT
- Dynamic tracing with uprobes
Free OpenTracing eBook
Want to get useful how-to instructions, copy-paste code for tracer registration? We’ve prepared an OpenTracing eBook which puts all key OpenTracing information at your fingertips: from introducing OpenTracing, explaining what it is and does, how it works, to covering Zipkin followed by Jaeger, both being popular distributed tracers, and finally, compare Jaeger vs. Zipkin. Download yours.
Statically declared USDT
USDT (Userland Statically Defined Tracing) embodies the idea of embedding probes directly in user code. The origin of this technique dates back to the Solaris/BSD DTrace era and consists of using the DTRACE_PROBE() macro for declaring the tracepoint at strategic code locations. Unlike regular symbols, USDT hooks are guaranteed to remain stable even if the code is refactored. The following diagram depicts the process of declaring a USDT tracepoint in the user code all up to its execution in the kernel.
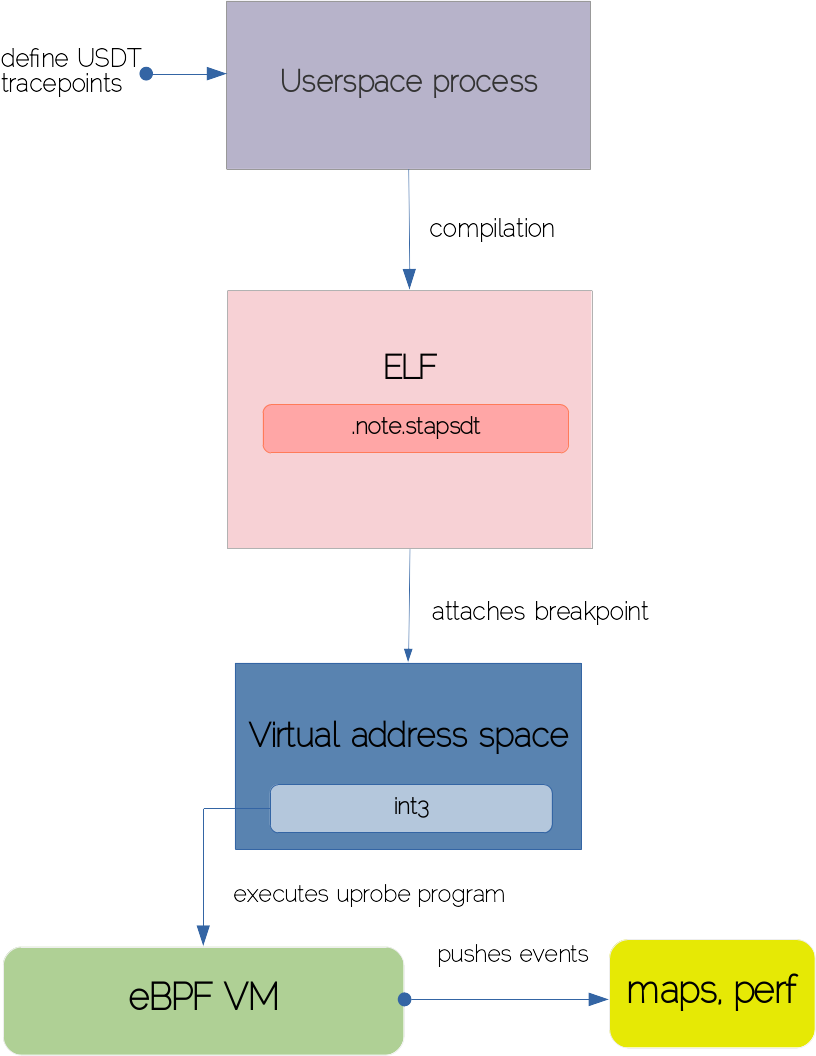
A developer would start by implanting tracepoints via the DTRACE_PROBE and DTRACE_PROBE1 macros to surround the code blocks of interest. Both macros accept a couple of mandatory arguments such as provider/probe names, followed by any value you would like to consult from the tracepoint. The compiler will squash the USDT tracepoints inside the ELF section of the target binary. The contract between compilers and tracing tools dictates that a .note.stapstd section must exist where USDT metadata resides.
The USDT tracing tool introspects the ELF section and places a breakpoint on the tracepoint’s location that is translated to an int3 interrupt. Whenever control flow is executed at the tracepoint’s marker, the interrupt handler is triggered and the program associated with the uprobe is called in the kernel to process the events and broadcast them to userspace, perform map aggregations, etc.
Dynamically declared USDT
Since USDT is pushed into statically generated ELF section, it defeats the purpose of declaring USDT for the software that runs on interpreted or JIT-based languages. Luckily, it is possible to define tracepoints in the runtime via libstapsdt. It produces a tiny shared object with USDT information that is mapped to the process’ address space so tracing tools can attach to intended tracepoints. Bindings for libstapsdt exist in many languages. Head to this example to find out how to install USDT probes in Node.js.
Dynamic tracing with uprobes
This type of tracing mechanism doesn’t require any extra capabilities from the target process, except that its symbol table is accessible. This is the most versatile and powerful instrumentation method as it allows for injecting breakpoints at arbitrary instructions without even restarting the actual process.
Tracing examples
After a brief theoretical introduction, let’s see some concrete examples on how to instrument real-world apps crafted in diverse languages.
C
Redis is a popular key-value data structures server built in C. Taking a sneak peek into the Redis symbol table reveals a vast number of functions that are candidates for capturing via uprobes.
$ objdump -tT /usr/bin/redis-server
…
000000000004c160 g    DF .text  00000000000000cc  Base
addReplyDouble
0000000000090940 g    DF .text  00000000000000b0  Base        sha1hex
00000000000586e0 g    DF .text  000000000000007c  Base
replicationSetMaster
00000000001b39e0 g    DO .data  0000000000000030  Base
dbDictType
00000000000ace20 g    DF .text  0000000000000030  Base
RM_DictGetC
0000000000041bc0 g    DF .text  0000000000000073  Base
sdsull2str
00000000000bba00 g    DF .text  0000000000000871  Base        raxSeek
00000000000ac8c0 g    DF .text  000000000000000c  Base
RM_ThreadSafeContextUnlock
00000000000e3900 g    DF .text  0000000000000059  Base
mp_encode_lua_string
00000000001cef60 g    DO .bss   0000000000000438  Base        rdbstate
0000000000047110 g    DF .text  00000000000000b5  Base
zipSaveInteger
000000000009f5a0 g    DF .text  0000000000000055  Base
addReplyDictOfRedisInstances
0000000000069200 g    DF .text  000000000000004a  Base
zzlDelete
0000000000041e90 g    DF .text  00000000000008ba  Base
sdscatfmt
000000000009ac40 g    DF .text  000000000000003a  Base
sentinelLinkEstablishedCallback
00000000000619d0 g    DF .text  0000000000000045  Base
psetexCommand
00000000000d92f0 g    DF .text  00000000000000fc  Base
luaL_argerror
00000000000bc360 g    DF .text  0000000000000328  Base
raxRandomWalk
0000000000096a00 g    DF .text  00000000000000c3  Base
rioInitWithFdset
000000000003d160 g    DF .text  0000000000000882  Base
serverCron
0000000000032907 g    DF .text  0000000000000000  Base
je_prof_thread_name_set
0000000000043960 g    DF .text  0000000000000031  Base        zfree
00000000000a2a40 g    DF .text  00000000000001ab  Base
sentinelFailoverDetectEnd
00000000001b8500 g    DO .data  0000000000000028  Base
je_percpu_arena_mode_names
00000000000b5f90 g    DF .text  0000000000000018  Base
geohashEstimateStepsByRadius
00000000000d95e0 g    DF .text  0000000000000039  Base
luaL_checkany
0000000000048850 g    DF .text  00000000000002d4  Base
createClient
...
There is an interesting createStringObject function that Redis utilizes internally for allocating strings modeled around the robj structure. Redis commands are produced on behalf of createStringObject calls. We can spy on any command sent to the Redis server by hooking this function. For this purpose, I’m going to use the trace utility from the BCC toolkit.
$ /usr/share/bcc/tools/trace '/usr/bin/redis-server:createStringObject "%s" arg1'
PID     TID     COMM            FUNC             -
8984    8984    redis-server    createStringObject b'COMMANDrn'
8984    8984    redis-server    createStringObject
b'setrn$4rnoctirn$4rnfestrn'
8984    8984    redis-server    createStringObject b'octirn$4rnfestrn'
8984    8984    redis-server    createStringObject b'festrn'
8984    8984    redis-server    createStringObject b'getrn$4rnoctirn'
8984    8984    redis-server    createStringObject b'octirn'
The above is the output yielded by executing set octi fest and get octi from the Redis CLI client.
Java
Modern JVM versions ship with built-in support for USDT. All the probes are brought on behalf of the libjvm shared object. We can dig out available tracepoints in the ELF section.
$ readelf -n /usr/lib/jvm/jdk-11-oracle/lib/server/libjvm.so
...
stapsdt              0x00000037       NT_STAPSDT (SystemTap probe
descriptors)
  Provider: hs_private
  Name: cms__initmark__end
  Location: 0x0000000000e2420c, Base: 0x0000000000f725b4, Semaphore: 0x0000000000000000
  Arguments:
stapsdt              0x00000037       NT_STAPSDT (SystemTap probe descriptors)
  Provider: hs_private
  Name: cms__remark__begin
  Location: 0x0000000000e24334, Base: 0x0000000000f725b4, Semaphore: 0x0000000000000000
  Arguments:
stapsdt              0x00000035       NT_STAPSDT (SystemTap probe descriptors)
  Provider: hs_private
  Name: cms__remark__end
  Location: 0x0000000000e24418, Base: 0x0000000000f725b4, Semaphore: 0x0000000000000000
  Arguments:
stapsdt              0x0000002f       NT_STAPSDT (SystemTap probe descriptors)
  Provider: hotspot
  Name: gc__begin
  Location: 0x0000000000e2b262, Base: 0x0000000000f725b4, Semaphore: 0x0000000000000000
  Arguments: 1@$1
stapsdt              0x00000029       NT_STAPSDT (SystemTap probe descriptors)
  Provider: hotspot
  Name: gc__end
  Location: 0x0000000000e2b31a, Base: 0x0000000000f725b4, Semaphore: 0x0000000000000000
  Arguments:
...
To capture all class load events we can use the following command:
$ /usr/share/bcc/tools/trace
'u:/usr/lib/jvm/jdk-11-oracle/lib/server/libjvm.so:class__loaded "%s", arg1'
Similarly, we can watch on thread creation events:
$ /usr/share/bcc/tools/trace
'u:/usr/lib/jvm/jdk-11-oracle/lib/server/libjvm.so:thread__start "%s", arg1'
PID     TID     COMM            FUNC
27390   27398   java            thread__start    b'Reference Handler'
27390   27399   java            thread__start    b'Finalizer'
27390   27400   java            thread__start    b'Signal Dispatcher'
27390   27401   java            thread__start    b'C2 CompilerThread0'
27390   27402   java            thread__start    b'C1 CompilerThread0'
27390   27403   java            thread__start    b'Sweeper thread'
27390   27404   java            thread__start    b'Service Thread'
When extended probes are enabled via -XX:+ExtendedDTraceProbes property, the uflow tool is able to trace and graph all method executions in real-time.
$ /usr/share/bcc/tools/lib/uflow -l java 27965
Tracing method calls in java process 27965... Ctrl-C to quit.
CPU PID    TID    TIME(us) METHOD
5   27965  27991  0.736    <- jdk/internal/misc/Unsafe.park
5   27965  27991  0.736    ->
java/util/concurrent/locks/LockSupport.setBlocker'
5   27965  27991  0.736      -> jdk/internal/misc/Unsafe.putObject
5   27965  27991  0.736      <- jdk/internal/misc/Unsafe.putObject
5   27965  27991  0.736    <-
java/util/concurrent/locks/LockSupport.setBlocker'
5   27965  27991  0.736    <-
java/util/concurrent/locks/LockSupport.parkNanos
5   27965  27991  0.736    ->
java/util/concurrent/locks/AbstractQueuedSynchronizer$ConditionObject.checkInterruptWhileWaiting
5   27965  27991  0.737      -> java/lang/Thread.interrupted
5   27965  27991  0.737        -> java/lang/Thread.isInterrupted
5   27965  27991  0.737        <- java/lang/Thread.isInterrupted
5   27965  27991  0.737      <- java/lang/Thread.interrupted
5   27965  27991  0.737    <-
java/util/concurrent/locks/AbstractQueuedSynchronizer$ConditionObject.checkInterruptWhileWaiting
5   27965  27991  0.737    -> java/lang/System.nanoTime
5   27965  27991  0.737    <- java/lang/System.nanoTime
However, this tends to be quite expensive in terms of overhead incurred by extended probes making them unfit for production debugging.
Go
I’m going to finish the demonstration of the tracing techniques with an example in Go. Since Go is a natively compiled language it is tentative to use the trace tool to attach uprobe programs on target symbols. You can try it yourself with this trivial code snippet:
package main

import "fmt"

func main() {
  fmt.Println("Hi")
}

$ go build -o hi build.go

$/usr/share/bcc/tools/trace '/tmp/hi:fmt.Println "%s" arg1'
PID     TID     COMM            FUNC             -
31545   31545   hi              fmt.Println      b'xd6x8dK'
Instead of our glorious “Hi” string, we got some random garbage in the argument column. This is in part caused by trace not being able to handle Println variadic arguments, but also of the wrong assumption regarding ABI calling conventions. Unlike C/C++ where the preferred way of passing parameters is in regular registers, Go passes parameters on the stack.
Since we cannot rely on the trace to demonstrate how to instrument Go code, I’ll be building a simple tool to trace all HTTP GET requests that are emitted by the http.Get function. You could easily adapt it to capture other HTTP request verbs, but I’m leaving it as an exercise. The full source code can be found in this repo.
I’ll not go into details regarding the uprobe attaching/loading process since we are using the Go bindings for libbcc to do the heavy lifting. Let’s dissect the actual uprobe program.
After the required include statements, we have the definition of the macro responsible for picking up the parameters from the stack by means of offset handling.
#define SP_OFFSET(offset) (void *)PT_REGS_SP(ctx) + offset * 8
Next, we declare the structure for encapsulating events that are streamed through reqs map. The map is defined with the BPF_PERF_OUTPUT macro. The core of our program is the __uprobe_http_get function. Whenever http.Get is invoked, the previous function is triggered in the kernel space. We know http.Get has a single argument that represents the URL where a HTTP request is sent to. Another difference between C and Go is how they layout strings in memory.
While C strings are null-terminated sequences, Go treats strings as two-word values comprising the pointer to the memory buffer and the string length. This explains that we need two calls to bpf_probe_read – one for reading the string and the second for pulling its length.
bpf_probe_read(&url, sizeof(url), SP_OFFSET(1));
bpf_probe_read(&req.len, sizeof(req.len), SP_OFFSET(2));
Later in userspace, the URL is trimmed from the byte slice to its corresponding length. As a side note, I would like to mention that the draft version of the tool was able to dig out latencies for each HTTP GET request by injecting an uretprobe. However, this proved to have a catastrophic effect each time the Go runtime decides to shrink/grow the stack, because uretprobes patch the return address on the stack to the trampoline function that’s executed in the context of the eBPF VM. On exiting the uretprobe function, the instruction pointer is restored to the original return address which might point to an invalid location messing up the stack and causing the process to crash. There are some proposals to address this issue.
Conclusion
We have come to the end of our eBPF journey. In this final article, we shed some light on eBPF features for instrumentation of userspace processes. Through several pragmatic cases, we’ve shown the versatility of the BCC framework for capturing observability signals. Finally, we got our hands dirty and built a small tool for tracing HTTP requests on live Go apps. Before you go, don’t forget to download OpenTracing eBook to get useful how-to instructions and copy-paste code.