Unlike logs, which tend to be high volume, events are a little more infrequent, a little more special. Events are things like alerts, or deploys, or builds, or… Ultimately though, it is up to you and your team to choose what to push into Sematext as an event.
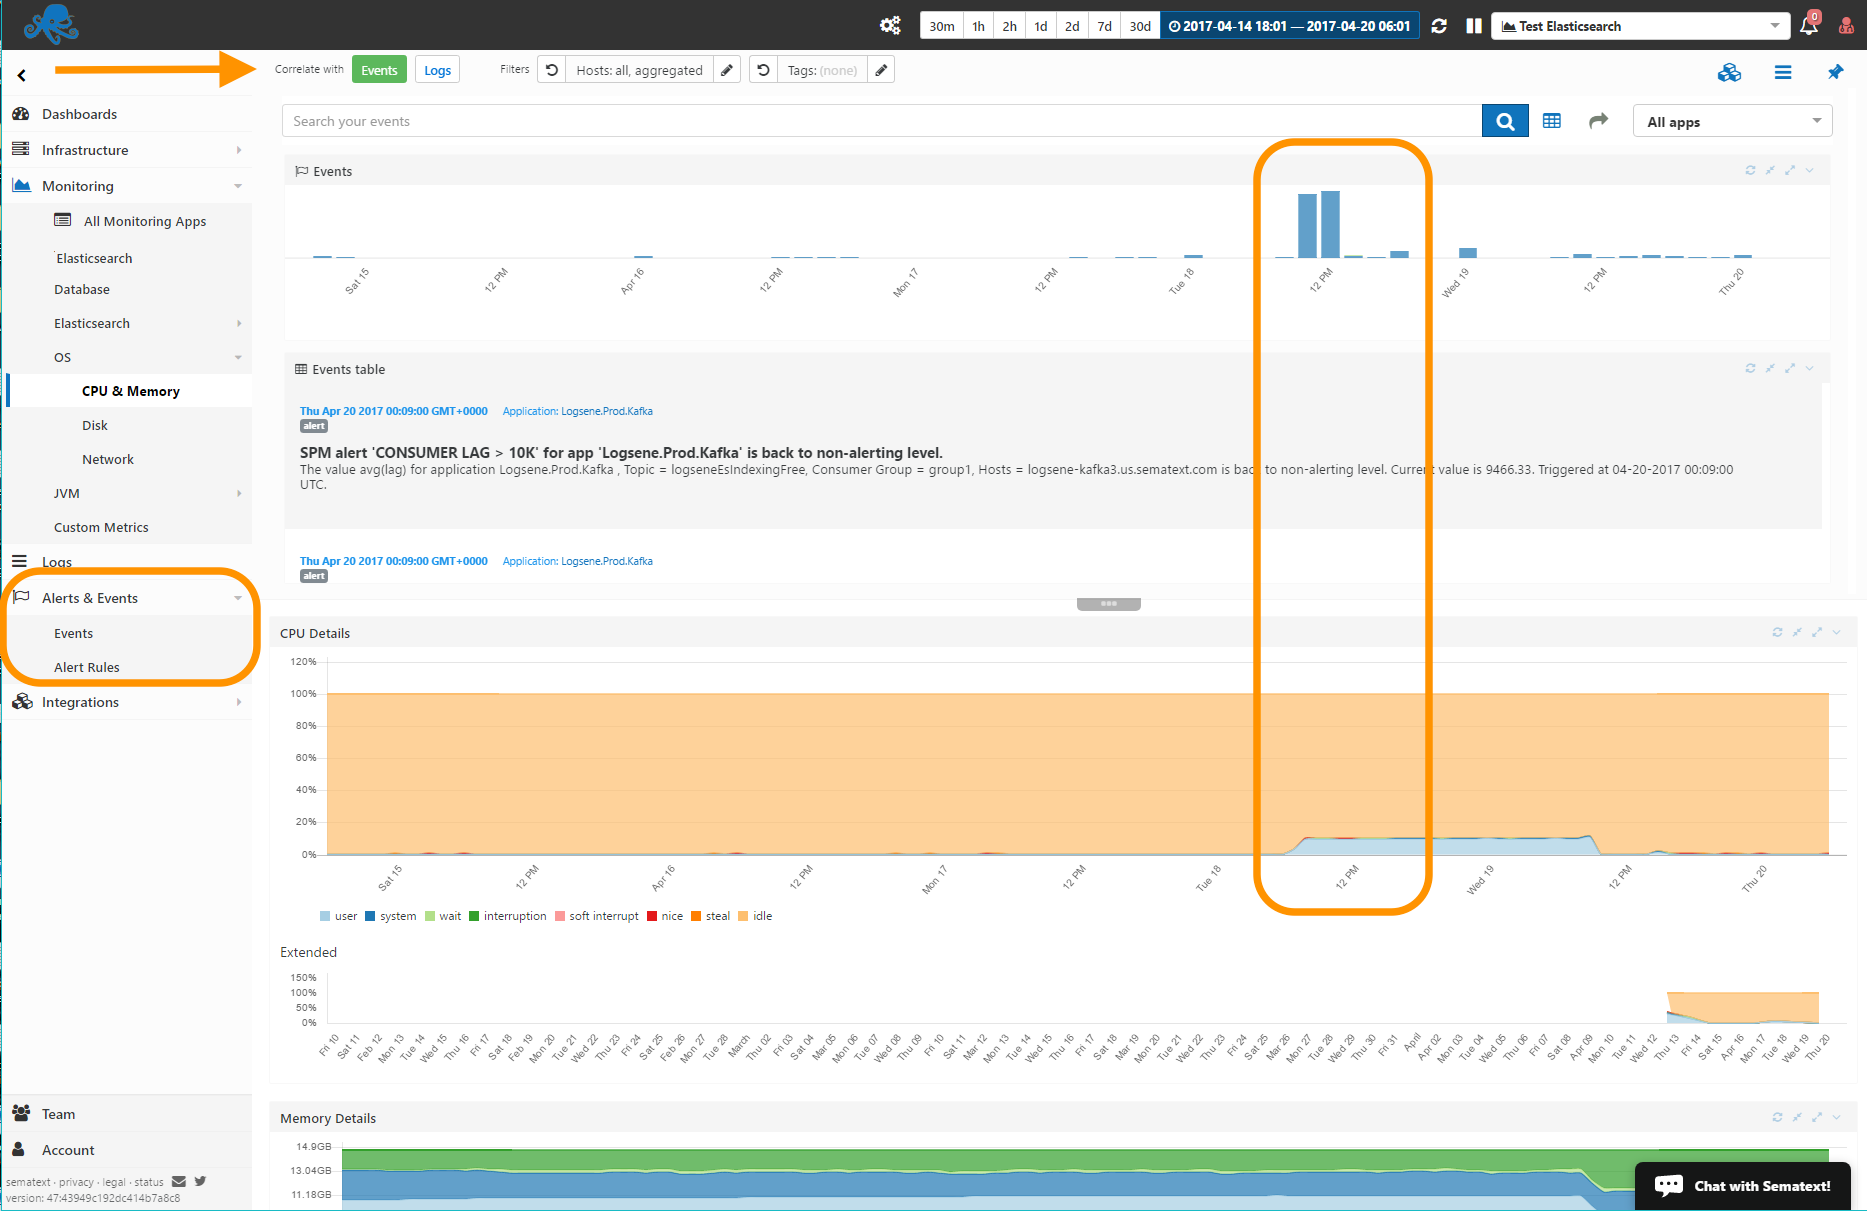
In this release we’ve surfaced Events all the way to the top, so they now stand shoulder to shoulder to metrics and logs. You can see them smiling at you from the left side in our new UI. You can view logs in their own event stream-like view and you can search them of course. Importantly, however, you can also correlate events with metrics, as shown below, much like you can correlate logs and metrics. Why is correlating events with metrics valuable? Think about being able to correlate a bad build or not quite fully tested release deployment with a change in metric values. When it’s sudden and things break right away you don’t necessarily need any tools to point out the correlation – you’ve got fire you need to put out and the correlation is obvious. However, often times a bad release isn’t immediately apparent. CPU usage may gradually grow, as can a memory leak. New log files you forgot to rotate and compress will consume your disk slowly and set of alerts right before you’re about to go home for the day. For such things it is handy to be able to look at metrics and events and see the correlation. Sounds good? Log in to see for yourself and check it out!