Monitoring the performance of an application is not a strange concept to most developers. At one point or another, we’ve all had to do some performance debugging of our own. Usually, it happens when there’s a big issue affecting the user’s experience or cost implications. Only then do we make time to look at how the app performs in different scenarios.
Of course, there are different parts of the application that you can, and should, monitor separately. Most people split an app between frontend and backend and to save time, I’ll do the same. This article will focus on frontend performance monitoring and the tools you can use to do it. Below I reviewed some of the best frontend performance monitoring SaaS to help you get started.
But first things first.
What Is Frontend Application Monitoring?
Frontend monitoring is what we use to describe the process and tools used by developers to track and maintain the health of the presentation layer of your applications. It’s basically everything that a user would interact with, from the content and menu to APIs and other client-facing components.
Application performance monitoring, or APM, focuses on what users experience rather than the communication between server and client. While both are worth keeping an eye on, understanding how the users interact with your application is crucial in delivering a good experience, which leads me to my next point.
Is Frontend Monitoring Important?
Absolutely! We use many different monitoring tools and techniques to monitor our backend, databases, infrastructure, and frontend shouldn’t be any different. As the complexity of our websites and applications increases, the monitoring needs are going up too. Twenty years ago, you might have gotten away with just pinging your server a couple of times a day. Today that’s nowhere near enough. Any downtime or degradation of the performance of your website can have severe consequences.
What Performance Issues Can Frontend Monitoring Tools Fix?
When it comes to measuring application performance, I suggest we split our focus into three main components that I believe are of equal importance.
Speed
This should be obvious. Slow loading resources will cause bottlenecks and a bad user experience, so it’s crucial to resolve them as soon as possible. Before you ask how fast should a good site be and how slow is considered too slow, there’s an application performance index called Apdex that helps you figure out the target response time.
Your page speed will be significantly affected by the size of your resources and the number of requests. As a general rule of thumb, you should try to optimize all your resources and get the response times to be as fast as possible. These are just two of the many things you can do to increase website speed. You can find more techniques in our article about front-end optimization tips.
If you don’t know yet how fast is your website, read our blog post on how to properly check website speed.
Errors and Functionality
I’m not talking about the obvious errors that you’ll get like 404 or 503. I’m talking about the errors that are less obvious like a 3rd party API that refuses connection or sending an HTTP request when you should be sending an HTTPS request. Issues like these can cause severe service disruptions that will break your users’ experience.
Having a tool that alerts you whenever your website or app experiences an issue regardless of whether it’s a JavaScript error, network failure, or a framework-specific issue will make your life a whole lot better. Get a tool that does log monitoring and management such as Sematext Logs, and you’ll find it even easier to identify and fix the issue you are having.
While some of the issues you’ll run into as a developer can be solved using solely the information you were provided in the console log, you will have some that aren’t as easy to figure out. In some cases you’ll have a single location for your logs but more often than not, your logs will be in separate locations, with separate timestamps, and probably have different redundancies that will make debugging quite complicated.
Having a tool that can store, archive, and control the quality of your logs is essential to understanding the whole picture. You can use separate solutions, but having logging and monitoring in a single platform makes troubleshooting critical issues much faster and much simpler.
Availability
Not to state the obvious here, but your website needs to be online and working for your users to use it. Duh! But availability can be difficult to ensure, especially once you’ve grown enough and you have a bigger pool of users that are located around the world. Having insight into how your users experience your website will help tremendously, which is the perfect scenario for using real user monitoring tools such as Sematext Experience.
Such a solution will follow the user’s progress throughout the application giving you information about how they interact with it and what kind of responses they’re getting. Based on these UX metrics, you’ll be able to decide if you need a faster machine, better scaling, or have to optimize your business logic.
Best Tools to Monitor Application & Website Performance
1. Sematext
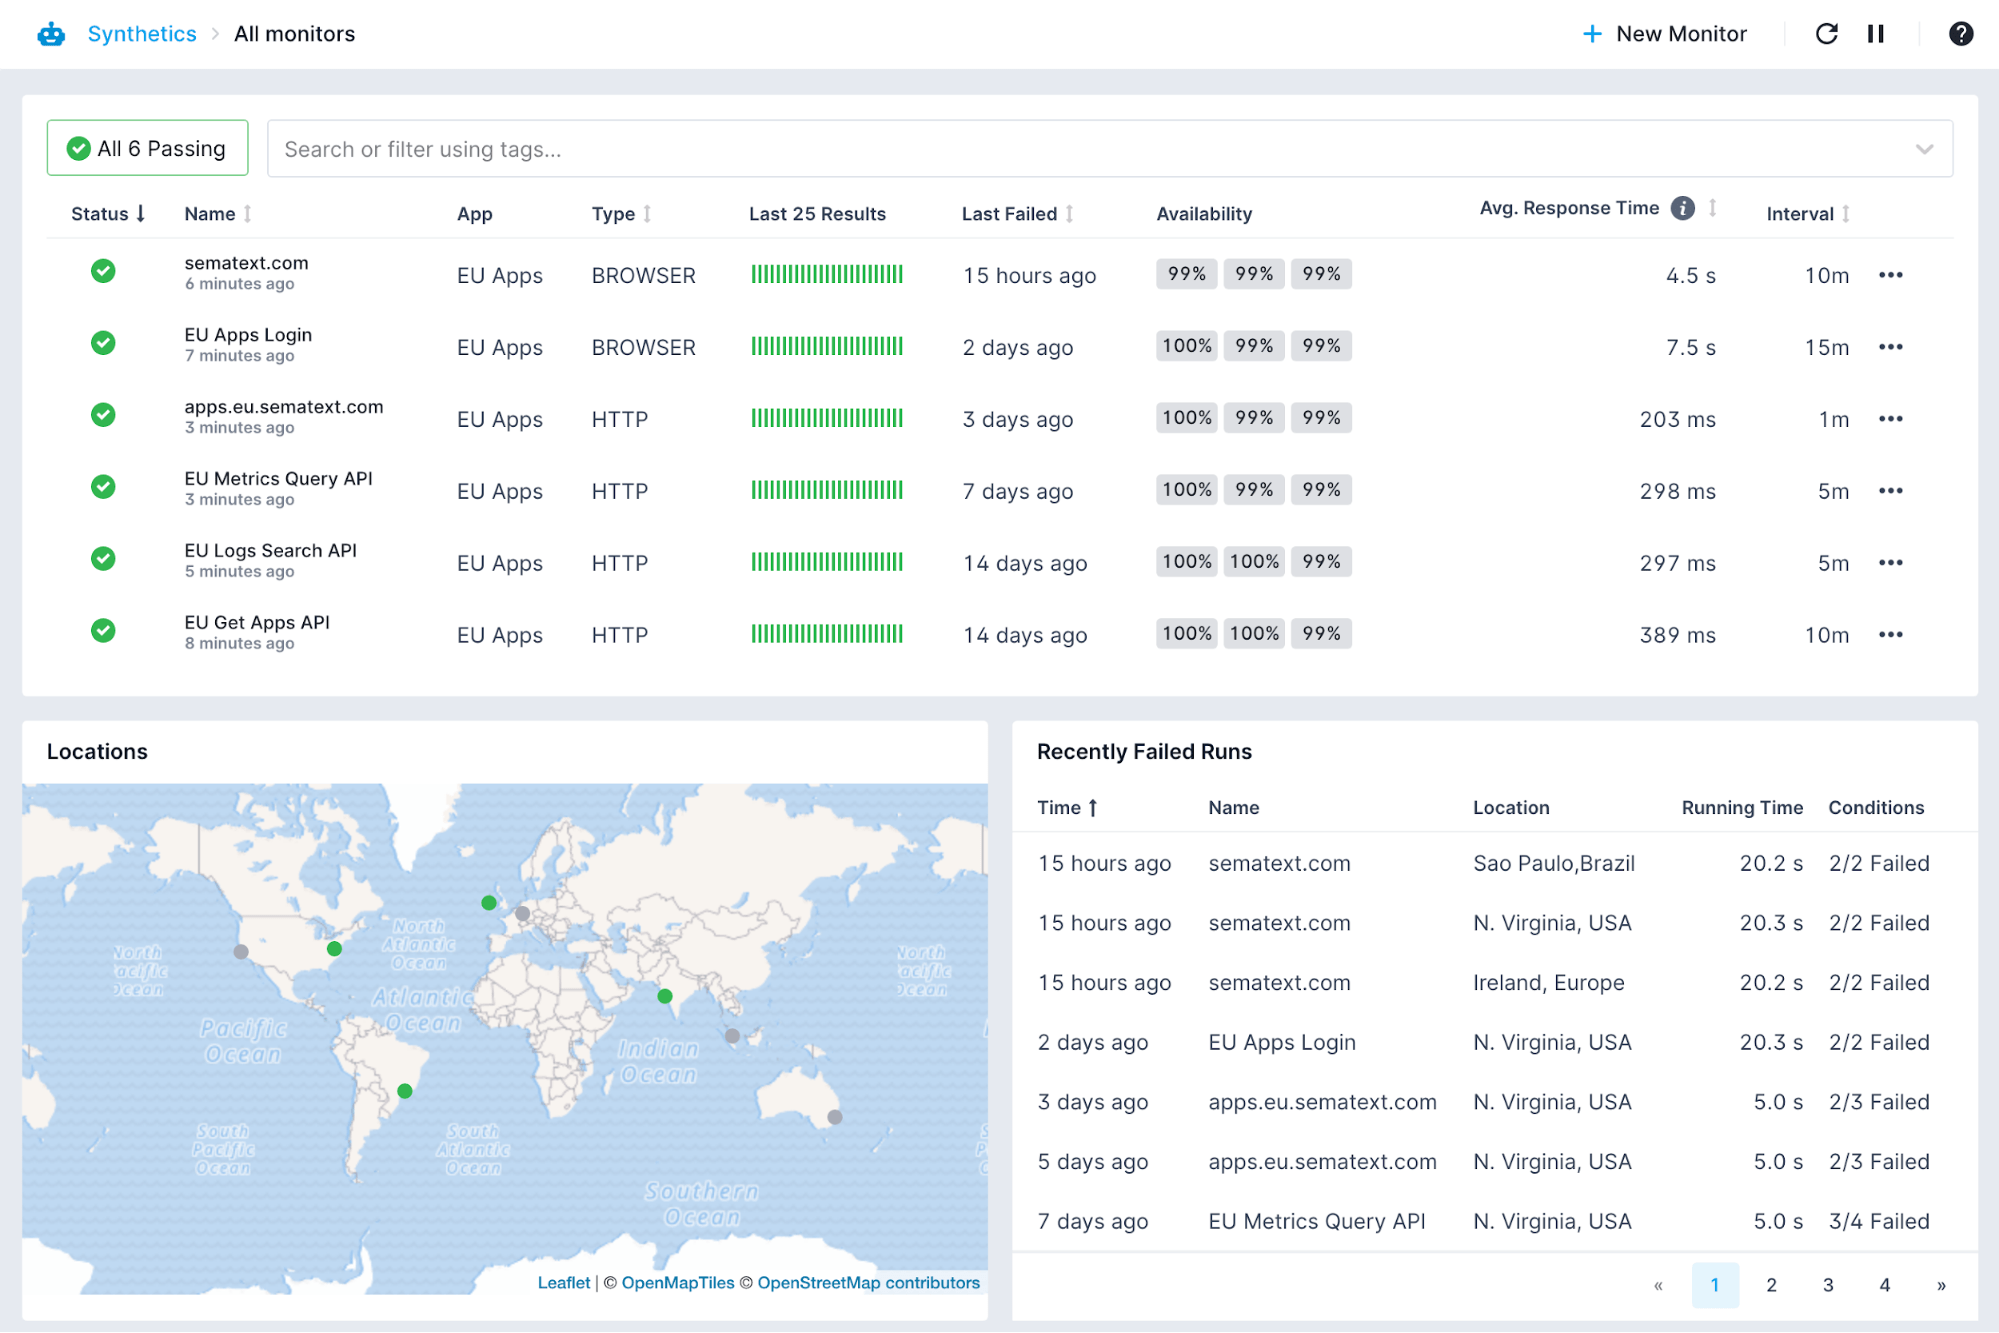
Sematext Cloud is pretty much a one-stop-shop for all your monitoring needs. It offers a wide array of tools to help you monitor your performance, availability, debug errors, and keep a close eye on your infrastructure while you are at it.
Sematext Synthetics is a synthetic monitoring tool that allows you to create complex monitors for all your resources. Each resource can be pinged from multiple locations with a frequency of 10 minutes up to an hour. This will report back on your website speed, error rates, SSL certificate errors, API availability, website uptime, and more.
By adding Sematext Experience to the mix, a real user monitoring solution, Sematext is the go-to tool for whenever you need reports on the actual experience and satisfaction of your users while providing critical pieces of information as to how your website or application is performing in different locations, devices, or different connection speeds. Experience gives you all the standard RUM metrics to improve performance, including Cumulative Layout Shift, Largest Contentful Paint, or First Input Delay.
One of the major differentiators of Sematext is that besides the two products created focused on frontend performance monitoring, it also has Sematext Logs. This comes in handy when you are trying to debug the different performance issues and errors you might encounter.
With a 14-day trial and pricing starting at $9/month for Sematext Experience, $29/month for Synthetics, and the Pay-as-you-go option available as low as $2/monitor, Sematext is a must-have.
Features:
- A unified location for all your logs, metrics, and events
- Identify resources & requests with the biggest negative impact on your website performance
- Real-time alerts and debugging solutions
- Support for all major frameworks
- Very well documented features
Ready to get started with Sematext Cloud? Check out the short video below!
2. AppSignal
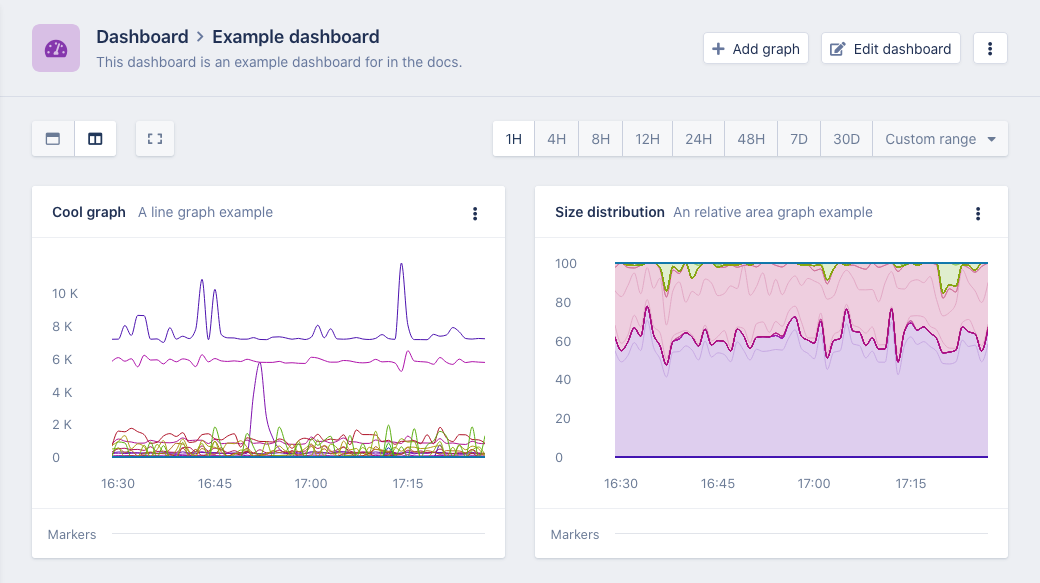
AppSignal is a tool that provides insights into your performance for both the front end and the background jobs, has host monitoring, error tracking, and allows you to collect metrics from your app. You can keep an eye on payload sizes, database queries, revenue, and many more with easily customizable dashboards.
AppSignal is simple to install thanks to the lightweight Rust-powered agent. It monitors your applications’ performance displaying a simple breakdown of the actions it recorded and the metrics associated with it. You’ll see details about CPU usage, memory allocation, and network information, as well as an Event Timeline that shows details on what the code is actually doing. This allows you to understand what part of your application is taxing your performance and what areas need improvement.
It features an anomaly detection system that comes with a few prebuilt alerts that trigger whenever things aren’t exactly working as they should. This is useful when you are just starting out and are unsure what to look for or when you are under heavy load, and there are too many things to keep track of.
While AppSignal is easy to use and implement, it does lack advanced logging and infrastructure monitoring, which will leave you with a few big questions. You’ll be able to see all your frontend performance details, but half of the picture will be blank.
AppSignal comes with a 30-day trial and simple pricing based on requests that start at $19 per month for 250K requests going up to 2500M for $2249/month.
Features:
- Anomaly detection
- Out of the box alerts
- Easy installation
- Simple pricing
3. Sentry
Sentry provides engineering teams with tools to detect and solve user-impacting bugs and other issues. One of the cool things about it is its open-source version that’s completely free and has the same bells and whistles as the paid version. We are not going to compare that version today, but I figured I’d mention it to get it out of the way.
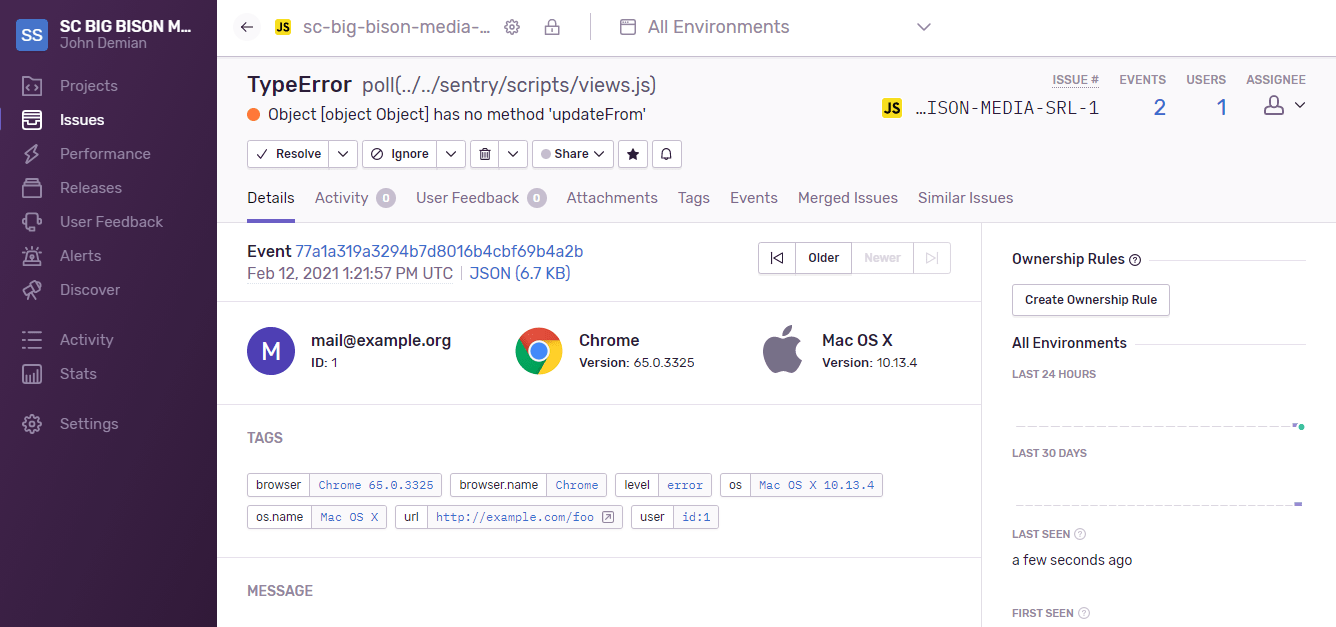
Sentry is going to tell you when your application is crashing or going too slow and how the application is performing, enabling you to drill down into the areas that require your attention. Instead of addressing the error, you would address the issue that would have eventually led to the error.
The Performance view lets you understand how many transactions are getting triggered, how long they take and show you an Apdex score, which, as I mentioned earlier, is the ratio of both tolerable and satisfactory response times compared to all the response times.
While Sentry has support for server-side programming languages it lacks a server-specific logs integration. It does allow you to drill down on different transactions and see a breakdown of all the resources associated with them. This is not a deal-breaker for most. But if you are looking for an end-to-end monitoring solution, this one might leave you wanting more.
Sentry has four pricing plans, including the free tier. The paid plans start at $29, going up to $2120/month depending on the number of errors monitored, transactions, and the size of the field attached to those errors. There is a 30-day trial that allows you to see all their features in action without having to pay a dime.
Features:
- Easy installation
- Uses Google’s Web vitals to provide details on performance
- Transaction tracing
4. Site24x7
Site24x7 is an alternative for viewing how your application or project does in the real world. Advertised as an Availability and User experience monitoring solution, Site24x7 offers many neat features like server monitoring, cloud management, RUM, and more.
When it comes to frontend performance monitoring, Site24x7 has a Web section where you can create monitors for your websites or APIs. These monitors will ping your desired resource to collect data like availability, response time, downtimes, etc.
Site24x7 will also track SLA compliance on their REST API section, which will come in handy. This view shows a breakdown of your availability and response by location, a history of all your breakdowns that occurred in the past 24 hours, as well as details on throughput and response times. Besides that, Site24x7 monitors your SSL and TLS certificates as well as domain expiration and will let you know whenever one expires, or there’s an issue.
I’d be remiss if I wouldn’t mention their RUM tool. It helps you understand what your users are experiencing, the device and what browsers they are using, and where they are located.
As part of their product lineup, Site24x7 offers cloud-based log management that allows you to have a centralized location for log monitoring. This will make troubleshooting infrastructure issues a lot easier by providing actionable insights on things like exceptions, timeouts, delays, and other errors you might encounter.
Site24x7 offers a 30-day trial period with no credit card required and has four plans starting at $10 and goes all the way up to $499 per month.
Features:
- All-in-one monitoring solution
- Comprehensive API transaction monitoring
- Real user monitoring tool
Want to see how Sematext stacks up? Check out our page on Sematext vs Site24x7.
5. Pingdom
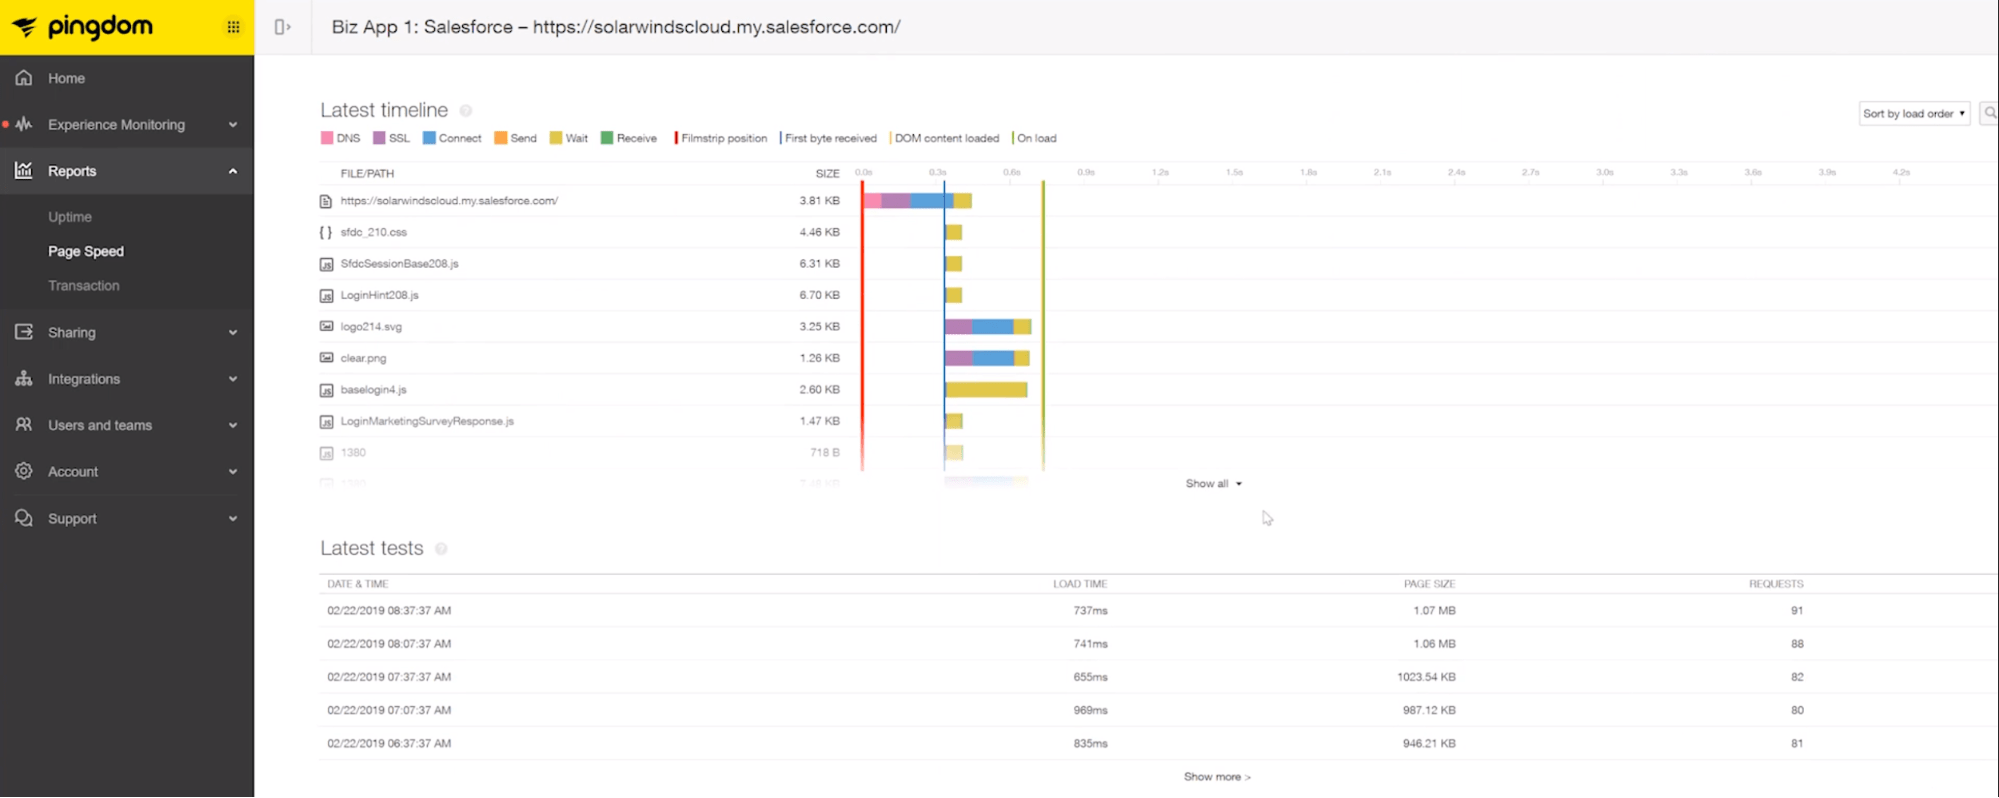
Pingdom (owned by SolarWinds) is an uptime monitoring service with a wide range of features, including SSL monitoring, uptime monitoring, and real-user monitoring, amongst many others. With a flexible alerting system, Pingdom will notify you when there’s any service interruption or degradation.
The uptime monitoring view will give you insight into how long it takes for a page or resource to load fully. If an error occurs, you’ll be able to use their incident reports manager to dig deep into the transaction to reach the root cause of the issue. The traceroute is very useful in this scenario.
Speaking of issues, Pingdom will alert you whenever something goes wrong. These alerts are customizable, allowing you to select who gets notified and after how many alerts you receive. This will make assigning the right person to the job a lot quicker. You can also schedule regular reports on your site’s health.
When it comes to performance reporting, the Page speed section is your go-to whenever you need detailed information on your website like load time, page size, number the request, and a Performance score, which will paint a simple picture of how your overall performance looks like. One of the most useful features here is the waterfall chart that displays all the assets in a timeline making it very easy to see where and what you need to optimize.
Pingdom focuses only on RUM and Synthetics but has no support for logs management which will inevitably leave you with understanding half the picture when debugging those pesky performance issues.
Pingdom comes with a 14-day trial period, and their pro plans start at $15/month for synthetic monitoring with 10 uptime monitors, 1 advanced monitor, and 50 SMS notifications, while their real user monitoring service is $15/ month for 100K page views.
Features:
- Simple pricing
- Real user monitoring tools
- SMS and email notifications
- Customizable alerts
Want to see how Sematext stacks up? Check out our page on Sematext vs Pingdom.
6. Raygun
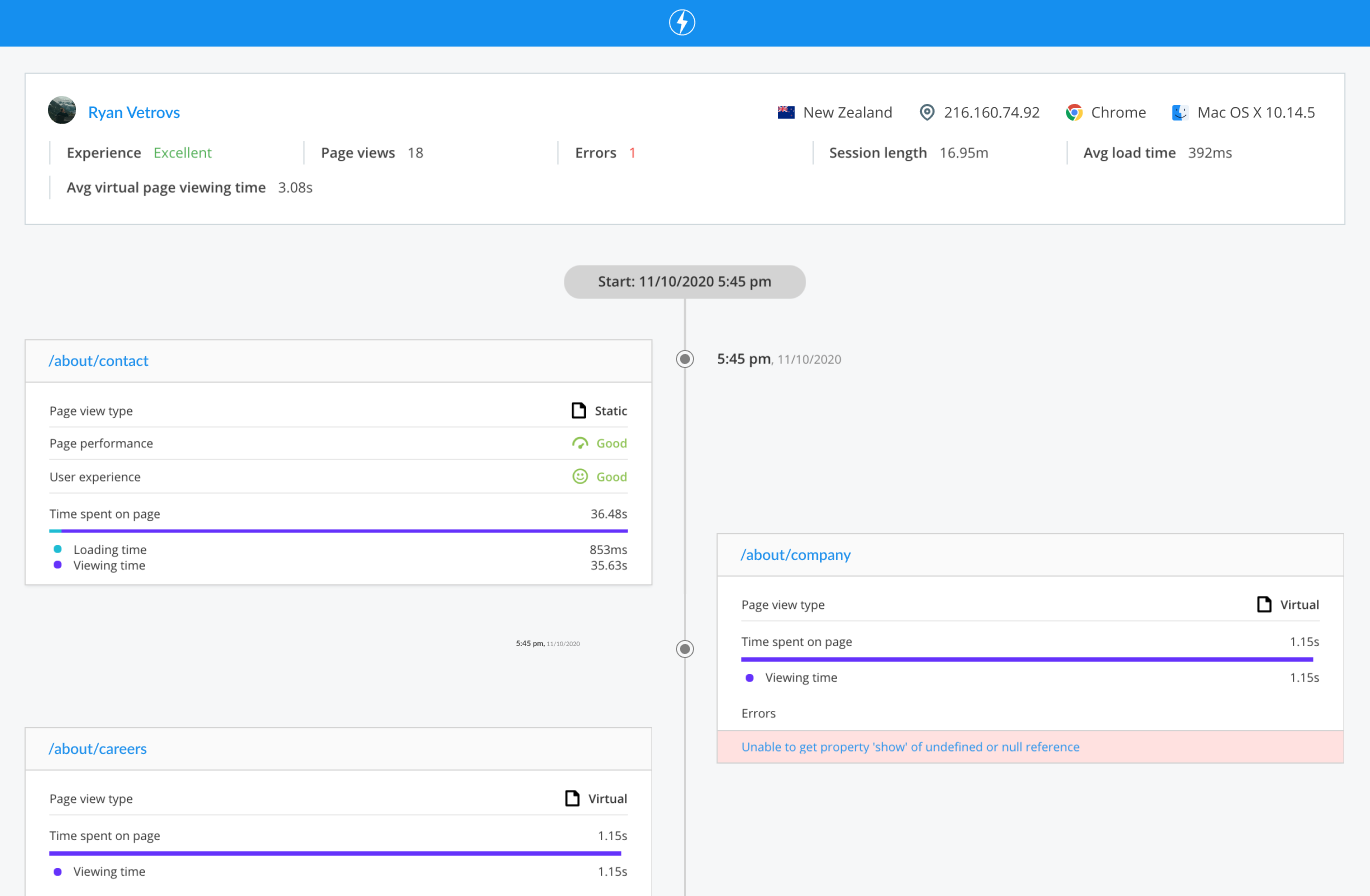
With Raygun, you can see and resolve your performance bottlenecks by discovering actionable data from your website. This will make it easy to diagnose poor experience and boost frontend performance.
If the goal is to solve performance issues with Raygun, then you better get used to their real user monitoring platform, as it will be your main tool to diagnose frontend issues. Their lightweight JavaScript SDK monitors all aspects of your website by gathering information like page speed, load times, the number of active sessions, and active users.
Furthermore, you can walk through individual user sessions in real time, trace their path to identify which page loads slowly or didn’t load at all. Every page load has a detailed resource waterfall that allows you to see a breakdown of every asset and how they affect frontend performance. You can then extrapolate the aspects causing the performance issues which will give you an idea of how to fix them.
Raygun doesn’t have a logs management solution but the Error view does provide details like the full stack trace, environment, browser, OS, host, and more.
Raygun has three packages, APM starting at $8/mo, which includes 10K traces, Real User Monitoring at $8 for 10K sessions, and Error Monitoring and Reporting at $4/mo. You can also test-drive all their features for 14 days using their free trial.
Features:
- Real user monitoring tools
- User-friendly application
- Simple to understand pricing
- 3rd Party integrations
7. SpeedCurve 
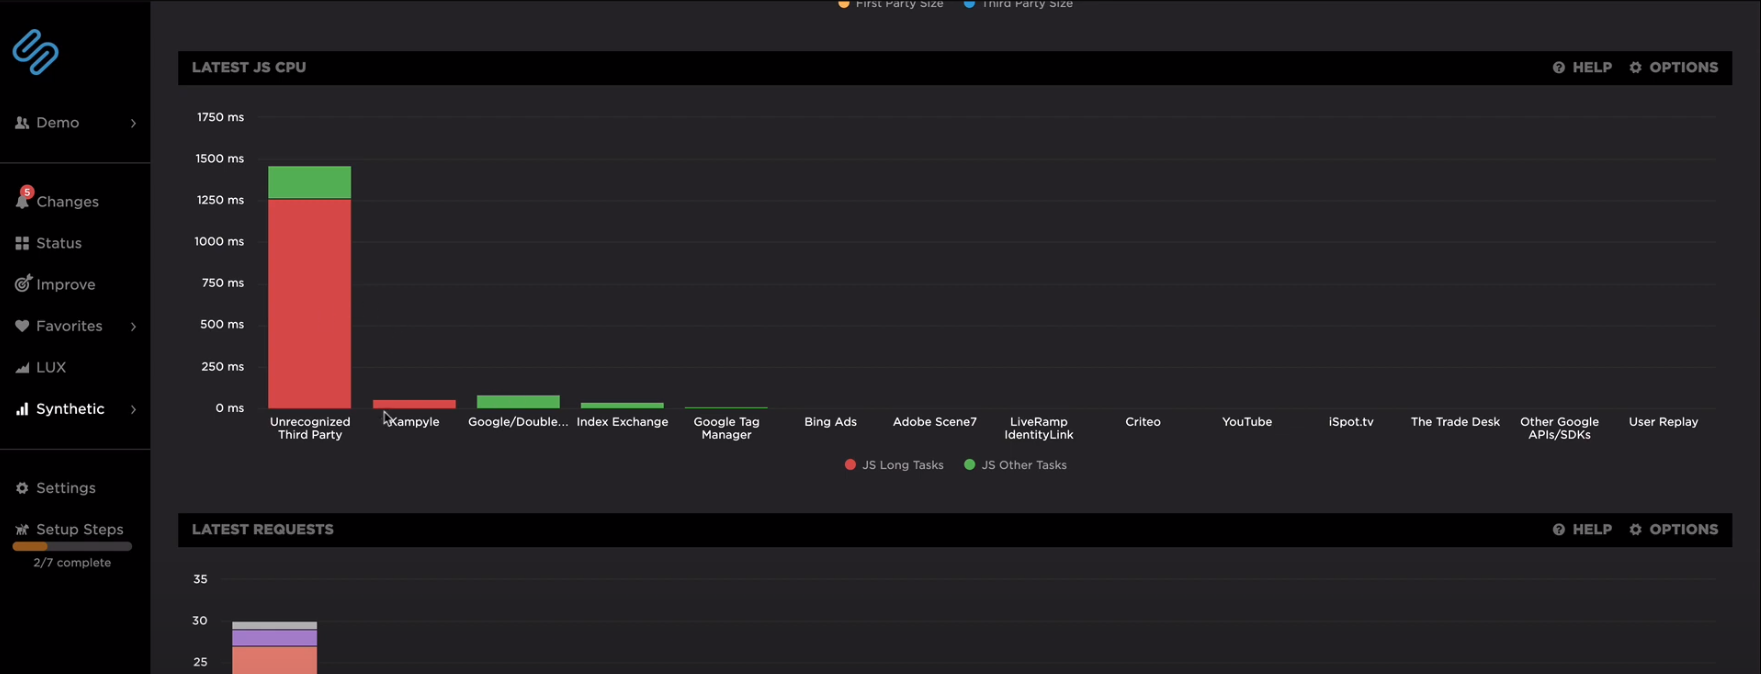
SpeedCurve captures data from real user interactions and benchmarks it against your competitors. This is a great way to stay ahead of the competition while making sure your users get the best possible experience while using your service.
Their real user monitoring tool, which they cleverly call LUX (which stands for Live User eXperience), gives you all the standard RUM metrics such as First Input Delay, Largest Contentful Paint, or Cumulative Layout Shift.
SpeedCurve allows you to set certain thresholds that they call budgets for all your metrics and then alert you if you exceed them. These alerts will go out via email or a webhook that can integrate with Slack, HipChat, Microsoft Teams, and many more.
Their synthetic monitoring tool compiles all your metrics into a single view where you can check out your performance indicators to understand your website’s intricacies further. The data is then broken down into seven other views that provide information on how the website loads in different browsers and devices, responsiveness, third party resources, JavaScript, and a breakdown of the loaded assets.
SpeedCurve also has a section powered by Lighthouse where your performance metrics are displayed and graded. Besides that, it provides recommendations on different actions you can take to improve your overall performance.
SpeedCurve has no support for logs or transactions monitoring and while you may be fine going without these in the beginning, you’ll probably end up getting a separate solution to help you track down the source of your issues and bugs.
Pricing is split into three main categories Small, Medium, and Large, with the main differences being the number of page views and synthetic checks done every month. They range from $143/month up to $2100. There’s also a Build your own plan that starts at $15/month plus a free trial that lets you test-drive all their features.
Features:
- Real user monitoring tools
- User-friendly UI
- Easy Setup
- Simple pricing
8. LogRocket
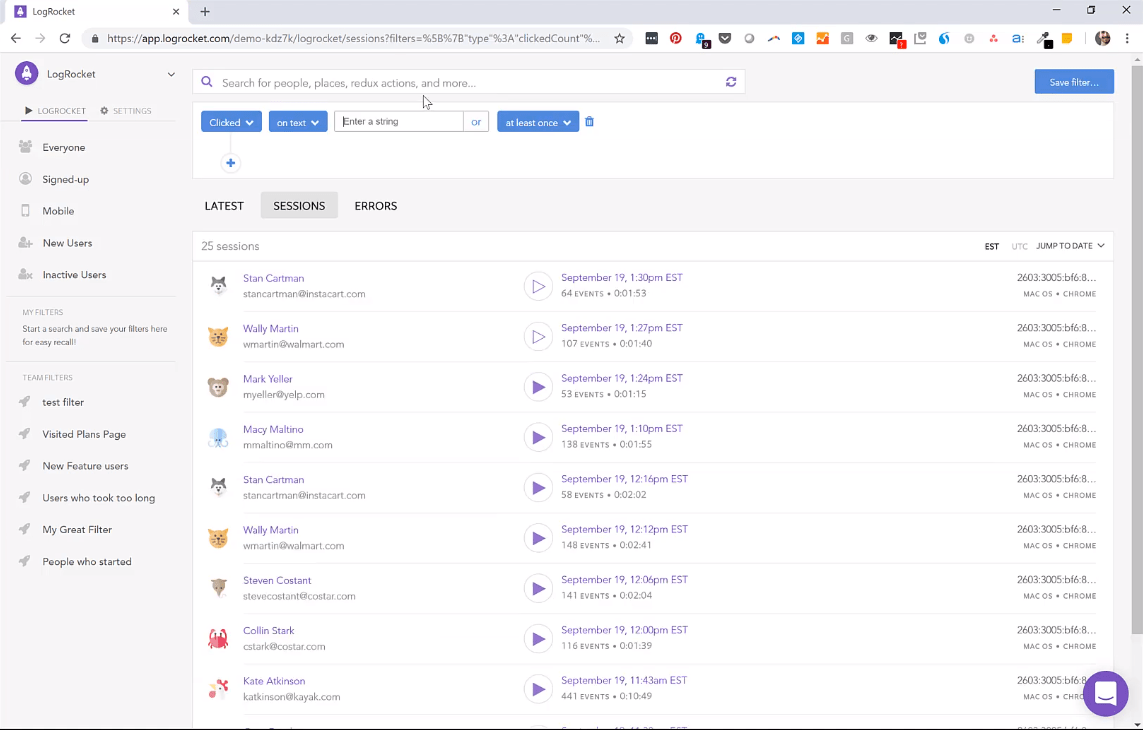
When you first pick it up, LogRocket can look quite different from the tools you’re used to, but that might not necessarily be a bad thing. It’s basically a real user monitoring tool that lets you record the user’s session and play it back so that you can figure out exactly what went wrong.
A developer mode lets you break down every resource that the user loaded. There’s also a console log that records what the user saw at the time of the incident which will help you see the issue without having to worry about replicating it yourself. If you’ve ever used the Chrome developer tools, you’ll feel right at home.
LogRocket has a basic alerting system that allows you to be notified via Slack or email whenever a new error appears and can be customized to be fired on particular errors or after a certain number of errors happen. While having a simple alerting system is great for starting out, the lack of control over the alerts you get, notification channels, etc, makes LogRocket take a backseat compared to the rest of the tools in the list.
On its own, LogRocket doesn’t have any support for logs or transactions but it does feature some third-party integrations with services that do provide these features.
LogRocket has a risk-free 14-day trial, a free tier with 30 days retention and 1000 sessions, and the Pro version starts at $99 with 10k sessions/month.
Features:
- Inspect logs, network activity, and Dom elements
- Intercom and Zendesk support
- Video playback of the incidents
How to Choose the Right Solution for You?
This is not an easy question to answer as it does not have a universal answer. There are, however, a few things that are worth taking into account when choosing the right tool for your use case:
- Ease of use is essential as you really want to avoid spending time reading the documentation when you could be actively improving your app.
- Third-party monitoring solutions and API monitoring are crucial to understanding what is slowing your website down.
- Multiple testing locations is always a great feature. This will give you a better understanding of how your website performs for different locations around the world. If you want to learn more about how location affects user experience and website performance, read our blog post about latency.
- Logs support is awesome if you have it. It will supercharge your performance monitoring by providing key intel that isn’t available otherwise. If you’re new to logs, we recommend going through our introductory log management guide.
- Third-party integrations with your favorite tools will make the tool easier to adopt
- Infrastructure monitoring tools will give you the complete picture when it comes to performance.
Conclusion
It’s important to acknowledge that performance is not a one-time thing that you check off a list when building your website or application. It takes work and time to get it right, and it’s an ongoing process. Monitoring your frontend performance will require special tooling to ensure your users are getting the best experience you can provide, 24×7.
Sematext Cloud has all the features that you need to monitor your frontend performance and more. Use the 14-day free trial to try it yourself!