Looking for ways to measure your users’ experience? You’ve come to the right place. In this article, we will dive into the Apdex score, one of the main indicators for user satisfaction. We will explain what it is, how it works, and the different ways you can calculate it.
Definition: What Is Apdex Score (Application Performance Index)?
Application Performance Index, or Apdex, is a measurement of your users’ level of satisfaction based on the response time of request(s) when interacting with your website or application.
How Does Apdex Work?
First off, the application or website owner is responsible for defining the target response time (based on their performance goals), known throughout this article as T (time) where all requests handled in T, or less, are “satisfactory” for your users.
How Is Apdex Score Calculated: The Formula
The Apdex method takes your defined response time threshold (T), the sum of satisfactory response times plus half of the tolerable response times divided by the total number of samples (requests sampled) in order to calculate a ratio from 0 to 1. (0 being unsatisfactory and 1 being satisfactory) See equation for Apdex below:

source: Application Performance Index – Apdex Technical Specification
Let’s break down each part of this equation:
- T = desired or defined latency of request (as defined by you)
- Satisfied count = number of samples (or requests) that received a response in T or less
- Tolerating count = number of samples (or requests) that are 4 times T or less
- Total samples = Total number of requests used to calculate your Apdex score
Thus, the resulting application performance index is a numerical measure of user satisfaction based on the response time to x requests of a website or application.
Example of an Apdex score
In this example, we will use a website or application that receives 400 requests in 3 minutes where our Apdex threshold or T is set to 0.5 seconds (500ms). Let’s say that 270 requests were handled within 500ms, which qualifies as “Satisfactory” range. Then, 70 requests were handled between 500ms and 2 seconds (2000 ms), which would be in the “Tolerable” range. Lastly, the 60 remaining requests were either not handled properly or took longer than 2 seconds, so they would fall in the “Frustrated” range. Thus giving us an Apdex score of 0.76: (270 + (70/2))/400 = 0.76.
What Is a Good Apdex Score?
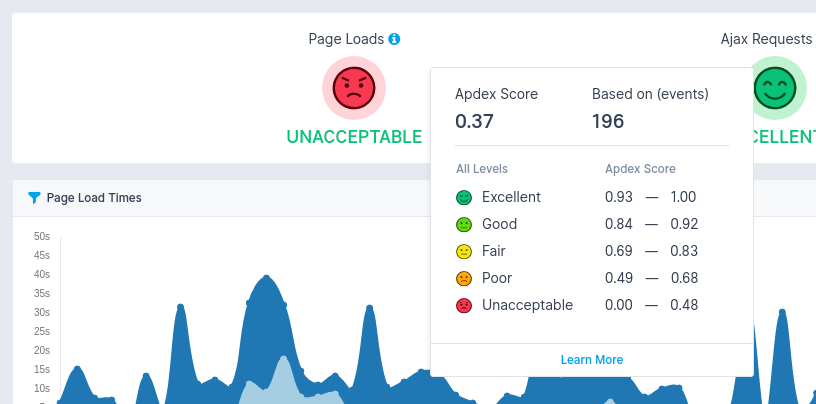
Apdex averages your score in a range from 0-1, indicating where the digital experience offered to your users falls in the “satisfaction” range. Here are some of the levels you may find your website or application to be scored at with Apdex:
- 1.00-0.94 = Excellent
- 0.93-0.85 = Good
- 0.84-0.70 = Fair
- 69 and 0.49 = Poor
- >0.49 = Bad
The average Apdex score is 0.85 so if you are anywhere near that range, you’re doing something right.
Sematext Experience Apdex score report
This Apdex score is also useful, for example, with transaction tracing as it provides insights into what requests or transactions are causing slow scripts on your page. So what comes next? After you define your Apdex levels, are you done? No! This is just one part of your overall Real User Monitoring strategy.
How to Improve Your Apdex Score?
Here are some ways to improve your Apdex Score:
- Minimize HTTP requests
- Remove third-party code that is not functioning correctly
- Test your releases before moving them to production to ensure maximum performance
Most importantly, invest in a comprehensive real user monitoring solution. To help you get started, we reviewed some of the best real user monitoring tools available today.
Why Monitoring Your Apdex Score Is NOT Enough?
Apdex is centered around one key performance metric, response time based on x number of samples, so it’s unrealistic to say that with this simple KPI you are truly monitoring your users’ digital experience. Let’s look at why.
Response time values don’t take into account the time on the page, engagements, clicks, conversion rates, etc. and also can be less accurate when working with user data that has different locations, browser types, connection types, etc. If you’re not new to application performance, and how it works, you should instantly acknowledge that all application or website requests perform at very different levels. For example, your “Search for Hotels” request-response time will be much higher than your “View Hotel” response time. These two clearly different requests should not be constrained to the same time-based threshold.
Thus the need for a comprehensive RUM solution.
Real user monitoring helps organizations of all sizes improve their customers’ digital experiences by making it easy to spot bottlenecks, slow interactions, and errors in your UI, before your users do. Sematext Experience offers support for monitoring website and web applications. This includes:
- Page load events including support for single page applications (SPAs)
- AJAX requests
- Alerts based on Apdex score and/or page load times
- URL grouping
- Sessionization
- Filter data by release version, browser, version, geo-location, etc.
- Location-based heatmap
In addition to load times, Sematext Experience also records the loaded resources (images, fonts, stylesheets, javascript files) and the associated loading times. In short, everything you need to know to measure and improve website performance.
Modern-day user experience optimization is much more complex than just an Apdex score and requires a monitoring solution that will provide you with actionable insights.
For example, Digital Advertising is now almost entirely being delivered by third-party code which has a huge (and direct) impact on your website’s or application’s user experience (UX). However, Apdex simply can’t accurately attribute metrics to your third-party tags, making it kind of a useless metric when measured alone, and has little to no benefit for your software-based or digital business.
