All the applications that you’re trying to execute require memory. It doesn’t matter if the application was developed using assembly language. Or if you used a low-level programming language like C or a language compiled to a bytecode like Java. Running the application requires memory for the code itself, the variables, and the data that the code processes. Depending on your usage, the memory requirements will vary. Some programs will require very little memory – for example, a simple app designed to process small text files; others will require gigabytes of memory because of the amount of data they process in memory.
In Java, at least initially, you can forget about the memory. You create objects, use them and leave them alone. Eventually, the Java garbage collector (GC) will free the memory occupied by unused objects and release the used memory. However, there is always a limited amount of data you can keep in memory at the same time – the size of the heap.
The heap is the place where the Java Virtual Machine keeps the data needed by the application. The heap is not unlimited – you control it during application start and you can’t keep more objects in memory than it allows. If the heap is full and you create that one more object you may receive an OutOfMemory error.
In this blog post, I’ll tell you what Java OutOfMemory errors are, what causes them and how to deal with them. Or, if you’d like, check out the short video below to get more familiar with Sematext Logs and how they can help you.
What Is OutOfMemoryError in Java: Causes & Fixes
A java.lang.OutOfMemoryError means that something is wrong in the application – to be precise there was an issue with a part of application memory. To be more specific than that, we need to dive into the reasons that the Java Virtual Machine can go out of memory, and each has a different cause.
Java Heap Space
Java Heap space is one of the most common errors when it comes to memory handling in the Java Virtual Machine world. This error means that you tried to keep too much data on the heap of the JVM process and there is not enough memory to create new objects, and that the garbage collector can’t collect enough garbage. This can happen for various reasons – for example, you may try to load files that are too large into the application memory or you keep the references to the objects even though you don’t need the data.
Basically, the java.lang.OutOfMemoryError Java heap space tells that the heap of your application is not large enough or you are doing something wrong, or you have an old, good Java memory leak.
Here’s an example that illustrates the Java heap space problem:
public class JavaHeapSpace {
  public static void main(String[] args) throws Exception {
    String[] array = new String[100000 * 100000];
  }
}
The code tries to create an array of String objects that is quite large. And that’s it. With the default settings for the memory size, you should see the following result when executing the above code:
Exception in thread "main" java.lang.OutOfMemoryError: Java heap space
  at memory.JavaHeapSpace.main(JavaHeapSpace.java:5)
And the result is simple – there is just not enough memory on the heap to assign the array, and thus the JVM throws an error informing us about that.
How to fix it: In some cases, to mitigate the problem, it is enough to increase the maximum heap size by adding the -Xmx to your JVM application startup settings and setting it to a larger value. For example, to increase the maximum heap size to 8GB, you would add the -Xmx8g parameter to your JVM application start parameters. However, if you have a memory leak you will eventually see the error appearing again. This means that you need to go through the application code and look for places where potential memory issues can happen. Tools like Java profilers and the good, old heap dump will help you with that.
GC Overhead Limit
The GC Overhead Limit is exactly what its name suggests – a problem with the Java Virtual Machine garbage collector not being able to reclaim memory. You will see the java.lang.OutOfMemoryError: GC overhead limit exceeded if the Java Virtual Machine spends more than 98% of its time in the garbage collection, for 5 consecutive garbage collections and can reclaim less than 2% of the heap.
When using older Java versions that were using the older implementations of the garbage collection (like Java 8), you can easily simulate the GC Overhead exception by running a code similar to the following:
public class GCOverhead {
  public static void main(String[] args) throws Exception {
    Map<Long, Long> map = new HashMap<>();
    for (long i = 0l; i < Long.MAX_VALUE; i++) {
      map.put(i, i);
    }
  }
}
When run with a small heap, like 25MB you would get an exception like this:
Exception in thread "main" java.lang.OutOfMemoryError: GC overhead limit exceeded
        at java.base/java.lang.Long.valueOf(Long.java:1211)
        at memory.GCOverhead.main(GCOverhead.java:10)
That means that the heap is almost full and the garbage collector spent at least 5 consecutive garbage collections removing less than 2% of the assigned objects.
How to fix it: The possible solution to such an error is increasing the heap by adding the -Xmx to your JVM application startup settings and setting it to a larger value than you are currently using.
Array Size Limits
One of the errors that you may encounter is the java.lang.OutOfMemoryError: Requested array size exceeds VM limit, which points out that the size of the array that you’re trying to keep in memory is larger than the Integer.MAX_INT or that you’re trying to have an array larger than your heap size.
How to fix it: If your array is larger than your heap size, you can try increasing the heap size. If you are trying to put more than the 2^31-1 entries into a single array, you will need to modify your code to avoid such situations.
Number of Thread Issues
The operating system has limits when it comes to the number of threads you can run inside a single application. When you see a java.lang.OutOfMemoryError: unable to create native thread error being thrown by the Java Virtual Machine running your code, you can be sure that you hit the limit or your operating system runs out of resources to create a new thread. Basically, a new thread was not created on the operating system level and the error happened in the Java Native Interface or in the native method itself.
To illustrate the issue with the creation of threads let’s create a code that continuously creates threads and puts them to sleep. For example like this:
public class ThreadsLimits {
  public static void main(String[] args) throws Exception {
    while (true) {
      new Thread(
          new Runnable() {
            @Override
            public void run() {
              try {
                Thread.sleep(1000 * 60 * 60 * 24);
              } catch (Exception ex) {}
            }
          }
      ).start();
    }
  }
}
Right after you run the above code, you can expect an exception thrown:
[0.420s][warning][os,thread] Failed to start thread - pthread_create failed (EAGAIN) for attributes: stacksize: 1024k, guardsize: 4k, detached.
Exception in thread "main" java.lang.OutOfMemoryError: unable to create native thread: possibly out of memory or process/resource limits reached
  at java.base/java.lang.Thread.start0(Native Method)
  at java.base/java.lang.Thread.start(Thread.java:802)
  at memory.ThreadsLimits.main(ThreadsLimits.java:15)
We can clearly see that our Java code exhausted the operating system limits and couldn’t create more threads.
To diagnose the issue, we suggest referring to the appropriate section of the Java documentation. For example, Java 17 documentation includes a section called Troubleshooting Tools Based on the Operating System, which mentions tools that can help you find the problem.
PermGen Issues
The PermGen or Permanent Generation is a special place in the Java heap that the Java Virtual Machine uses to keep track of all the loaded classes metadata, static methods, references to static objects, and primitive variables. The PermGen was removed with the release of Java 8, so at this point, you’ll probably never hit the issue with it.
The problem with PermGen was its limited default size – 64MB in 32-bit Java Virtual Machine version and up to 82MB in the 64-bit version of the JVM. This was problematic because if your application contained a lot of classes, static methods, and references to static objects, you could easily get into issues with too small PermGen space.
How to fix it: If you ever encounter the java.lang.OutOfMemoryError: PermGen space error you can start by increasing the size of the PermGen space by including the -XX:PermSize and -XX:MaxPermSize JVM parameters.
Metaspace Issues
With the removal of the PermGen space, the classes metadata now lives in the native space. The space that keeps the classes metadata is now called Metaspace and is part of the Java Virtual Machine heap. However, the region is still limited and can be exhausted if you have a lot of classes.
How to fix it: The problems with the Metaspace region are signaled by the Java Virtual Machine when a java.lang.OutOfMemoryError: Metaspace error is thrown. To mitigate the issue, you can increase the size of the Metaspace by adding the -XX:MaxMetaspaceSize flag to startup parameters of your Java application. For example, to set the Metaspace region size to 128M, you would add the following parameter: -XX:MaxMetaspaceSize=128m.
Out of swap
Your operating system uses the swap space as the secondary memory to handle the memory management scheme’s paging process. When the native memory–both the RAM and the swap–is close to exhaustion, the Java Virtual Machine may not have enough space to create new objects. This may happen for various reasons – your system may be overloaded, other applications may be heavy memory users and are exhausting the resources. In this case the JVM will throw the java.lang.OutOfMemoryError: Out of swap space error, which means that the reason is a problem on the operating system side.
How to fix it: The exact exception stack is usually helpful for mitigatin the error, as it will include the amount of memory that the JVM tried to allocate and the code which did that. When this error occurs, you can expect your Java Virtual Machine to create a file with a detailed description of what happened. You may also want to check your operating system swap settings and increase it if that is too low. At the same time, you need to verify if there are other heavy memory consumers running on the same machine as your application.
How to Catch java.lang.OutOfMemoryError Exceptions
Java has the option to catch exceptions and handle them gracefully. For example, you can catch the FileNotFoundException that can be thrown when trying to work with a file that doesn’t exist. The same can be done with the OutOfMemoryError – you can catch it, but it doesn’t make much sense, at least in most cases. As the developers, we usually can’t do much about the lack of memory in our application. But maybe your specific use-case is such that you would like to do that.
To catch the OutOfMemoryError you just need to surround the code that you expect to cause memory issues with the try-catch block, just like this:
public class JavaHeapSpace {
  public static void main(String[] args) throws Exception {
    try {
      String[] array = new String[100000 * 100000];
    } catch (OutOfMemoryError oom) {
      System.out.println("OutOfMemory Error appeared");
    }
  }
}
The execution of the above code, instead of resulting in the OutOfMemoryError will result in printing the following:
OutOfMemory Error appeared
In such a case, you can try recovering from that error, but that is highly use-case dependent. The best solution is to analyze the places where you’re trying to catch the OutOfMemoryError. Definitely avoid catching the mentioned error in the main method where you just start the whole execution. If you don’t know everything about exception handling in Java read our blog post to learn more about how to deal with OutOfMemoryError and other types of Java errors.
Monitor and Analyze Java OutOfMemoryError with Sematext
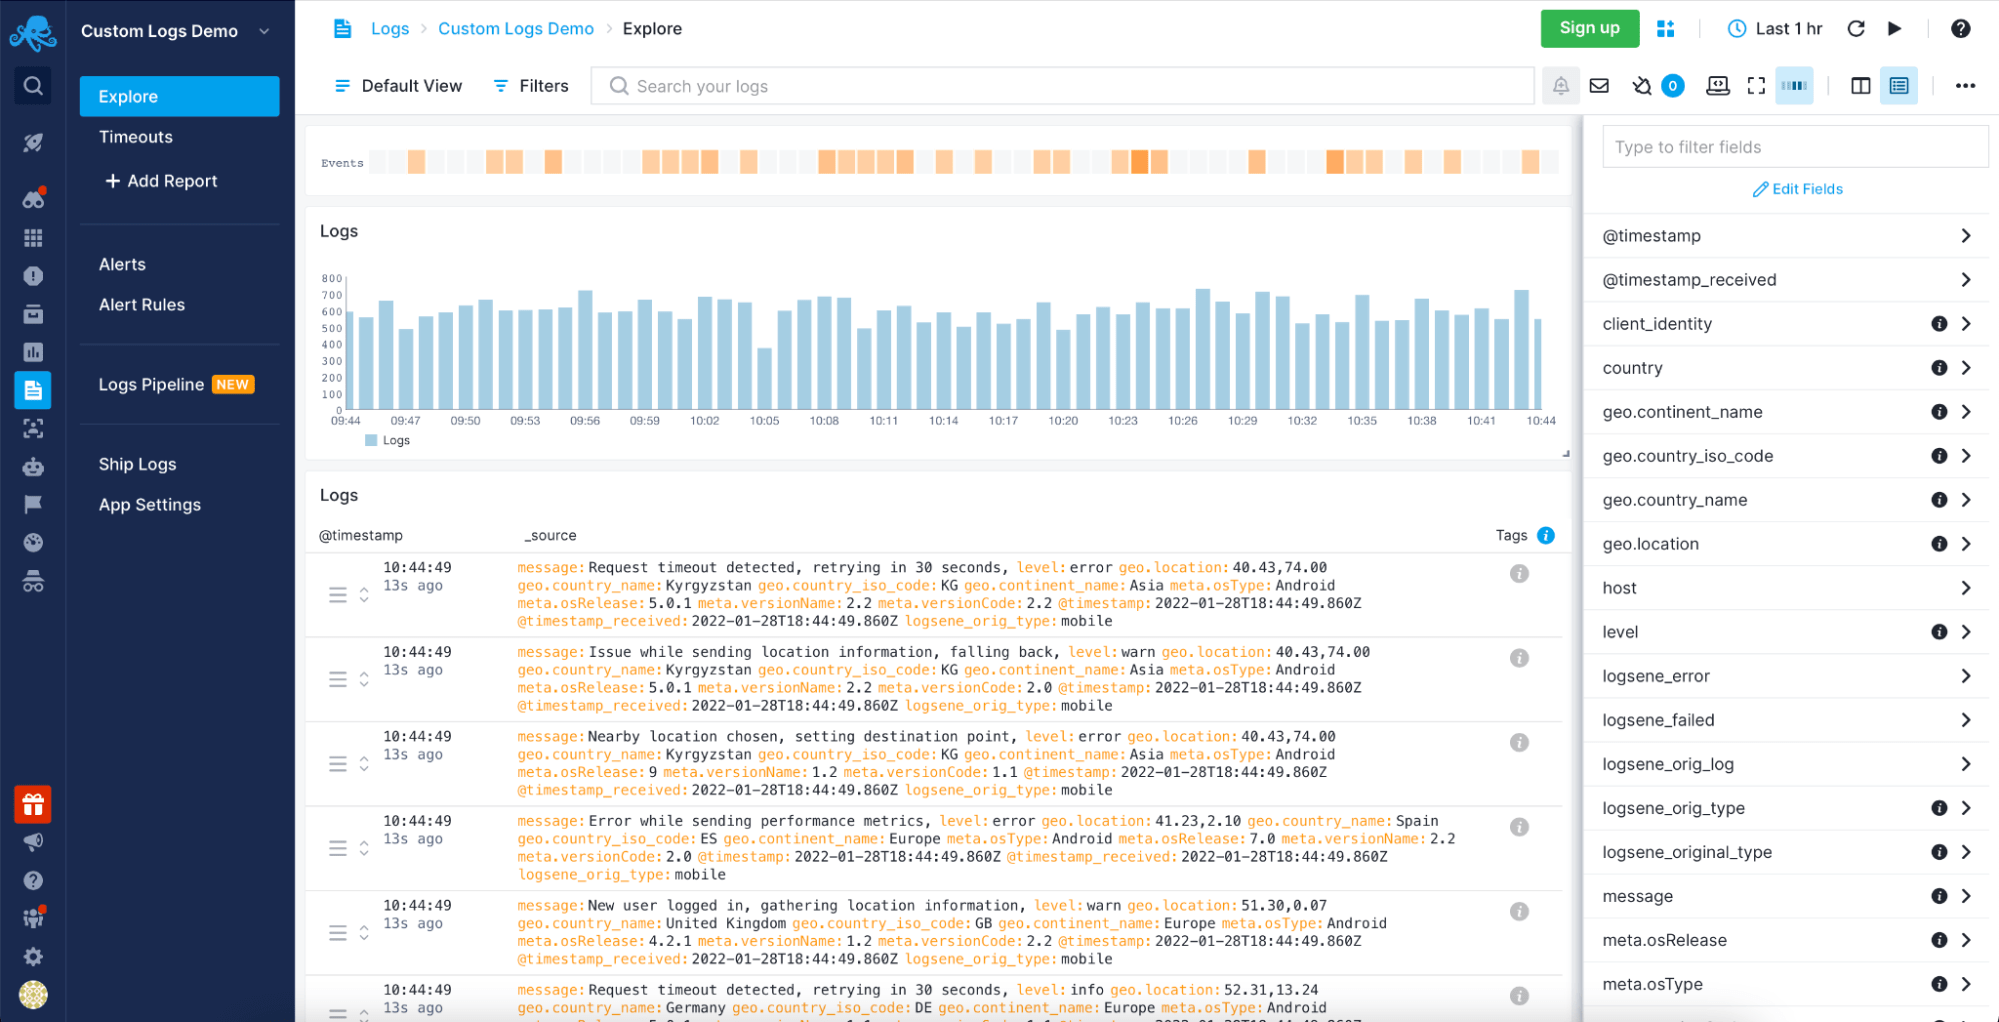
To ensure a healthy environment for your business process you need to be sure you will not miss any of the errors that can be caused by memory issues when running your Java applications. This means that you need to pay close attention to the logs produced by your Java applications and set up alerting on the relevant events – the OutOfMemoryError ones. You can achieve all of this by using Sematext Logs – an intelligent and easy to use logs centralization solution allowing you to get all the needed information in one place, create alerts and be proactive when dealing with memory issues.
You can read more about Sematext Logs and how it compares with similar solutions in our blog posts about the best log management software, log analysis tools, and cloud logging services available today.
Conclusion
Each memory-related error in Java is different and the approach that we need to take to fix it is different. The first and the most important thing is understanding. To know what needs to be fixed, we need to understand what kind of error happened, when it happened, and finally, why it happened. This information is crucial to take proper reaction and fix the underlying issue that is the root cause of the error.
That is where log management tools, like the Sematext Logs come into play. Having a place where you can see all your exceptions and analyze them is priceless. Sematext Logs is a part of Sematext Cloud, an all-in-one observability solution with Java monitoring integration and JVM Garbage Collector logging capabilities. All of that combined gives you a single platform that allows you to correlate all the necessary metrics. This provides you with a full view of the problem and helps you get to its root cause fast and efficiently. There’s a 14-day free trial available for you to try its features, so give it a try!