Container Monitoring
Scalable and native container monitoring tools. Overcome challenges and get in-depth visibility into the health and performance of your entire distributed infrastructure.
Native & Lightweight Container Monitoring Agent
Sematext Agent runs as a lightweight container and collects all host and container metrics.
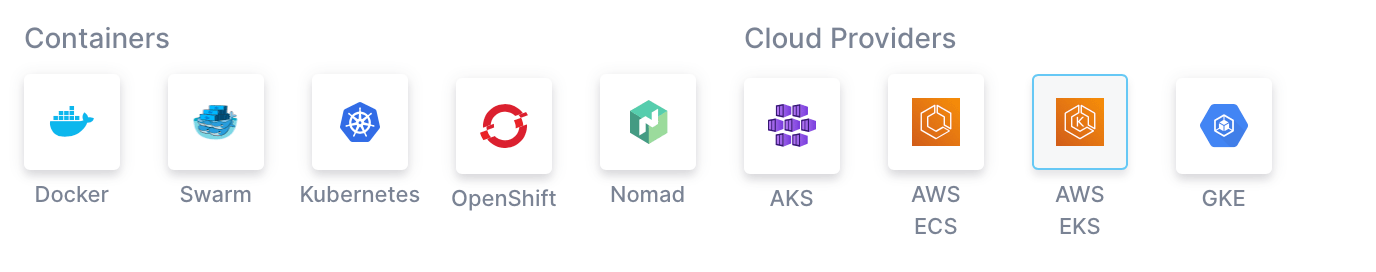
- Runs as DaemonSet on Kubernetes, Docker Swarm service, with Rancher, Nomad, Portainer, Mesos or DC/OS, as well as a simple “docker run…” command
- Collect host and container metrics, logs, and events
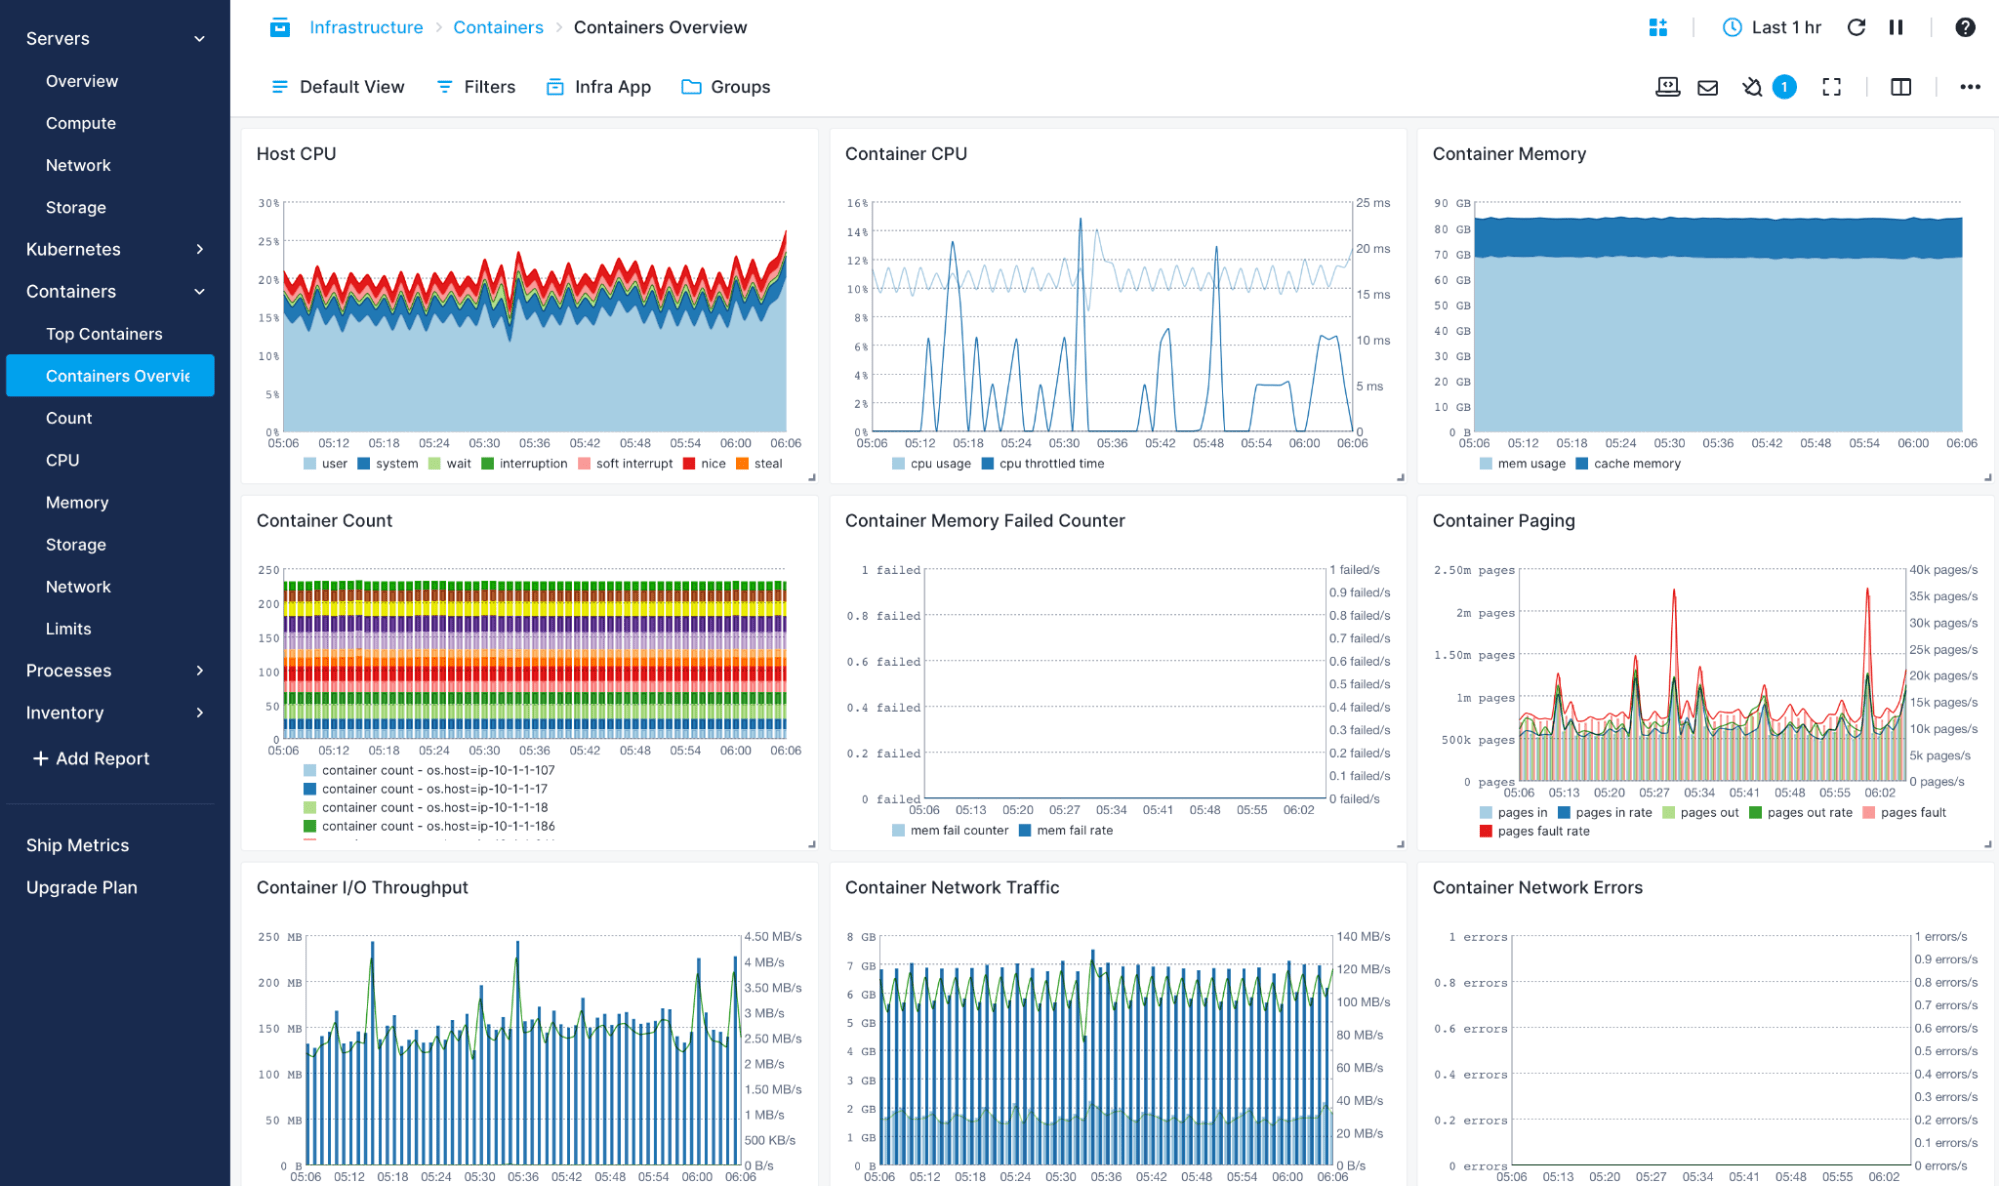
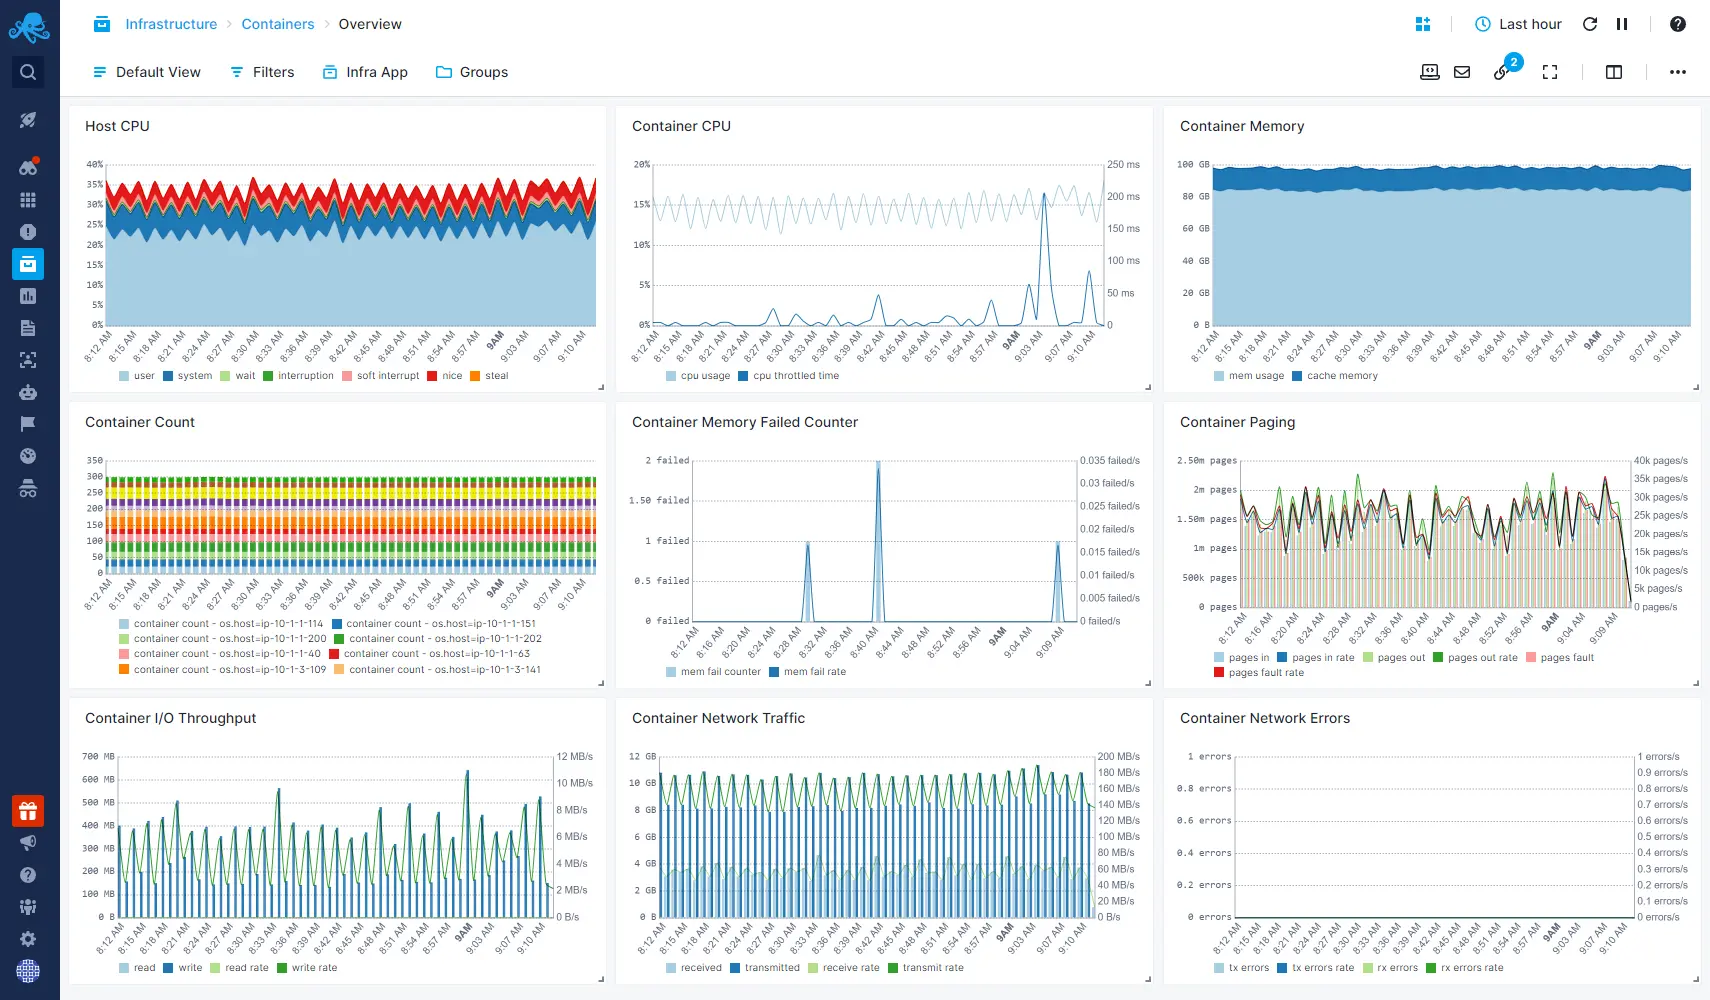
- Get monitoring dashboards out of the box with host and container CPU, memory, swap, memory failed counters, network errors, disk IO, network traffic, and much more
- Get container monitoring & alerting with pre-built dashboards and alert rules
In-Container Service Auto-Discovery
Sematext automatically identifies and monitors containers to continuously track your dynamic environment.
- Applications running in containers are discovered automatically
- Container monitoring agents start automatically upon application discovery
- Configurable agent templates for custom settings

Faster Troubleshooting with Real-Time Container Data
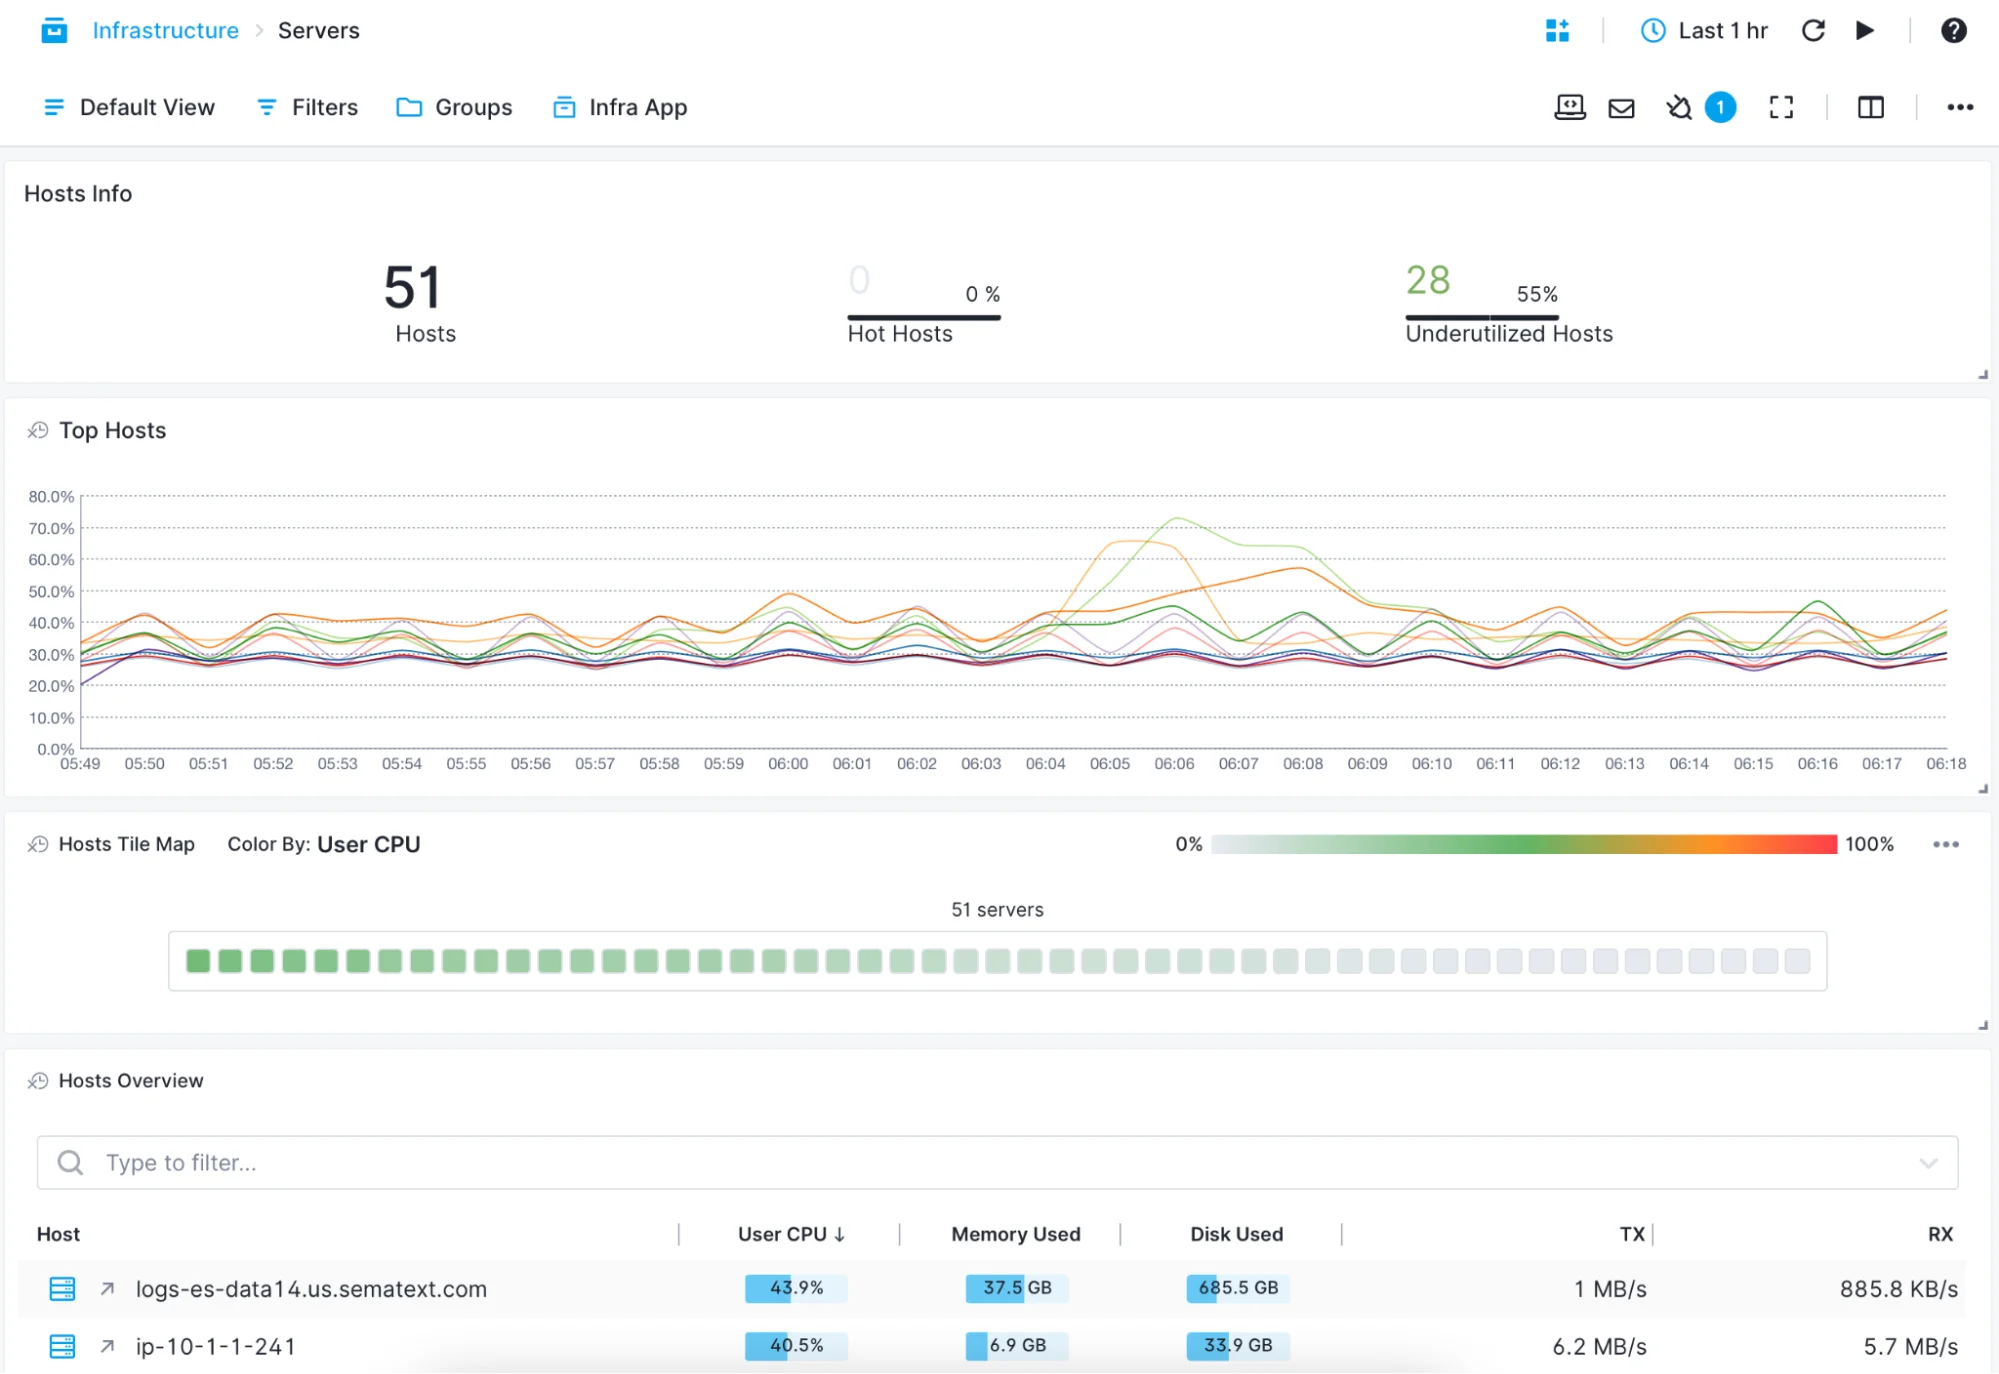
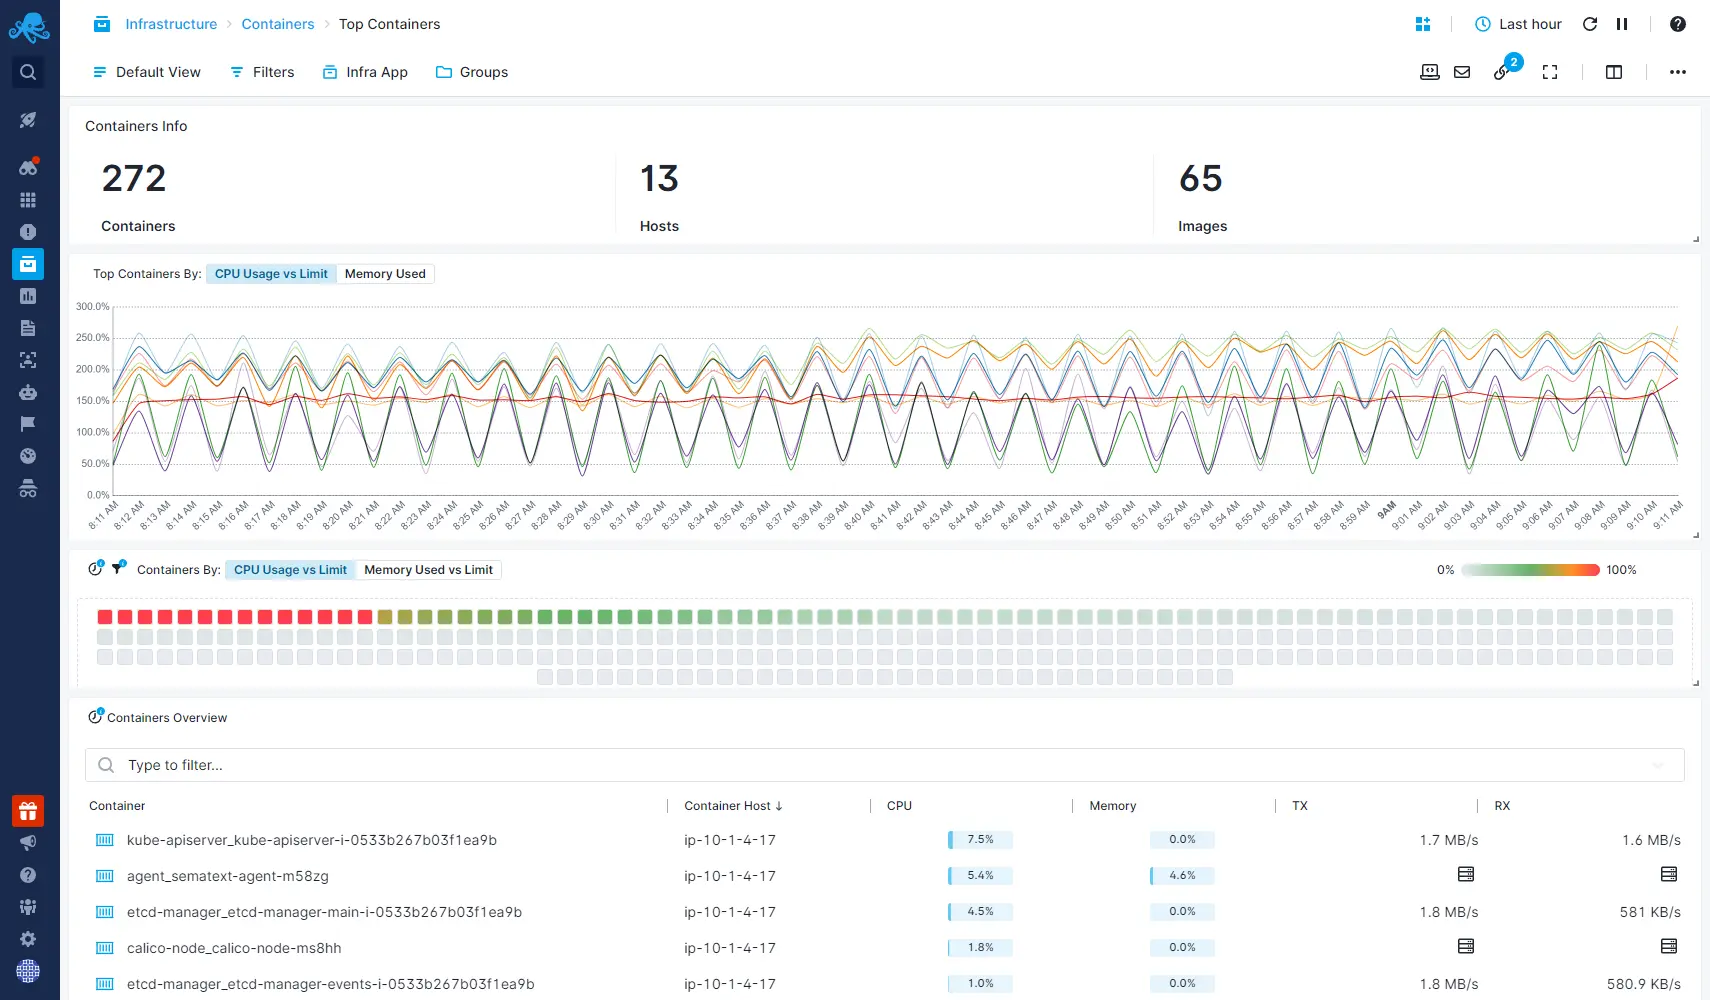
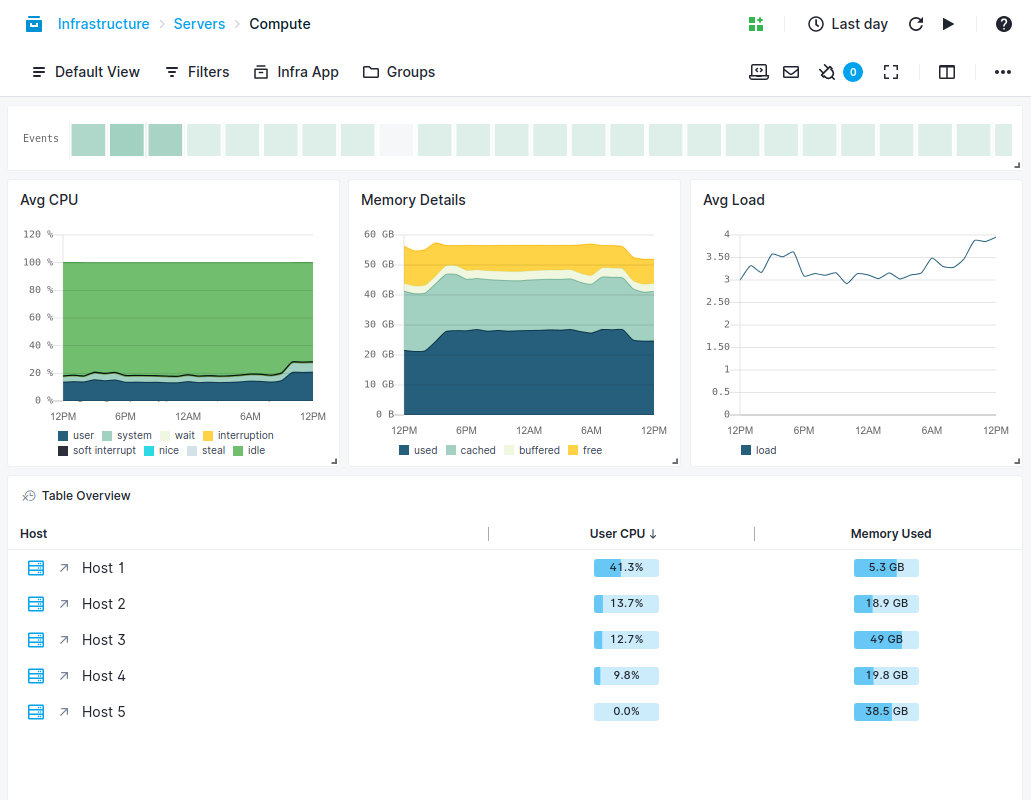
Whether you’re deploying containers manually or through an orchestration tool, you can use Sematext’s container monitoring solutions to have a real-time overview: servers’ compute to hot containers and top processes.
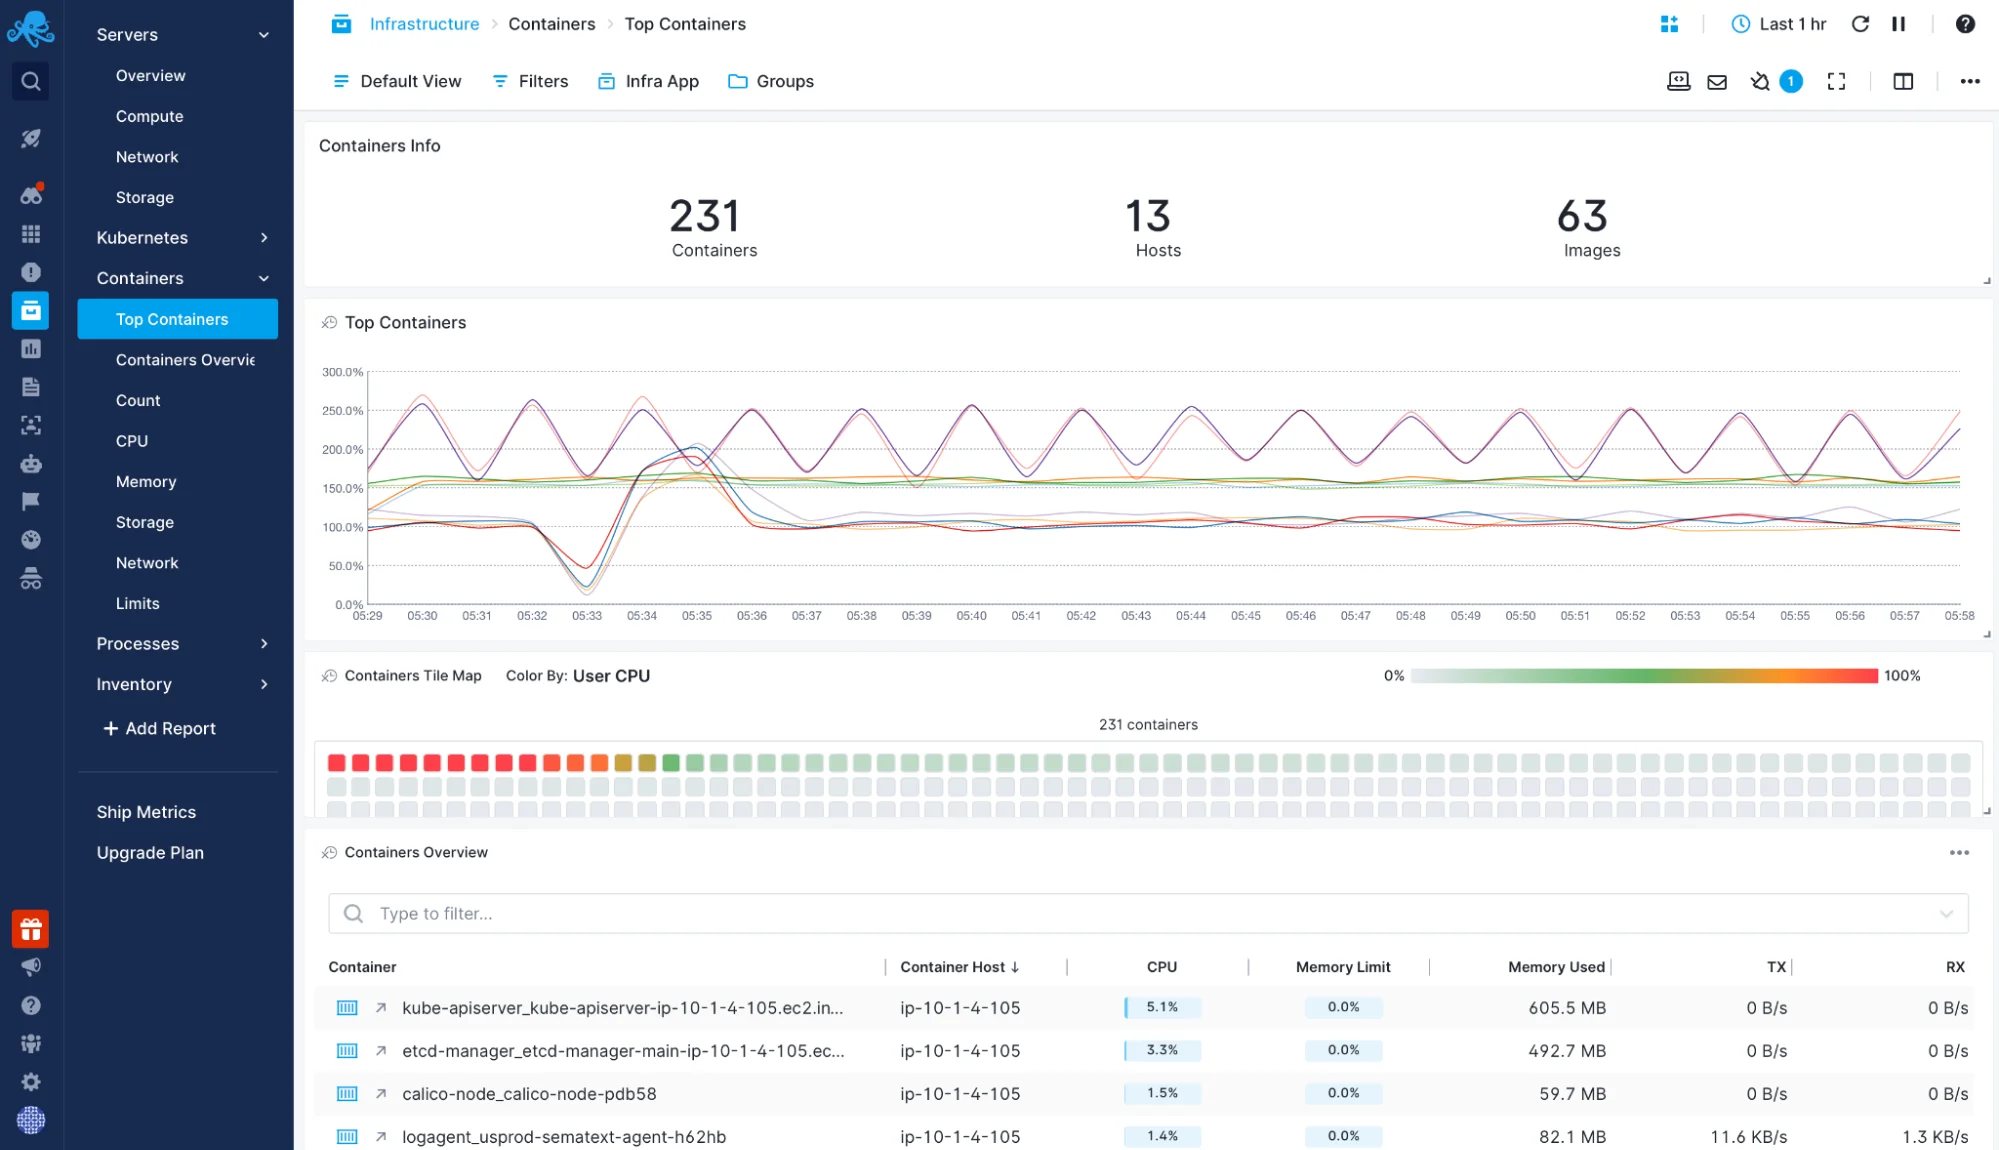
- Use the Top Containers view to see which containers are hot
- Use the Processes or Servers views to zoom in or out of the overview
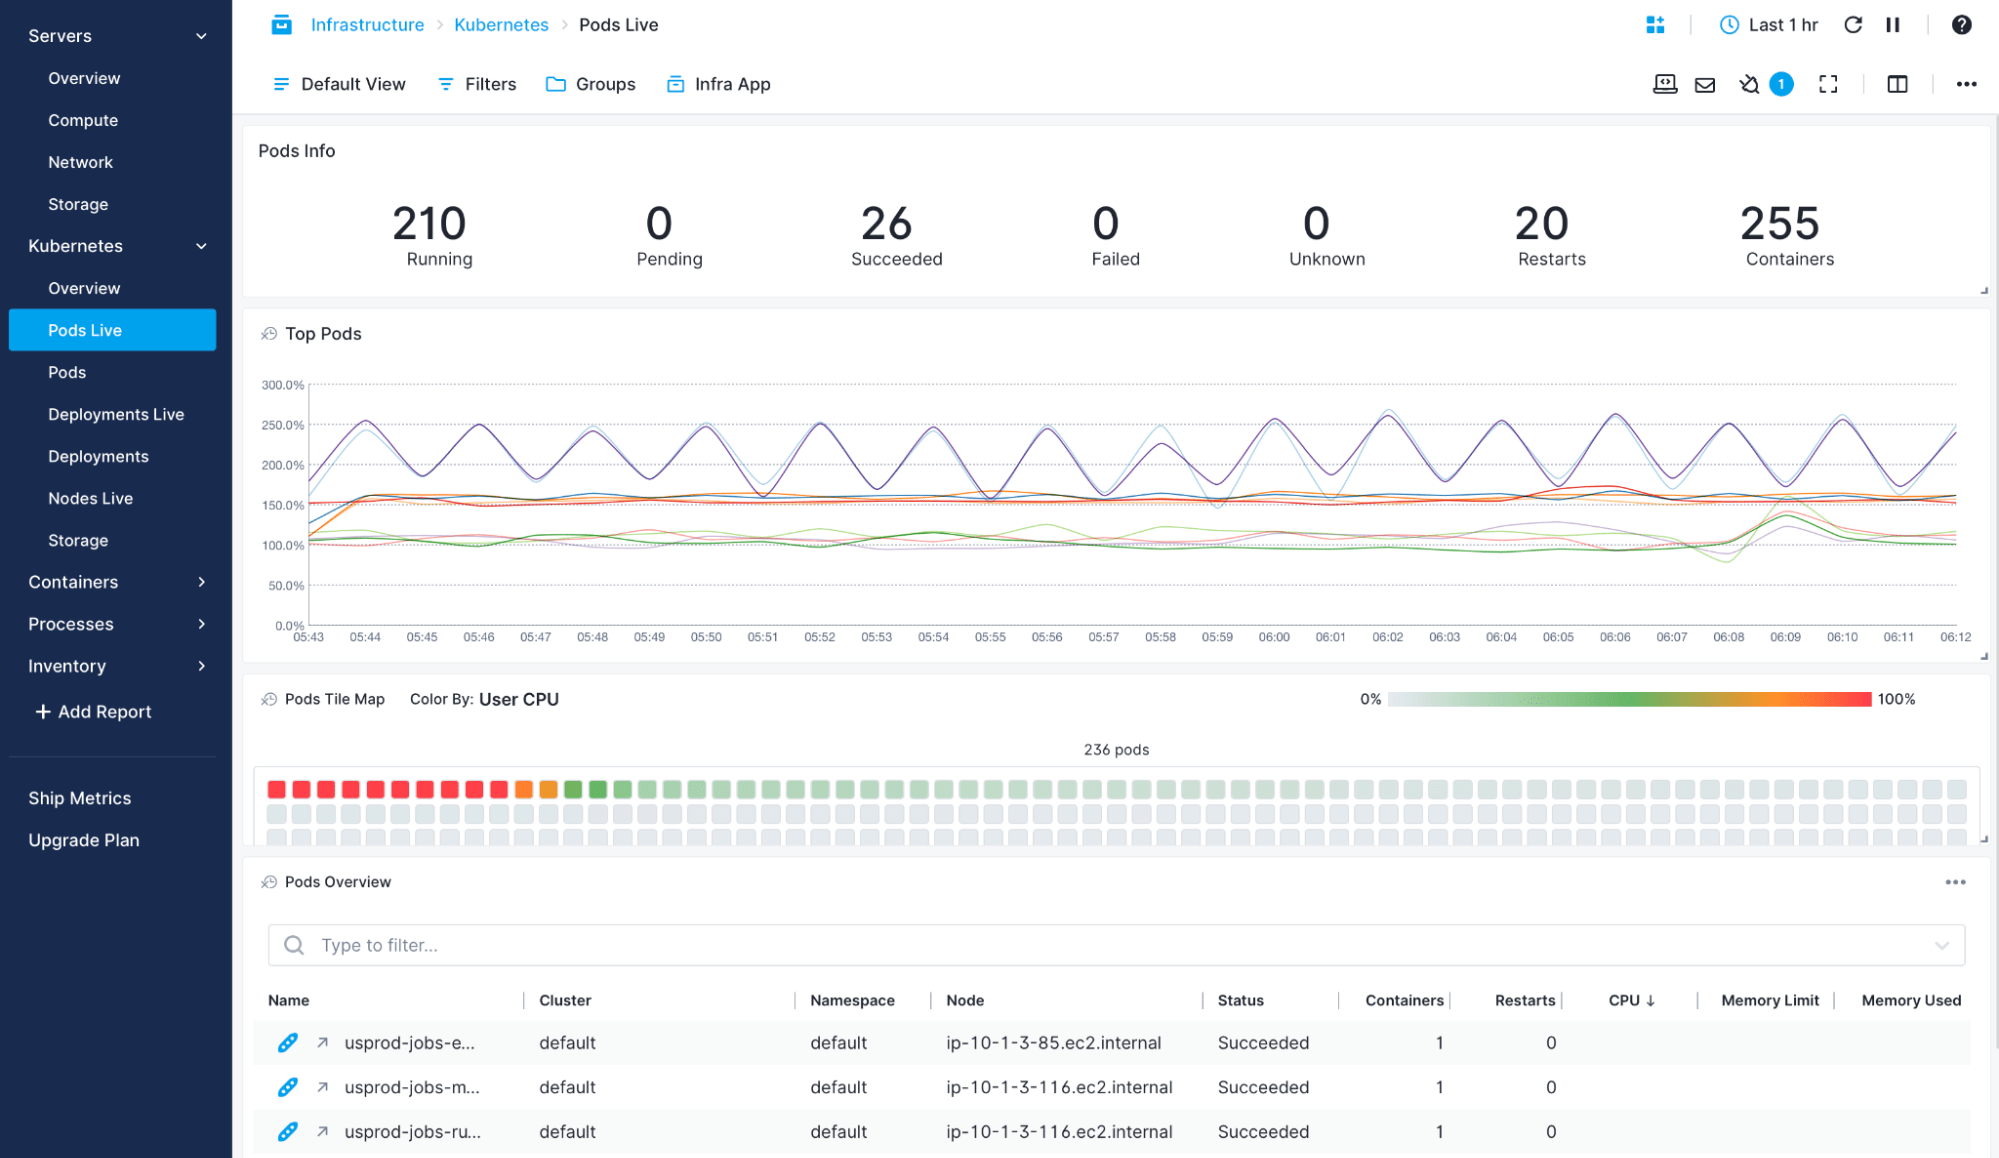
- Get real-time metrics from Kubernetes: number of replicas, pod restarts, etc.
Unified Solution for Your Containerized Environment
Sematext allows you to correlate and monitor container metrics, logs, and traces from across your distributed systems in a single monitoring dashboard.
- Automatically collect logs and label them by container labels, like name or image
- Configurable, built-in log parsing ensures logs are nicely structured, easily searchable for troubleshooting, but also ready for analytical queries, charts, and dashboards for your CTO and business
- Add metrics and logs to the same dashboard and filter them using the same criteria
- Set up alerts on both metrics and logs
Supported Technologies
Docker Container Monitoring
From Docker Desktop to Docker Swarm, you can use Sematext to monitor container performance and availability.
- Easily set up Sematext container monitoring agent via docker run or docker compose
- Get host, container, and service metrics via service autodiscovery
- Centralize all the logs that you’d normally get via docker logs out of the box
Kubernetes Monitoring
Sematext’s container monitoring solution allows you to explore both metrics and logs from your Kubernetes clusters. Get out-of-the-box dashboards to check on your pods, nodes, deployments, storage, and more.
- Install as Helm chart or create a sematext-agent.yml file with the DaemonSet definition and your Sematext Cloud app tokens. Start monitoring Kubernetes metrics, logs, and events with a simple kubectl create -f sematext-agent.yml
- Get logs parsed, structured, and tagged with namespace, pod, container, image name, and UID
- Filter metrics and logs by host, container, image, pod, or labels
Rancher Monitoring
Rancher makes Kubernetes easier, but also deploying Sematext Agent easier – through the Rancher Catalog. Once metrics and logs get in, you can explore them through the same dashboards you’d use for vanilla Kubernetes.
- Create a sematext-agent.yml DaemonSet definition with your Sematext Cloud app tokens and start with kubectl create -f sematext-agent.yml.
- Visual configuration via Rancher Catalog template, just search for “Sematext” to find us
- Use the predefined Kubernetes dashboards to explore both metrics and logs
Docker Swarm Monitoring
Monitoring Docker containers is even easier in Swarm mode: Sematext Agent will run as a service. Once set up, you get all your container metrics and logs under the same roof.
- Automatic agent deployment to all Swarm nodes with a single command
- Enrichment of logs with Swarm metadata like service name, service id, service instance, etc.
- Automatically centralize logs and metrics from new Docker Engines