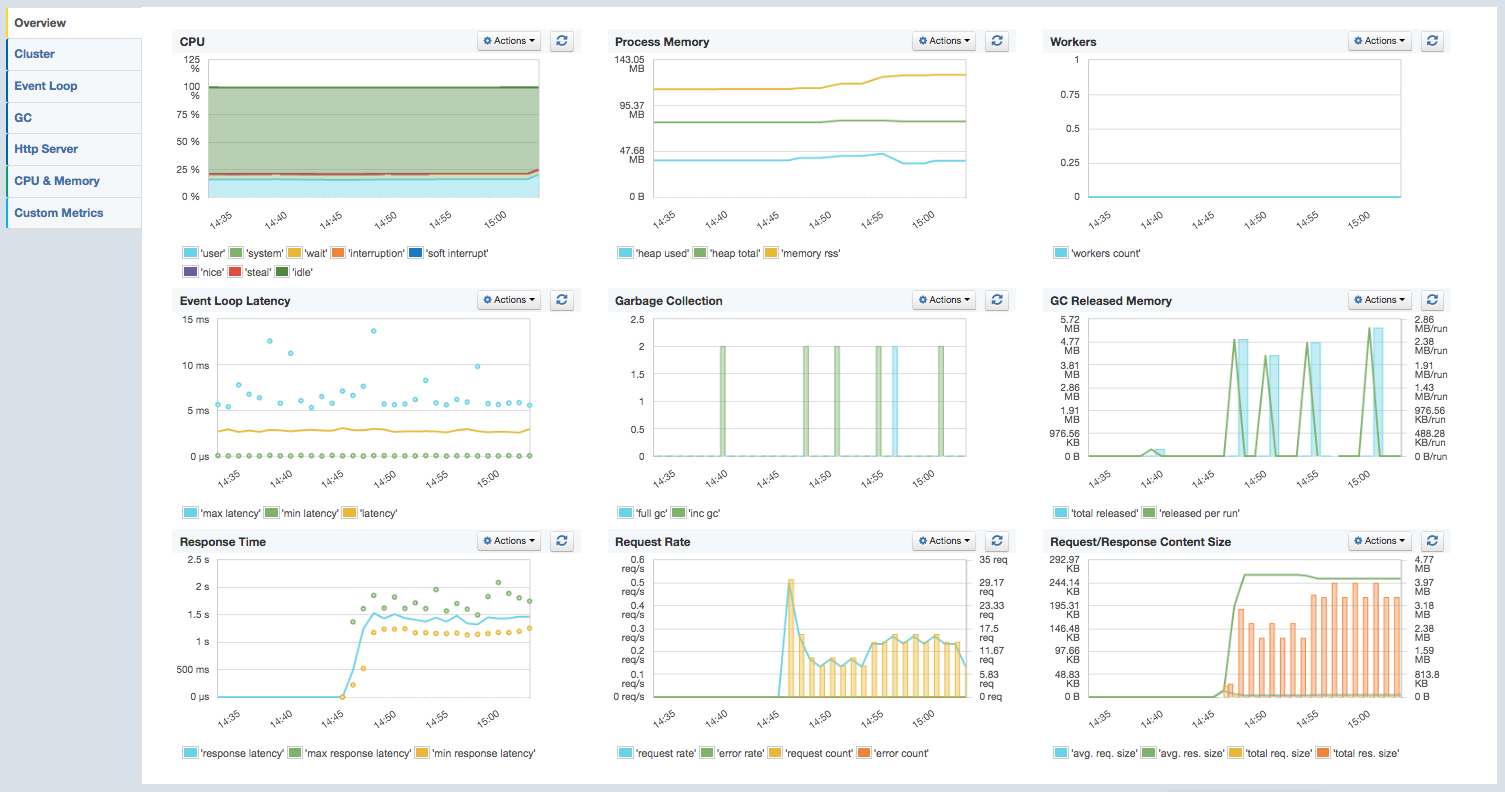
The release of Kibana 4.x has had an impact on monitoring and other related activities. In this post we’re going to get specific and show you how to add Node.js monitoring to the Kibana 4 server app. Why Node.js? Because Kibana 4 now comes with a little Node.js server app that sits between the Kibana UI and the Elasticsearch backend. Conveniently, you can monitor Node.js apps with SPM, which means SPM can monitor Kibana in addition to monitoring Elasticsearch. Futhermore, Logstash can also be monitored with SPM, which means you can use SPM to monitor your whole ELK Stack! But, I digress…
A few important things to note first:
- the Kibana 4 project moved from Ruby to pure browser app to Node.js on the server side, as mentioned above
- it now uses the popular Express Web Framework
- the server component has a built-in proxy to Elasticsearch, just like it did with the Ruby app
- when monitoring Kibana 4, the proxy requests to Elasticsearch are monitored at the same time
OK, here’s how to add Node.js monitoring to the Kibana 4 server-side app.
1) Preparation
Get an App Token for SPM by creating a new Node.js SPM App in SPM.
Kibana 4 currently ships with Node.js version 0.10.35 in a subdirectory – so please make sure your Node.js is on 0.10 while installing SPM Agent for Node.js (it compiles native modules, which need to fit to Kibana’s 0.10 runtime).
  npm-install n -g
  n 0.10.35
After finishing the described installation below you can easily switch back to 0.12 or io.js 2.0 by using “n 0.12” or “n io 2.0” – because Kibana will use its own node.js sub-folder.
2) Install SPM Agent for Node.js
Switch over to your Kibana 4 installation directory. It has a “src” folder where the Node.js modules are installed.
  cd src
  npm install spm-agent-nodejs
Add the following line to ./src/app.js
var spmAgent = require ('spm-agent-nodejs')Add the following line to bin/kibana shell script at the beginning
export spmagent_tokens__spm=YOUR-SPM-APP-TOKEN3) Run Kibana
bin/kibana
4) Check results in SPM
After a minute you should see the performance metrics such as EventLoop Latencies, Memory Usage, Garbage Collection details and HTTP statistics of your Kibana 4 Server app in SPM.
SPM for Node.js Monitoring – Details, Screenshots and more
For more specific details about SPM’s Node.js monitoring integration, check out this blog post.
That’s all there is to it! If you’ve got questions or feedback to this post, please let us know!
