NGINX is one of the most widely used reverse proxy servers, web servers, and load balancers. It has capabilities like TLS offloading, can do health checks for backends, and offers support for HTTP2, gRPC, WebSocket, and most TCP-based protocols.
When running a tool like NGINX, which generally sits in front of your applications, it’s important to understand how to debug issues. And because you need to see the logs, you have to understand the different NGINX logging mechanisms. In addition to the errors in your application or web server, you need to look into NGINX performance issues, as they can lead to SLA breaches, negative user experience, and more.
In this article, we’ll explore the types of logs that NGINX provides and how to properly configure them to make troubleshooting easier.
What Are NGINX Logs?
NGINX logs are the files that contain information related to the tasks performed by the NGINX server, such as who tried to access which resources and whether there were any errors or issues that occured.
NGINX provides two types of logs: access logs and error logs. Before we show you how to configure them, let’s look at the possible log types and different log levels.
Here is the most basic NGINX configuration:
http{
    server {
        listen       80;
        server_name  example.com www.example.com;
        access_log   /var/log/nginx/access.log  combined;
        root         /var/www/virtual/big.server.com/htdocs;
    }
}
For this server, we opened port 80. The server name is “example.com www.example.com.” You can see the access and error log configurations, as well as the root of the directive, which defines from where to serve the files.
What Are NGINX Access Logs?
NGINX access logs are files that have the information of all the resources that a client is accessing on the NGINX server, such as details about what is being accessed and how it responded to the requests, including client IP address, response status code, user agent, and more. All requests sent to NGINX are logged into NGINX logs just after the requests are processed.
Here are some important NGINX access log fields you should be aware of:
- remote_addr: The IP address of the client that requested the resource
- http_user_agent: The user agent in use that sent the request
- time_local: The local time zone of the server
- request: What resource was requested by the client (an API path or any file)
- status: The status code of the response
- body_bytes_sent: The size of the response in bytes
- request_time: The total time spent processing the request
- remote_user: Information about the user making the request
- http_referer: The IP address of the HTTP referer
- gzip_ratio: The compression ratio of gzip, if gzip is enabled
NGINX Access Log Location
You can find the access logs in the logs/access.log file and change their location by using the access_log directive in the NGINX configuration file.
access_log path [format [buffer=size] [gzip[=level]] [flush=time] [if=condition]];
access_log /var/log/nginx/access.log combined
By changing the path field in the access_log directive, you can also change where you want to save your access logs.
An NGINX access log configuration can be overridden by another configuration at a lower level. For example:
http {
  access_log  /var/log/nginx/access.log  main;
  server {
    listen 8000;
    location /health {
      access_log off; # <----- this WILL work
      proxy_pass http://app1server;
    }
  }
}
Here, any calls to /health will not be logged, as the access logs are disabled for this path. All the other calls will be logged to the access log. There is a global config, as well as different local configs. The same goes for the other configurations that are in the NGINX config files.
How to Enable NGINX Access Logs
Most of the time, NGINX access logs are enabled by default. To enable them manually, you can use the access_log directive as follows:
access_log /var/log/nginx/access.log combined
The first parameter is the location of the file, and the second is the log format. If you put the access_log directive in any of the server directories, it will start the access logging.
Setting Up NGINX Custom Log Format
To easily predefine the NGINX access log format and use it along with the access_log directive, use the log_format directive:
log_format upstream_time '$remote_addr - $remote_user [$time_local] '
    '"$request" $status $body_bytes_sent '
    '"$http_referer" "$http_user_agent"'
    'rt=$request_time uct="$upstream_connect_time" uht="$upstream_header_time" urt="$upstream_response_time"';
Most of the fields here are self explanatory, but if you want to learn more, look up NGINX configurations for logging. You can specify the log formats in an HTTP context in the /etc/nginx/nginx.conf file and then use them in a server context.
By default, NGINX access logs are written in a combined format, which looks something like this:
log_format combined '$remote_addr - $remote_user [$time_local] '
                    '"$request" $status $body_bytes_sent '
                    '"$http_referer" "$http_user_agent"';
Once you have defined the log formats, you can use them with the access_log directive, like in the following examples:
server {
    access_log /var/log/nginx/access.log combined
    access_log /var/log/nginx/access.log upstream_time #defined in the first format
    …
}
Formatting the Logs as JSON
Logging to JSON is useful when you want to ship the NGINX logs, as JSON makes log parsing very easy. Since you have key-value information, it will be simpler for the consumer to understand. Otherwise, the parse has to understand the format NGINX is logging.
NGINX 1.11.8 comes with an escape=json setting, which helps you define the NGINX JSON log format. For example:
log_format json_combined escape=json
  '{'
    '"time_local":"$time_local",'
    '"remote_addr":"$remote_addr",'
    '"remote_user":"$remote_user",'
    '"request":"$request",'
    '"status": "$status",'
    '"body_bytes_sent":"$body_bytes_sent",'
    '"http_referrer":"$http_referer",'
    '"http_user_agent":"$http_user_agent",'
    '"request_time":"$request_time"'
  '}';
You can now use this predefined log format in JSON with the access_log directive to get the logs in JSON.
You can also use an open-source NGINX module, like https://github.com/jiaz/nginx-http-json-log, to do the JSON logging.
Configuring NGINX Conditional Logging
Sometimes, you want to write logs only when a certain condition is met. NGINX calls this conditional logging. For example:
map $remote_addr $log_enable {
    "192.168.4.1" 0;
    "192.168.4.2" 0;
    "192.168.4.3" 0;
    "192.168.4.4" 0;
    default 1;
}
access_log /var/log/nginx/access.log combined if=$log_enable
This means that whenever the request comes from the IPs 192.168.4.1 to 192.168.4.4, the access logs will not be populated. For every other IP, the logs will be recorded.
You can use conditional logging with NGINX in multiple scenarios. For example, if you are under attack and can identify the IPs of the attacker, you can log the requests to a different file. This allows you to process the file and get relevant information about the attack later.
How to View NGINX Access Logs
Linux utilities, like LESS or TAIL, allow you to view NGINX logs easily. You can also see the NGINX access logs’ location from the configuration files. With newer systems that are running systemd, the journalctl feature can tail the logs. To see the logs, use this command:
journalctl -fu nginx.service
You can also tail the log locations, as shown here:
tail -f /var/log/nginx/access.log
It’s also possible to use journalctl, but this will show all the logs together, which can be a bit confusing.
How to Disable Access Logs
To disable an NGINX access log, pass the off argument to the access_log directive:
access_log off;
This can be useful when there are too many logs, which can overload the disk IO and, in rare cases, impact the performance of your NGINX server. However, disabling NGINX access logs is not usually recommended, as it can make troubleshooting difficult.
What Are NGINX Error Logs?
NGINX error logs are the files where all information about errors will be logged, including permission errors or any NGINX configuration-related access errors. While access logs are used to see the HTTP requests received by the server, error logs bring more value, as when there is an issue, they will show exactly what happened and provide detailed information about the issue.
Whenever there is an error with the requests, or when there are NGINX glitches, these issues will be recorded in the error log files configured in the NGINX configuration file.
Where Are the NGINX Error Logs Stored?
The location of NGINX error logs can be configured in the error_log directive in the NGINX configuration. By default, these logs are in the /var/log/nginx directory. You can configure the location separately for different server components that you can run in the NGINX configuration.
The default location is:
/var/log/nginx/error.log
NGINX Error Logs Configuration
NGINX error logs configuration is in the same place as access_log. You can use the error_log directive to enable and configure the log levels and the location of the log file. Here is the configuration line to enable the error_log:
error_log log_file_location log_level;
NGINX Error Log Levels
NGINX has eight log levels for different degrees of severity and verbosity:
- emerg: These are the emergency logs. They mean that the system is unusable.
- alert: An immediate action is required.
- crit: A critical condition occurred.
- error: An error or failure occurred while processing a request.
- warn: There was an unexpected event, or something needs to be fixed, but NGINX fulfilled the request as expected.
- notice: Something normal, but important, has happened, and it needs to be noted.
- info: These are messages that give you information about the process.
- debug: These are messages that help with debugging and troubleshooting. They are generally not enabled unless needed because they create a lot of noise.
Note that the log_level parameter is a threshold, as every log level includes the previous log levels as well. For example, if your log level is 6 (notice), your logs will contain entries from levels 1 through 6.
Enable Debug Logging and Other Levels
You can specify the log level with the error_log directive using the log_level argument. As the log level number increases, the logs will contain more information. If the application misbehaves, you can enable the debug logs to aid you in the troubleshooting process. With the extra information they provide, you will be able to pinpoint the issue more easily. You can read about this more in the NGINX documentation.
Keeping NGINX debug logs enabled continuously is not recommended, as it will make logs very noisy and large by printing information that is generally unnecessary. If you see an issue, you can change the log level on the fly, solve the problem, then revert it back to a stricter severity.
Logging to Multiple Files
You can forward NGINX error logs to separate files based on the different log levels. In the configuration below, you send logs to all the specified log directives based on the log severity level.
error_log /var/log/nginx/error.info info;
error_log /var/log/nginx/error.crit crit;
This configuration can be very useful when looking at the different log levels separately or if you want your logging agent to label these logs based on filenames. You can selectively discard the error logs based on their severity.
How to Check NGINX Error Logs
You can view NGINX error logs the same way as access logs: for example, by using TAIL, LESS, or other utilities. Below is an example of how to do it with TAIL using the location of the error_logs that you have set. These logs are also present in journalctl logs, but there, they will be a combination of access_log and error_logs.
tail -f /var/log/nginx/error.log
How to Disable Error Logs
Disabling NGINX error logs can be tricky, as there is no off option in error_log. Similar to access_log in the lower configuration levels, you can use error_log false at the higher level configurations.
error_log off;
For the lower levels, you can forward the logs to /dev/null:
error_log /dev/null;
How to Send NGINX Logs to Syslog
NGINX can also ship your logs to log aggregators using syslog. This can be useful when you are logging other system/service logs in syslog or using syslog to export the logs. You can implement this with the syslog: prefix, which can be used with both access_log and error_logs. You can also use this prefix instead of the file path in the access_log and error_log directives.
Syslog can help you concentrate your NGINX logs in one place by forwarding them to a centralized logging solution:
error_log syslog:unix/var/log/nginx.sock debug
You can also send the logs to different syslog servers by defining the syslog server parameter to point to the IP or hostname and port of the syslog server.
error_log syslog:server=192.168.100.1 debug
access_log syslog:server=[127.0.0.1]:9992, facility=local1,tag=nginx,severity=debug;
In the above configuration for access_log, the logs are forwarded to the local syslog server, with the service name as local1, since syslog doesn’t have an option for NGINX.
Syslog has various options for keeping the forwarded logs segregated:
- Facility: Identifies who is logging to syslog.
- Severity: Specifies the log levels.
- Tag: Identifies the message sender or any other information that you want to send; default is NGINX.
NGINX Logging in Kubernetes Environments
In Kubernetes, NGINX Ingress runs as a pod. All the logs for the NGINX Ingress pods are sent to standard output and error logs. However, if you want to see the logs, you have to log in to the pod or use the kubectl commands, which is not a very practical solution.
You also have to find a way to ship the logs from the containers. You can do this with any logging agent that is running in the Kubernetes environment. These agents run as pods and mount the file system that NGINX runs on, reading the logs from there.
How to See the NGINX Ingress Logs
Use the kubectl logs command to see the NGINX logs as streams:
$ kubectl logs -f nginx-ingress-pod-name -n namespace.
It’s important to understand that pods can come and go, so the approach to debugging issues in the Kubernetes environment is a bit different than in VM or baremetal-based environments. In Kubernetes, the logging agent should be able to discover the NGINX Ingress pods, then scrape the logs from there. Also, the log aggregator should show the logs of the pods that were killed and discover any new pod that comes online.
NGINX Logging and Analysis with Sematext
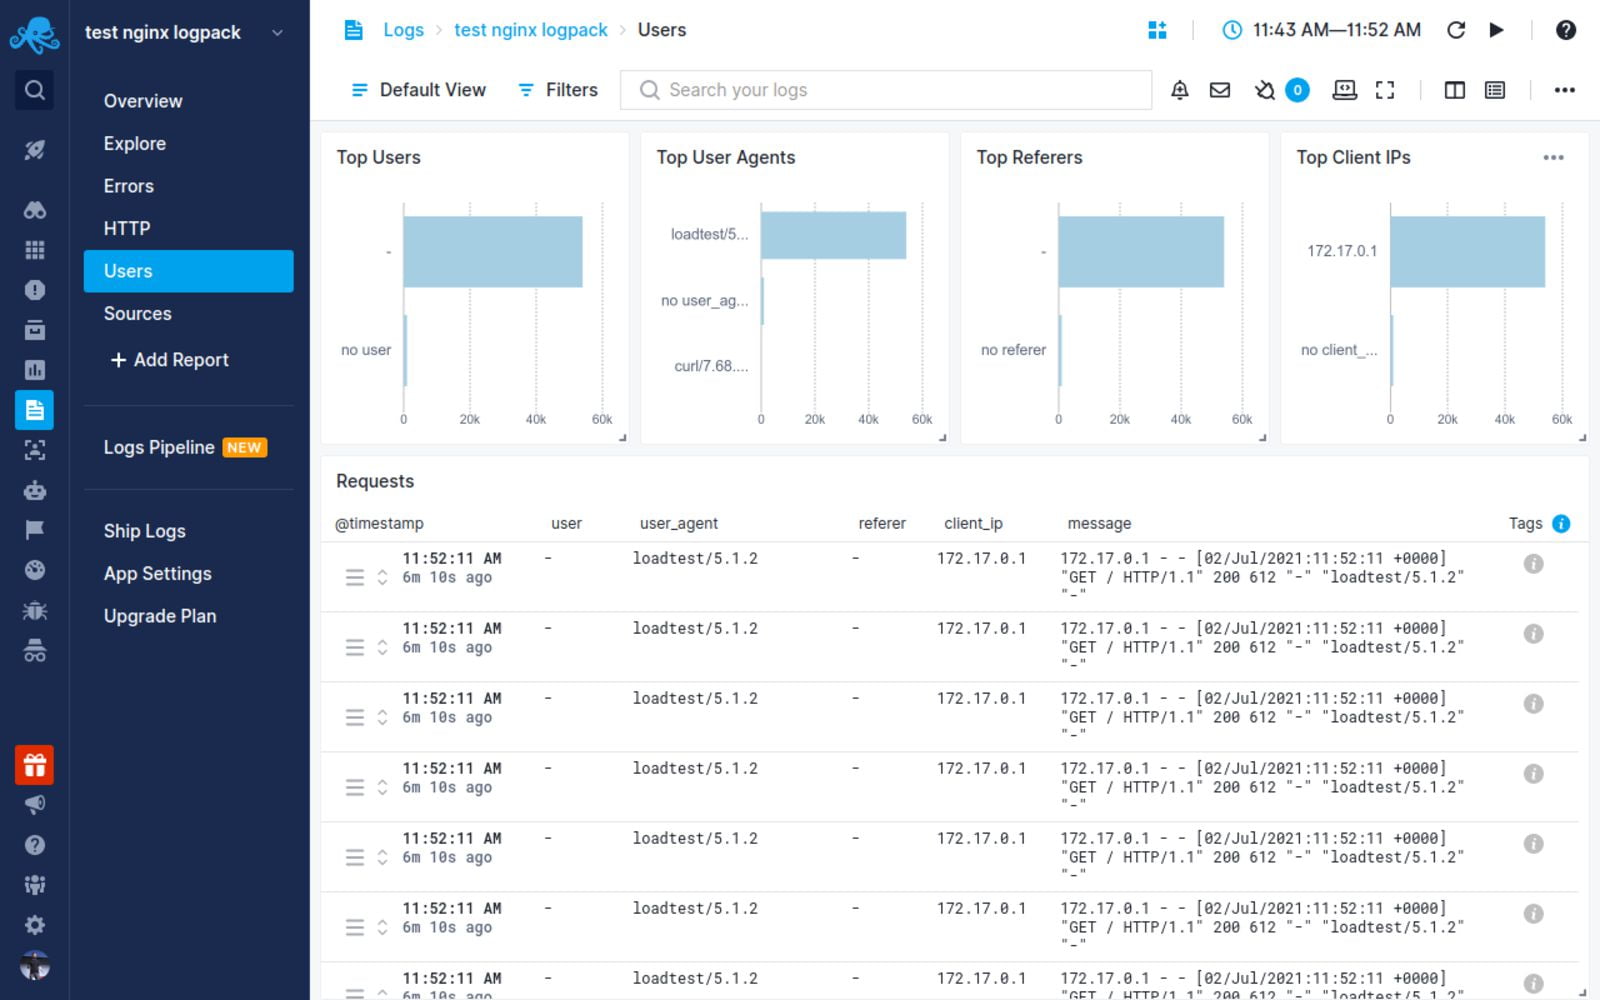
NGINX log integration with Sematext
Sematext Logs is a log aggregation and management tool with great support for NGINX logs. Its auto-discovery feature is helpful, particularly when you have multiple machines. Simply create an account with Sematext, create the NGINX Logs App and install the Sematext Agent. Once you’re set up, you get pre-built, out-of-the-box dashboards and the option to build your own custom dashboards.
Sematext Logs is part of Sematext Cloud, a full-stack monitoring solution that gives you all you need when it comes to observability. By correlating NGINX logs and metrics, you’ll get a more holistic view of your infrastructure, which helps you identify and solve issues quickly.
Using anomaly-detection algorithms, Sematext Cloud informs you in advance of any potential issues. These insights into your infrastructure help you prevent issues and troubleshoot more efficiently. With Sematext Cloud, you can also collect logs and metrics from a wide variety of tools, including HAProxy, Apache Tomcat, JVM, and Kubernetes. By integrating with other components of your infrastructure, this tool is a one-stop solution for all your logging and monitoring needs.
If you’d like to learn more about Sematext Logs, and how they can help you manage your NGINX logs, then check out this short video below:
If you’re interested in how Sematext compares to other log management tools, read our review of the top NGINX log analyzers.
Conclusion
Managing, troubleshooting, and debugging large-scale NGINX infrastructures can be challenging, especially if you don’t have a proper way of looking into logs and metrics. It’s important to understand NGINX access and error logs, but if you have hundreds of machines, this will take a substantial amount of time. You need to be able to see the logs aggregated in one place.
Performance issues are also more common than you think. For example, you may not see anything in the error logs, but your APIs continue to degrade. To look into this properly, you need effective dashboarding around NGINX performance metrics, like response code and response time.
Sematext Logs can help you tackle these problems so you can troubleshoot more quickly. Sign up for our free trial today.
Author Bio

Gaurav Yadav
Gaurav has been involved with systems and infrastructure for almost 6 years now. He has expertise in designing underlying infrastructure and observability for large-scale software. He has worked on Docker, Kubernetes, Prometheus, Mesos, Marathon, Redis, Chef, and many more infrastructure tools. He is currently working on Kubernetes operators for running and monitoring stateful services on Kubernetes. He also likes to write about and guide people in DevOps and SRE space through his initiatives Learnsteps and Letusdevops.