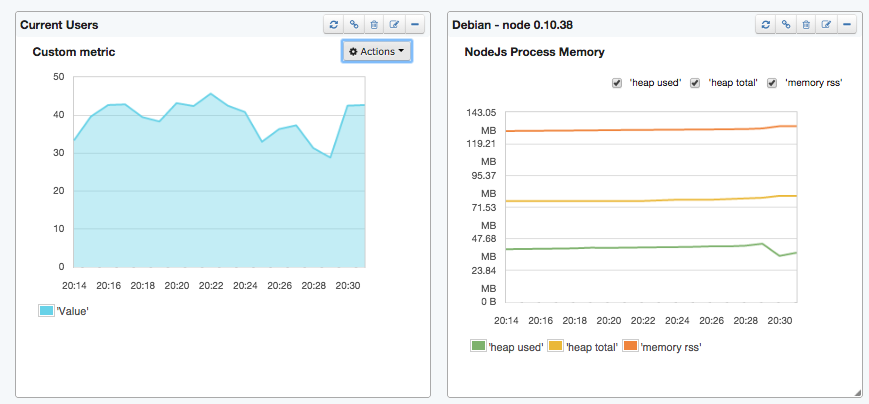
We recently added support for Node.js and io.js monitoring to SPM and have received great feedback. While SPM for Node.js monitors all key Node.js metrics, most applications have additional metrics one often wants to track — things like: the number of concurrent users, the number of items placed in a shopping cart, or any other kind of IT metric, business transaction or KPI. SPM already provides a Custom Metrics API and libraries that make shipping custom metrics from Java and from Ruby applications a snap. But why leave Node.js behind? Meet spm-metrics-js (it’s on Github) – the npm module for sending custom metrics from Node.js apps to SPM.
This JavaScript module supports measurements using counters, meters, timers, and histograms. These helpers calculate values of metrics objects and ship them to SPM, where they are then turned into charts and inputs to alert rules and anomaly detection algorithms.
Here’s an example for counting users on login and logout:
| // app.js generates login/logout events | |
| var app = require('./app.js') | |
| var os = require('os') | |
| // create SPM client | |
| var SPM = require('spm-metrics-js') | |
| var spmClient = new SPM(process.env.SPM_TOKEN, 20000) | |
| // Create a metrics object to count users | |
| var userCounterMetric = spmClient.getCustomMetric({ | |
| // name of the metric | |
| name: 'concurrentUser', | |
| // aggregation type | |
| aggregation: 'avg', | |
| // filter value in SPM User Interface, e.g. hostname | |
| filter1: os.hostname(), | |
| // auto-save metrics in the given interval | |
| interval: 30000}) | |
| // use metric as 'counter' object | |
| var counter = userCounterMetric.counter() | |
| // Hook the counter to your business logic | |
| app.on('login', function (user, password) {counter.inc()}) | |
| app.on('logout', function (user) {counter.dec()}) |
Sending custom metrics is really that easy!
Now, let’s have a look at the options used when creating a custom metric object:
- name – the name of the metric you can find in SPM’s user interface
- aggregation – the aggregation type: ‘avg’, ‘sum’, ‘min’ or ‘max’ used in SPM’s aggregations server
- filter1 – the SPM user interface provides two filter criteria; the value will be available in the UI as the first filter
- filter2 – the filter value for the second filter field in SPM’s UI
- interval – time in ms to call save() periodically. Defaults to no automatic call to save(). The save() function captures the metric and resets meters, histograms, counters or timers.
- valueFilter – array of property names for calculated values. Only specified fields are sent to SPM (e.g. [‘count’, ‘min’, ‘max’].
Additional measurement functions are available to extend the custom metric object automatically with additional calculated properties:
- Meter – measure rates and provide the following calculated properties:
- mean: the average rate since the meter was started
- count: the total of all values added to the meter
- currentRate: the rate of the meter since the meter was started
- 1MinuteRate: the rate of the meter biased toward the last 1 minute
- 5MinuteRate: the rate of the meter biased toward the last 5 minutes
- 15MinuteRate: the rate of the meter biased toward the last 15 minutes
- Histogram – build percentile, min, max, & sum aggregations over time
- min: the lowest observed value
- max: the highest observed value
- sum: the sum of all observed values
- variance: the variance of all observed values
- mean: the average of all observed values
- stddev: the stddev of all observed values
- count: the number of observed values
- median: 50% of all values in the reservoir are at or below this value.
- p75: see median, 75% percentile
- p95: see median, 95% percentile
- p99: see median, 99% percentile
- p999: see median, 99.9% percentile
- Timer – measures time and captures rates in an internal meter and histogram
If this is more than you actually need, we recommend selecting only the relevant properties (using the ‘valueFilter’ option). Please note that Custom Metrics are aggregated by the specified aggregation type (‘avg’, ‘sum’, ‘min’, ‘max’). Moreover, the aggregation type for each property can be defined – for further details please check the package documentation.
Adding instrumentation always raises the question of performance; in spm-metrics-js all metrics are buffered and efficiently ship metrics to SPM in bulk using asynchronous functions. We recommend using a transmit time of 60 seconds.
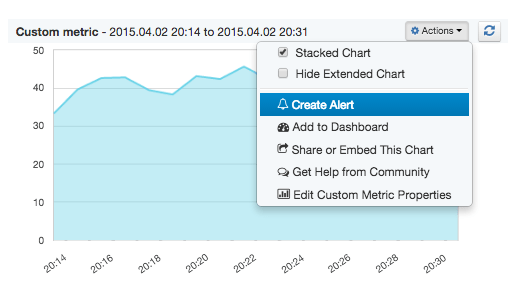
Once you send custom metrics to SPM you can create alerts on them, have SPM detect and alert you about anomalies, put charts with those metrics on dashboards, share charts with those metrics publicly or just with your team or organization, etc.
Please note the free plan has no limits on the number of monitored Applications, Processes, Dashboards or Users and you can share Accounts with your whole DevOps team and integrate SPM with Slack, HipChat, PagerDuty, Webhooks, etc. If you don’t use SPM yet, grab a free account to start monitoring your Node.js and io.js applications and benefit from all standard SPM features such as alerting, anomaly detection, event and log correlation, unlimited dashboards, secure information sharing, etc. Check out spm-metrics-js (or on Github) and drop us a line (or tweet 140 characters to @sematext) — we’d love to hear from you!

