Imagine some users complaining that querying PostgreSQL is slow (this never happened right?), and we have to troubleshoot this problem. It could be one of two things:
- Something wrong with the environment in which those queries run: not enough CPU, buffers are too small, etc.
- Those queries are too expensive: scans over millions of rows, lots of joins, etc.
I would normally first check on the environment, specifically PostgreSQL metrics over time. Such monitoring shows if the CPU is too high or how many disk reads were buffer reads. PostgreSQL logs also give information about the environment, such as how many statements were run and if any errors occurred. But I can also check the actual queries to see if they can be improved.
In this article I’ll go through all the steps I’d perform to troubleshoot queries. I’ll use Sematext Cloud because it lets me easily analyze both PostgreSQL metrics and logs using a single tool/UI. Let’s start with metrics.
Important PostgreSQL Metrics You Should Monitor
Typically, I start from broader metrics such as host CPU and then drill down to more specific ones, like how many rows are scanned vs. hitting an index. That’s because I want to know the more obvious symptoms first to understand where to look for those that are more targeted.
OS Metrics: CPU, Memory, and IO
When looking at CPU, I’m mostly interested in the breakdown between user, system, and IO wait. This analysis tells me whether the CPU is doing useful work (user) vs. waiting for the network or disk IO.
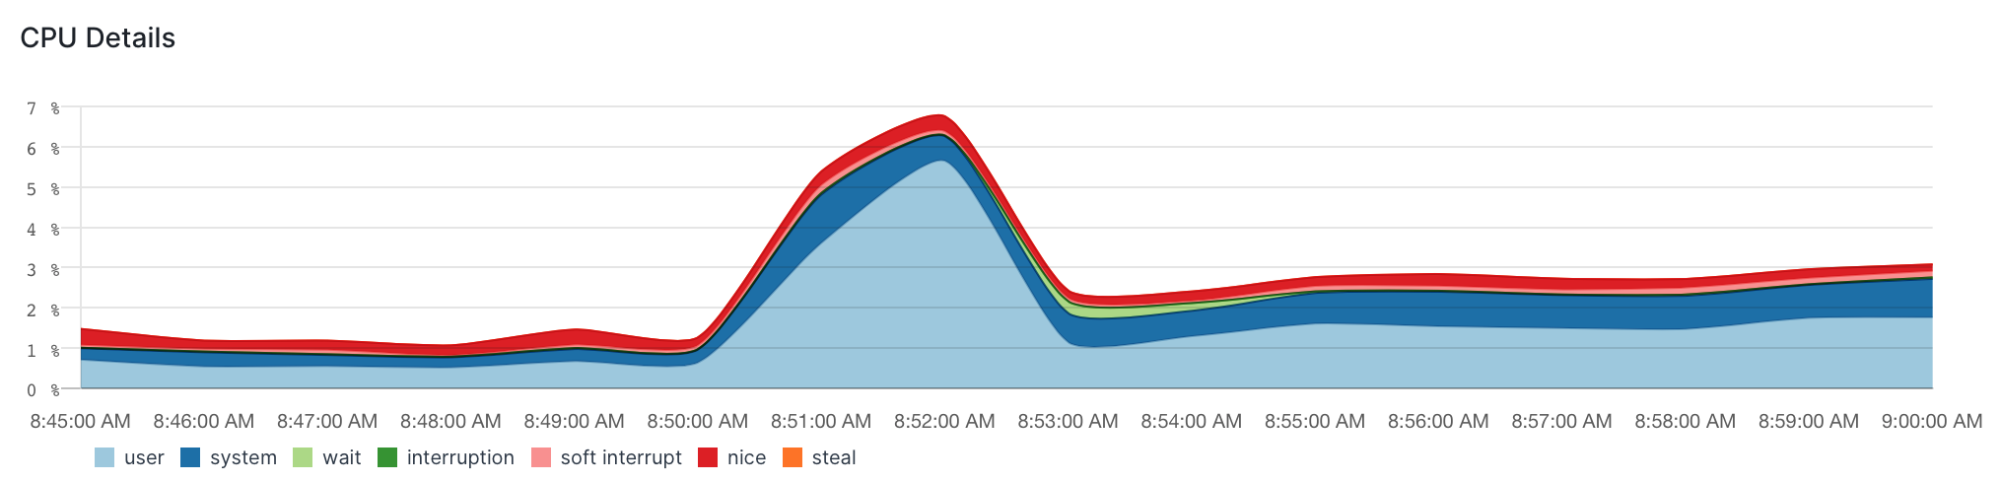
In this case, there’s a spike in CPU, though overall usage is low. IO wait is insignificant. The system usage is a significant chunk, but it doesn’t seem to grow with “user.” So I’m not worried, at least for now.
All charts from this article are from Sematext Cloud. To get PostgreSQL metrics, you have to create a PostgreSQL Monitoring App, then install the agent in a few copy-paste steps. Finally, you can explore said metrics with the predefined dashboards. You also have the option to create your own widgets and dashboards, but in this post, I’ll use only predefined dashboards.
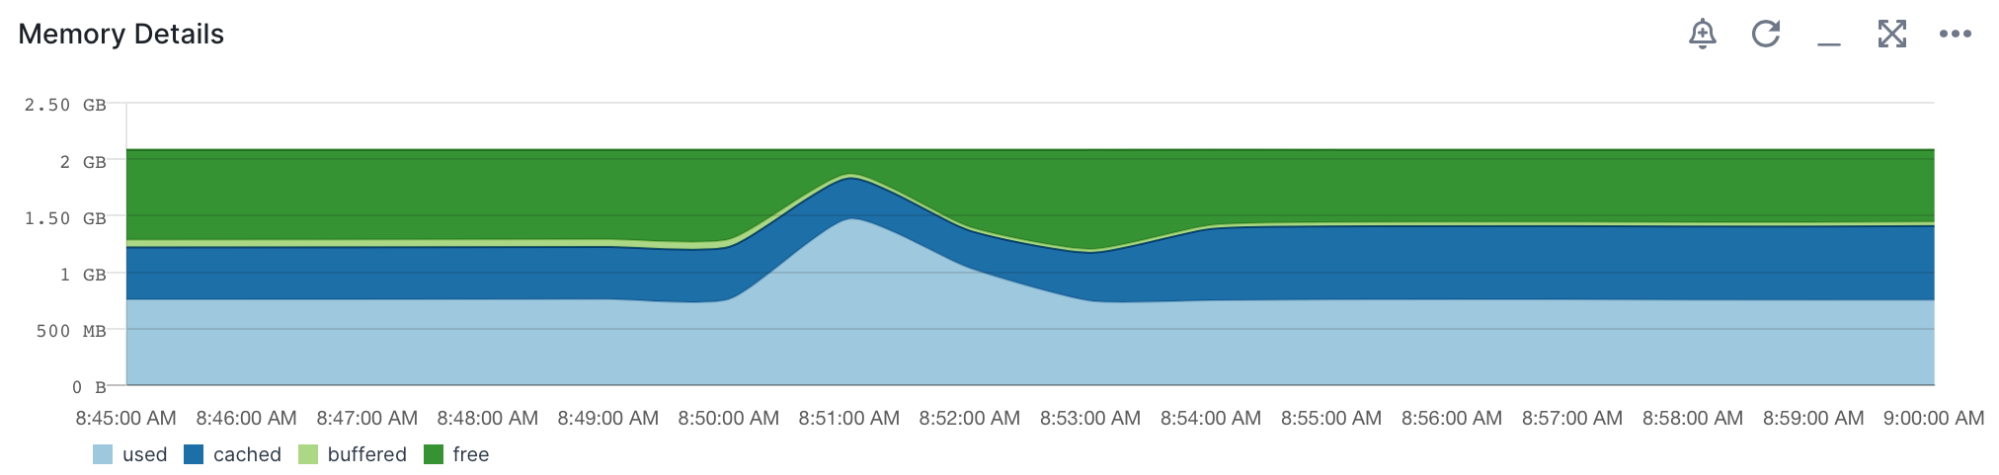
Moving on to memory, we have a bit of a spike here as well, but we still have some headroom.
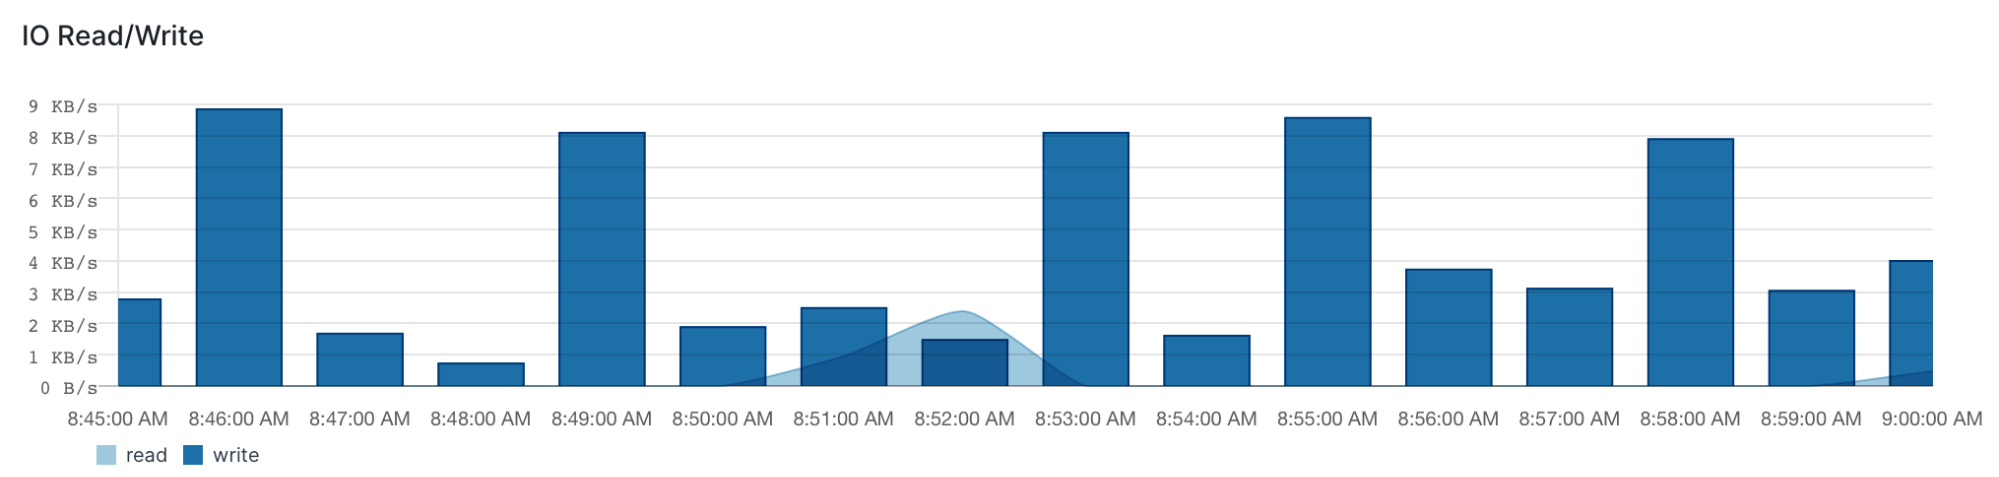
IO is definitely not a bottleneck, nor is the network. I’ll only show the disk IO throughput chart here for brevity.
Broad PostgreSQL Metrics
So far, we’ve identified that the CPU does more work, but it’s not the bottleneck. Nor is memory or IO. But we started with the assumption that queries are slow, so we need to dig deeper.
I would check the Activity dashboard next, to see whether writes or reads are causing the extra CPU usage.
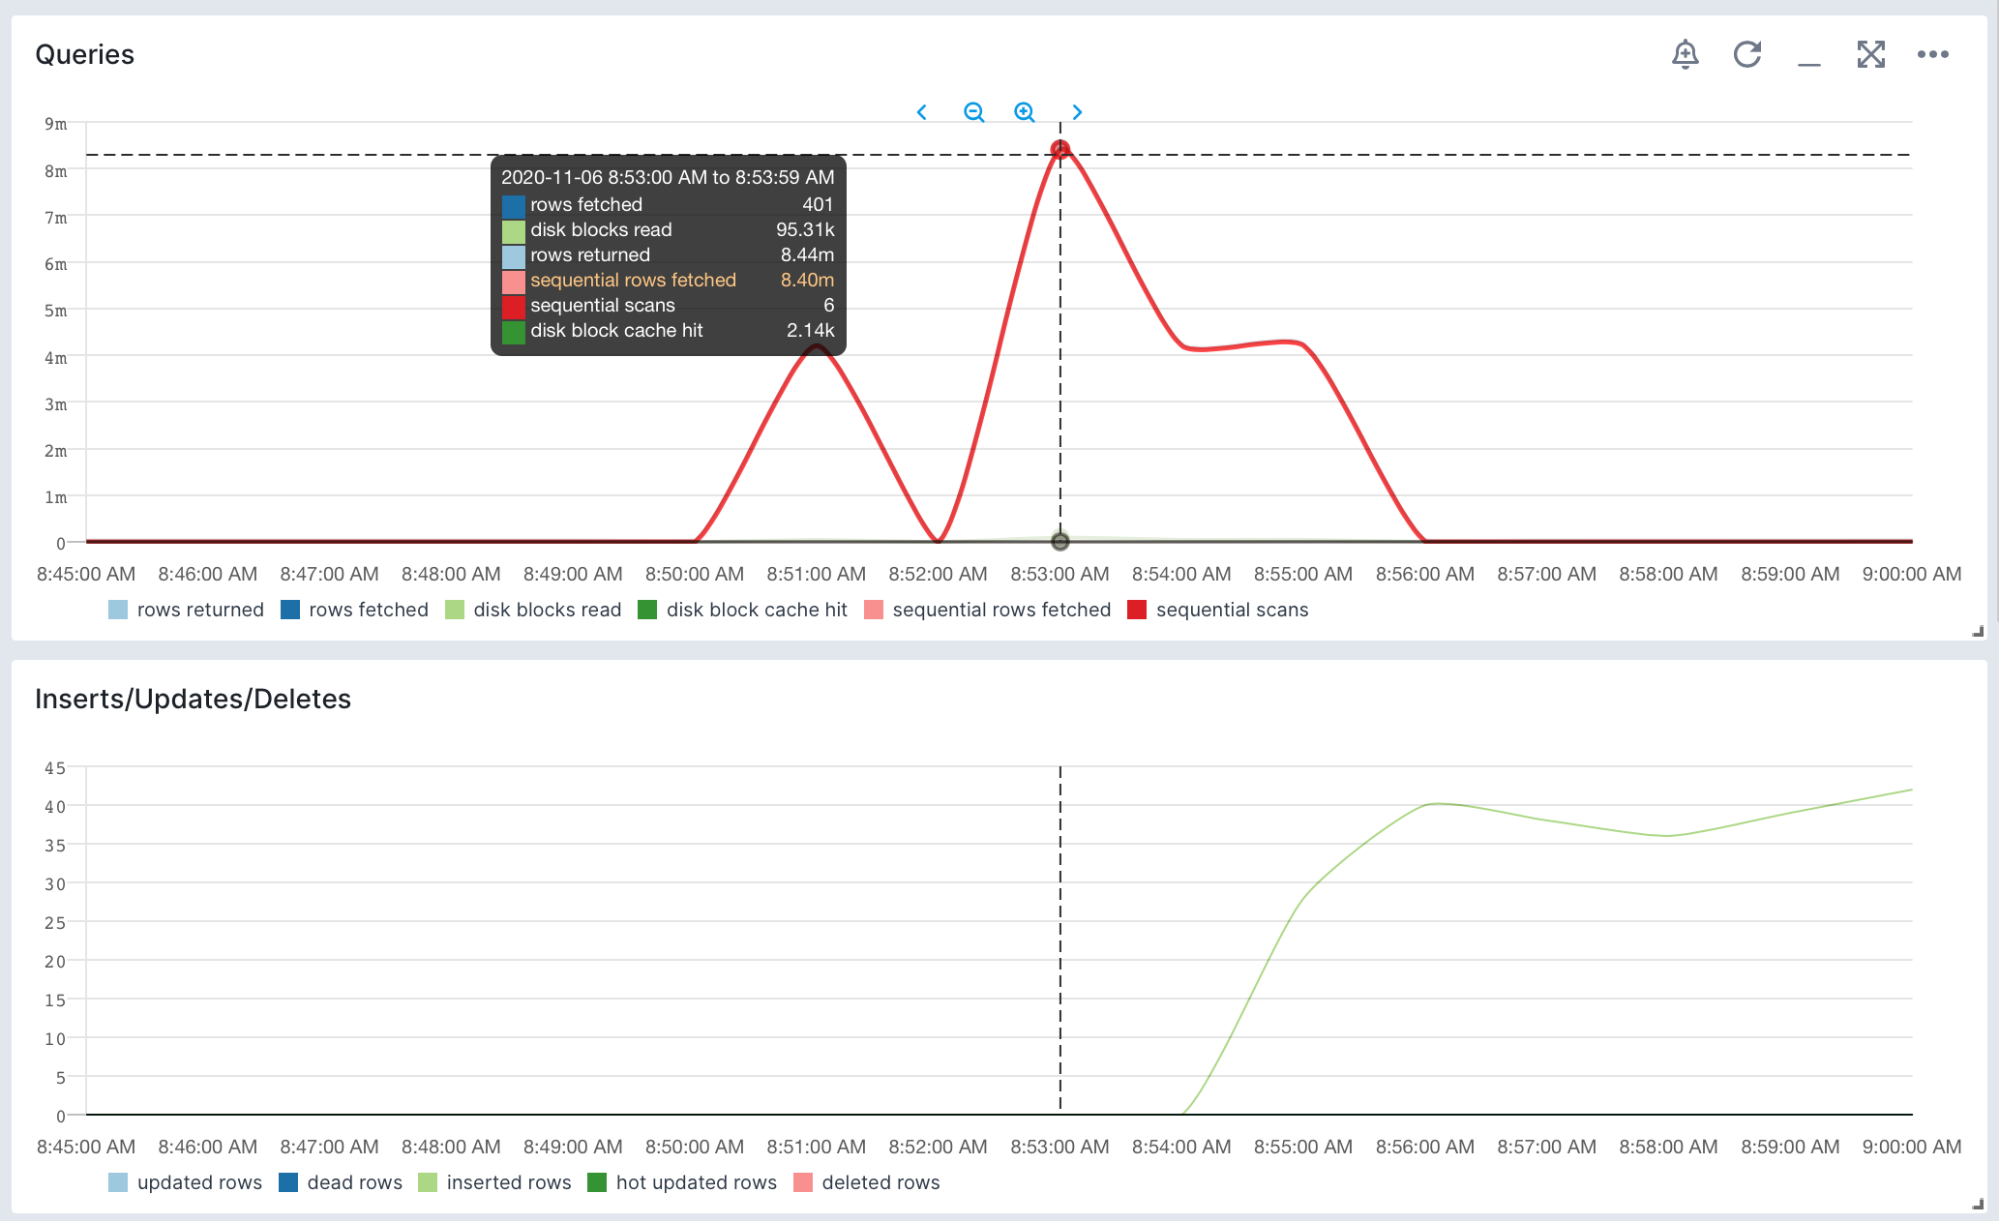
Looking at the same timeframe, we see a spike in rows read. Specifically, sequential rows fetched and returned: probably queries returning many rows, and logs will confirm/deny this assumption, as I will show you shortly.
Writes only really start after the CPU spike, and we don’t have that many.
Detailed PostgreSQL Metrics
There are many PostgreSQL metrics exposed, but when troubleshooting queries, I need to know whether indexes are used in the slow queries, especially since the previous chart showed a number of sequential scans. Here’s what I see when switching to the Indexes dashboard:
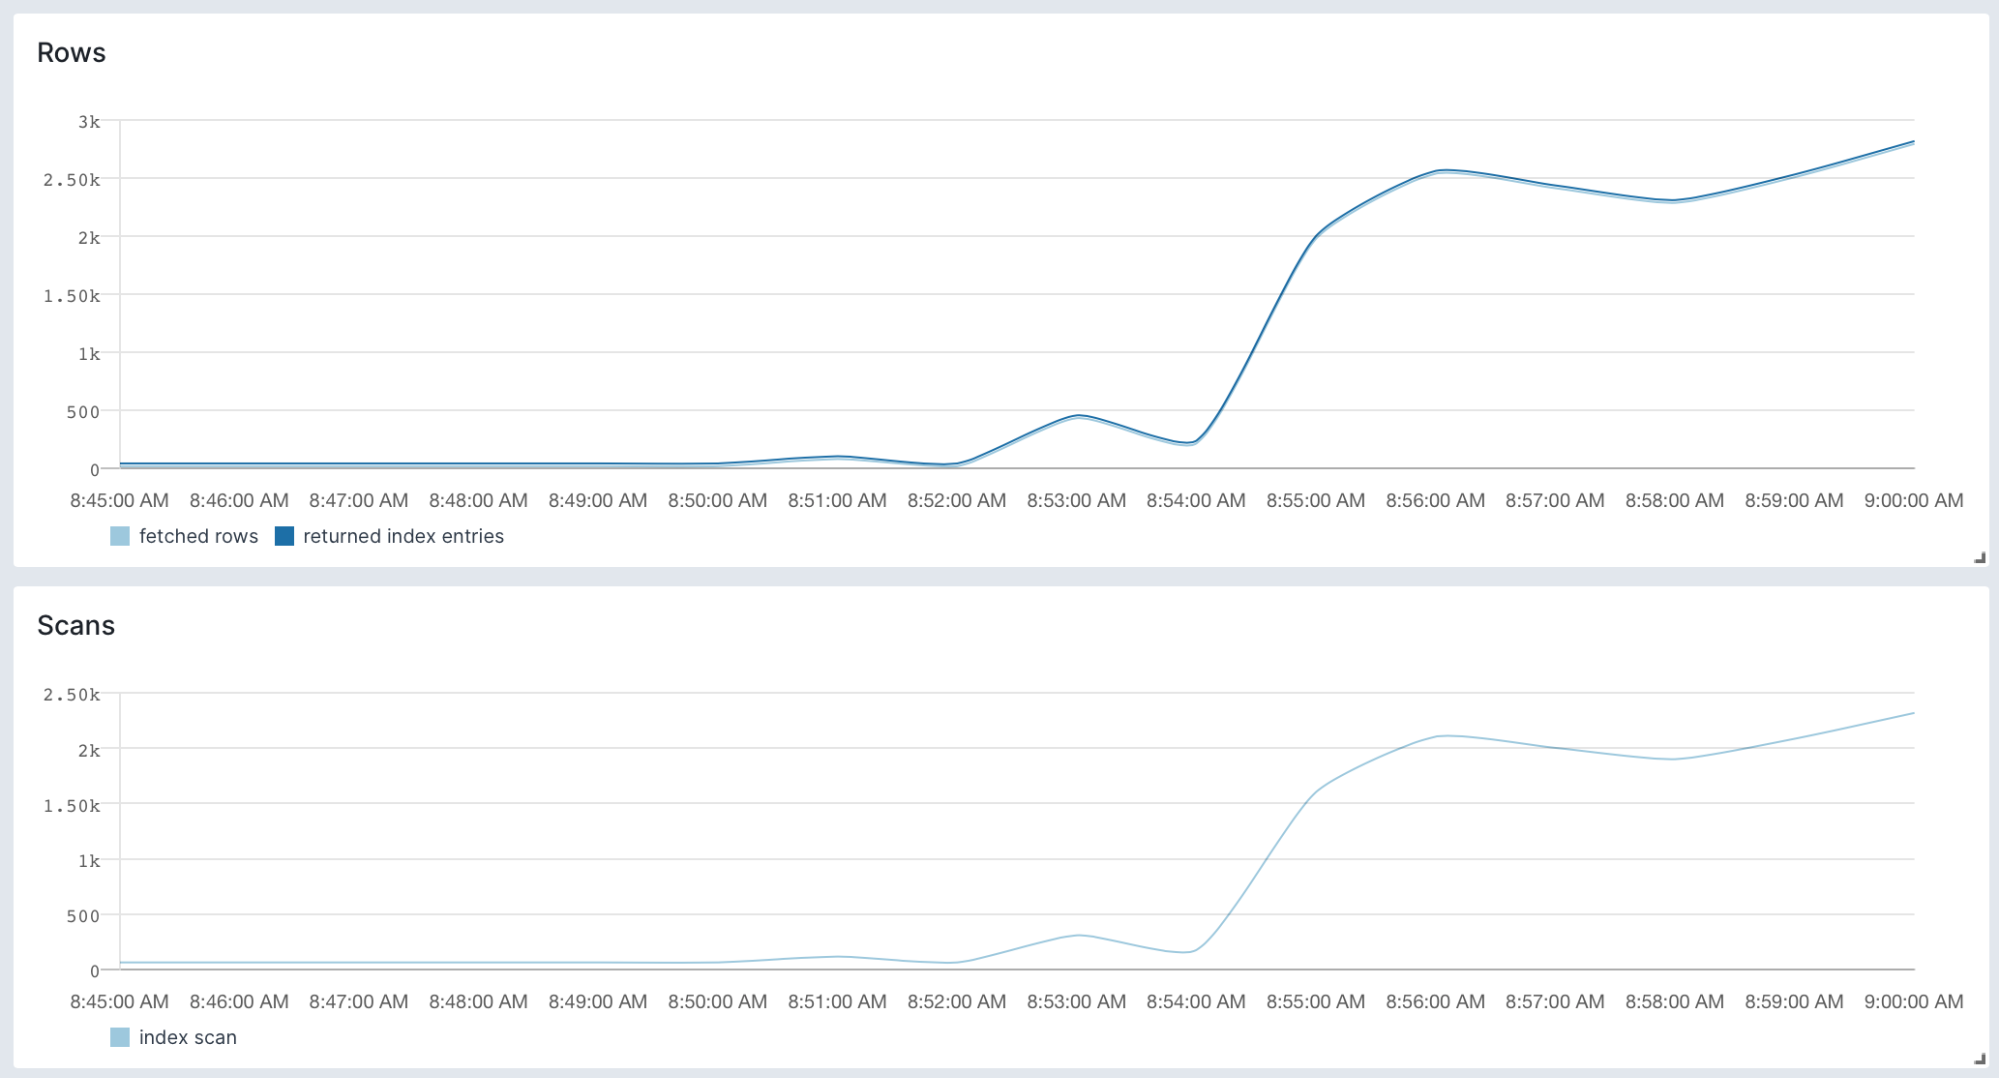
Bingo! Look at that! This shows us that no, we are not using indexes that much: index usage picks up after the CPU spike. We could look at other metrics, such as whether we hit data from heap vs. going directly to disk (surprise! We go directly to the disk!), but we have enough pointers now to one or a few slow queries that we need to identify and tweak. So now, let’s switch to looking at Logs to narrow things down further.
Using PostgreSQL Logs to Identify Slow Queries
By default, PostgreSQL logs each statement with its duration. We can tail these logs with our open-source Logagent, as it can parse PostgreSQL’s default log format out of the box.
If we send parsed logs to a Sematext Logs app (once again, a quick copy-paste setup), we can bring logs into the context of our initial rows spike via Split Screen, which is very handy when you want to compare and correlate things side by side:
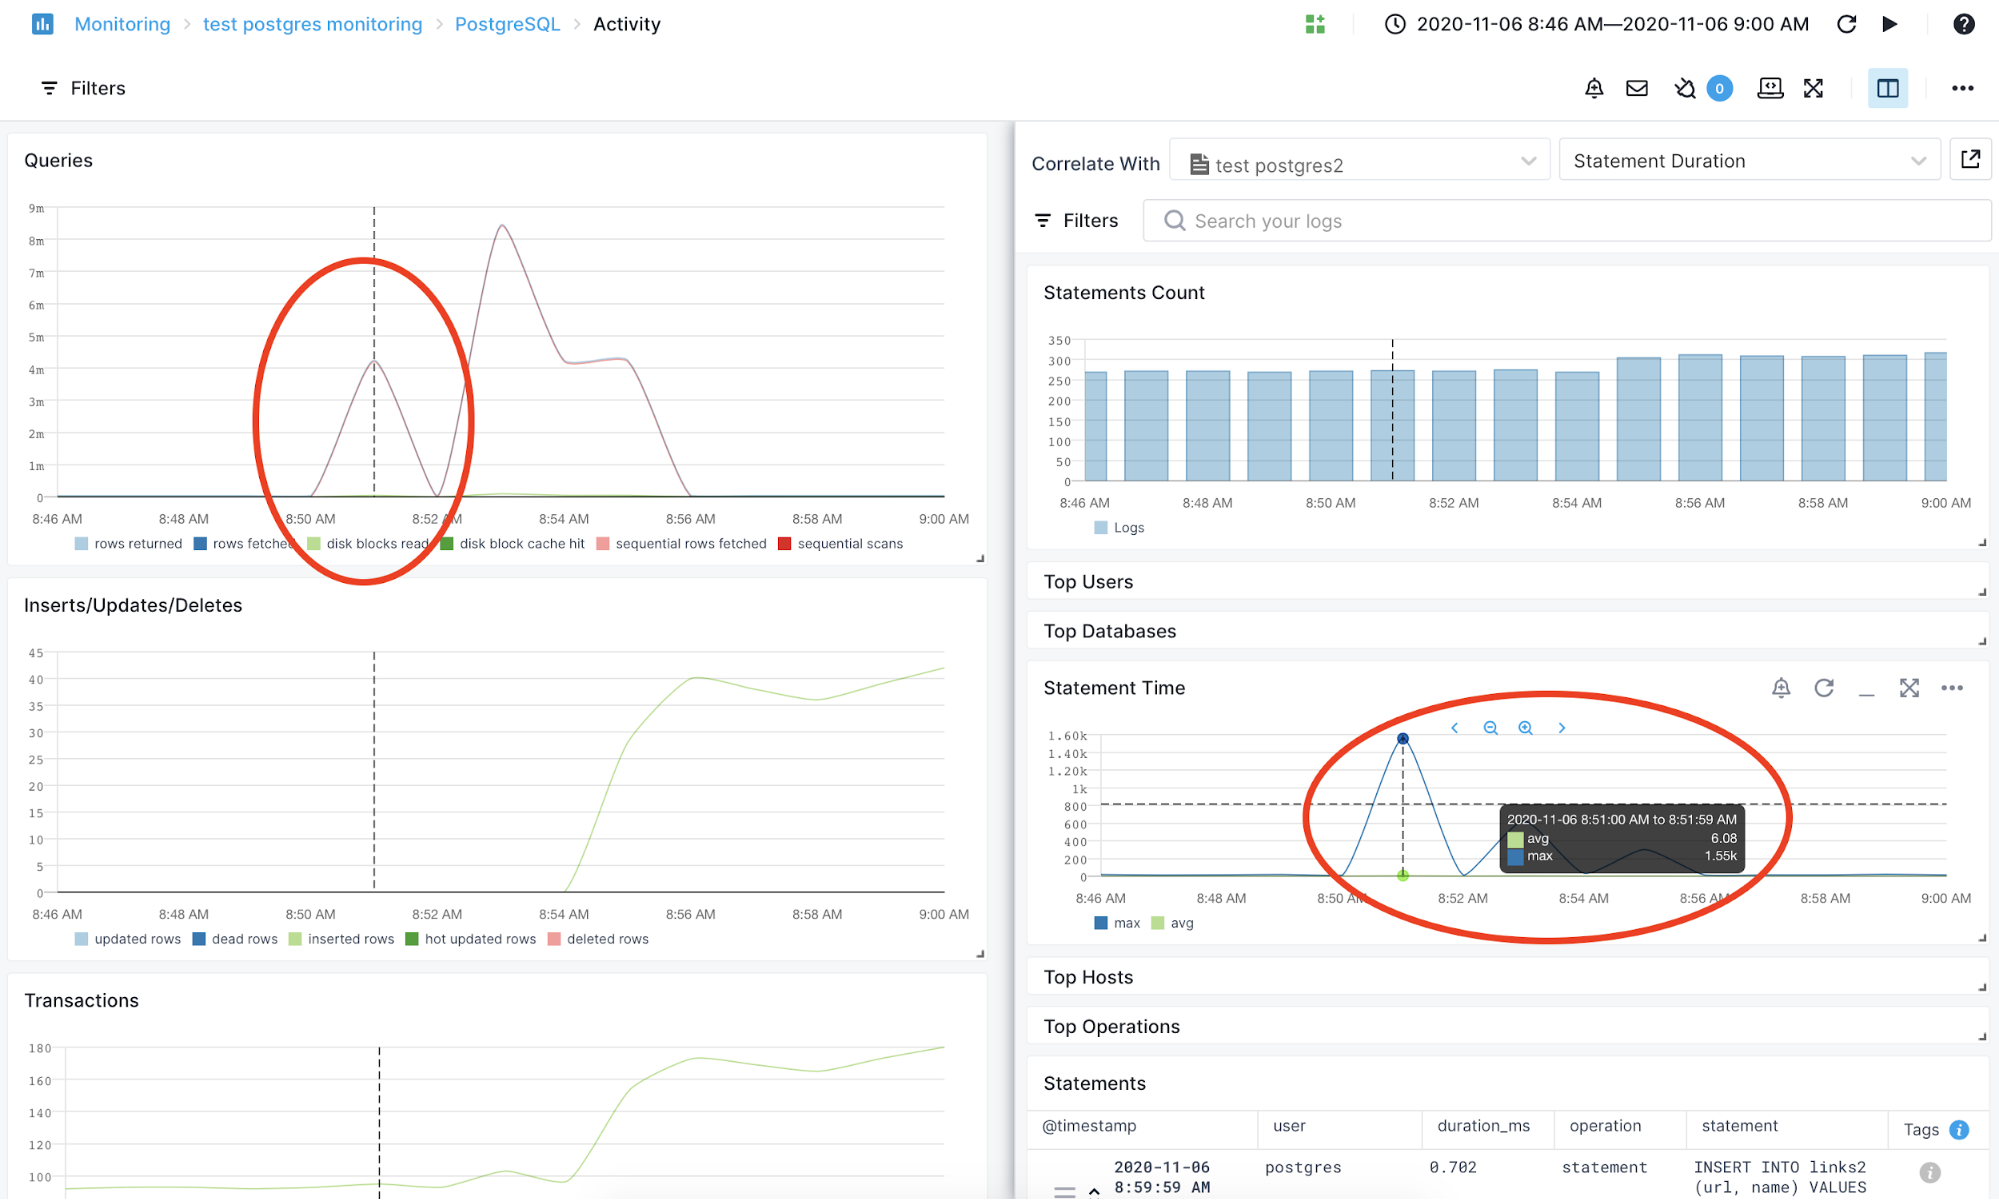
As the built-in Statement Duration dashboard shows, the statement count is relatively flat, and so is the average statement time. But we have spikes of maximum statement time, which correlate precisely with the spike in rows fetched. So we’re on the right track. Next, we can filter by statement duration to identify the slow queries:
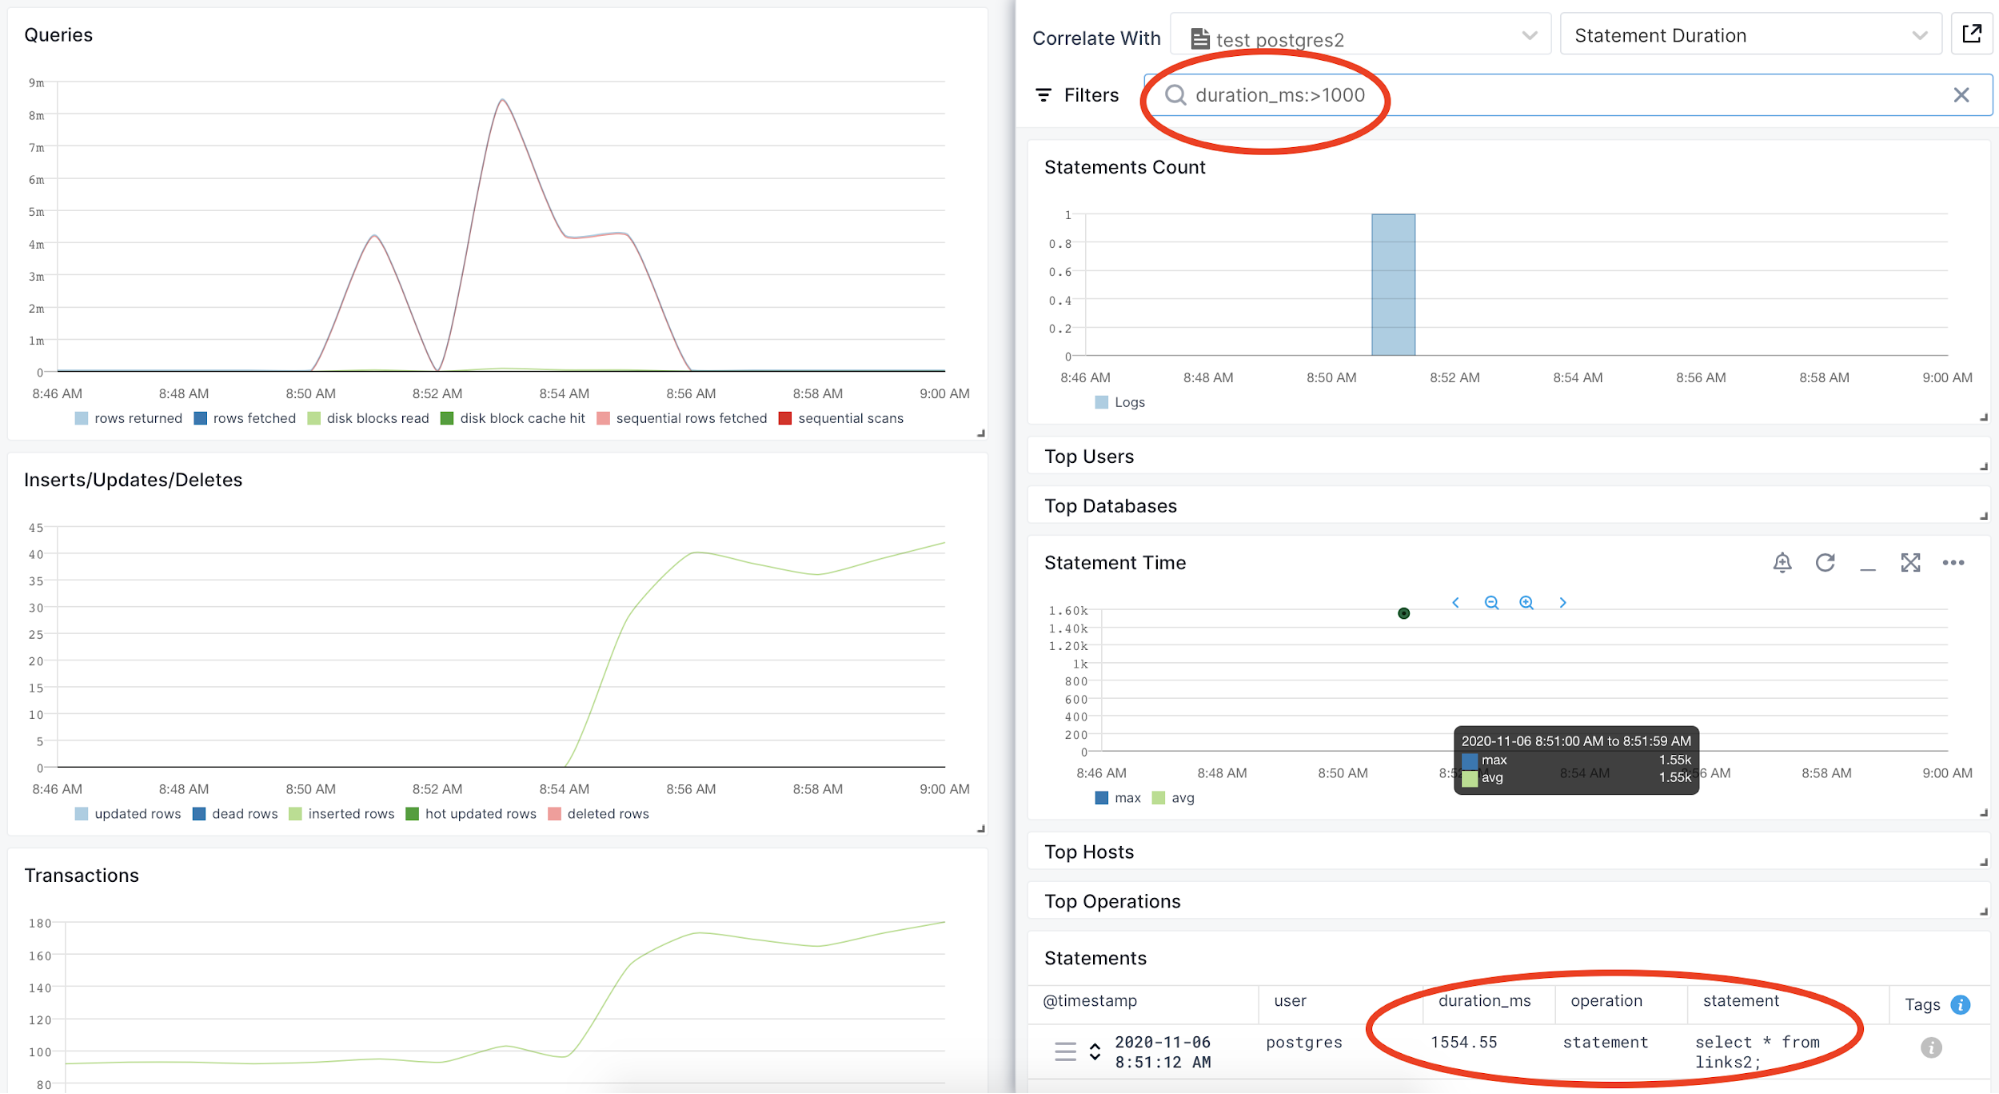
And there you have it! We have this massive select bringing a few million rows back all at once. No wonder they complain it’s slow!
Side-note: you can always save a search like this (duration_ms more than a threshold) and create an alert when it matches. This way, you’ll know about such problems before a user complains.
So How Do You Fix Slow Queries in PostgreSQL?
To speed up this particular PostgreSQL slow query, we need to know whether we really need all rows. If not, we should only get N of them by adding a LIMIT clause. If they are, we should use a cursor.
More importantly, we can use the process above to troubleshoot other slow queries and even different PostgreSQL-related issues: start from generic metrics like CPU, network, or disk IO and drill down to specifics. Then, bring logs into the context to see which particular events (slow statements, errors, etc.) caused a change in metrics.
With Sematext Cloud, you can easily sift through host, container, and PostgreSQL metrics, as well as PostgreSQL logs. You can read more about its capabilities and how it stacks against similar solutions in our article on the best PostgreSQL monitoring tools.
Start your Sematext trial now and let us know what you think!