Need we say more? If you’ve used Sematext Cloud recently you’ve noticed the UI looks and behaves differently. Indeed, we rewrote the whoooooole front-end using modern front-end technologies like React.js and Redux (watch this statement become outdated in 12 months!).
We’ve switched to Chart.JS for charts, and contributed a few PRs to it along the way. We’ve made it possible to show/hide chart legends, change their positioning, to easily add/remove individual timeseries from metrics charts, and so on. Dashboards have been completely rewritten and are much, much faster and lighter than before. You can easily create a Dashboard that contains charts from multiple different Metrics or Logs apps. You can also add logs themselves to a Dashboard, or event charts, or components with custom Markdown in them.
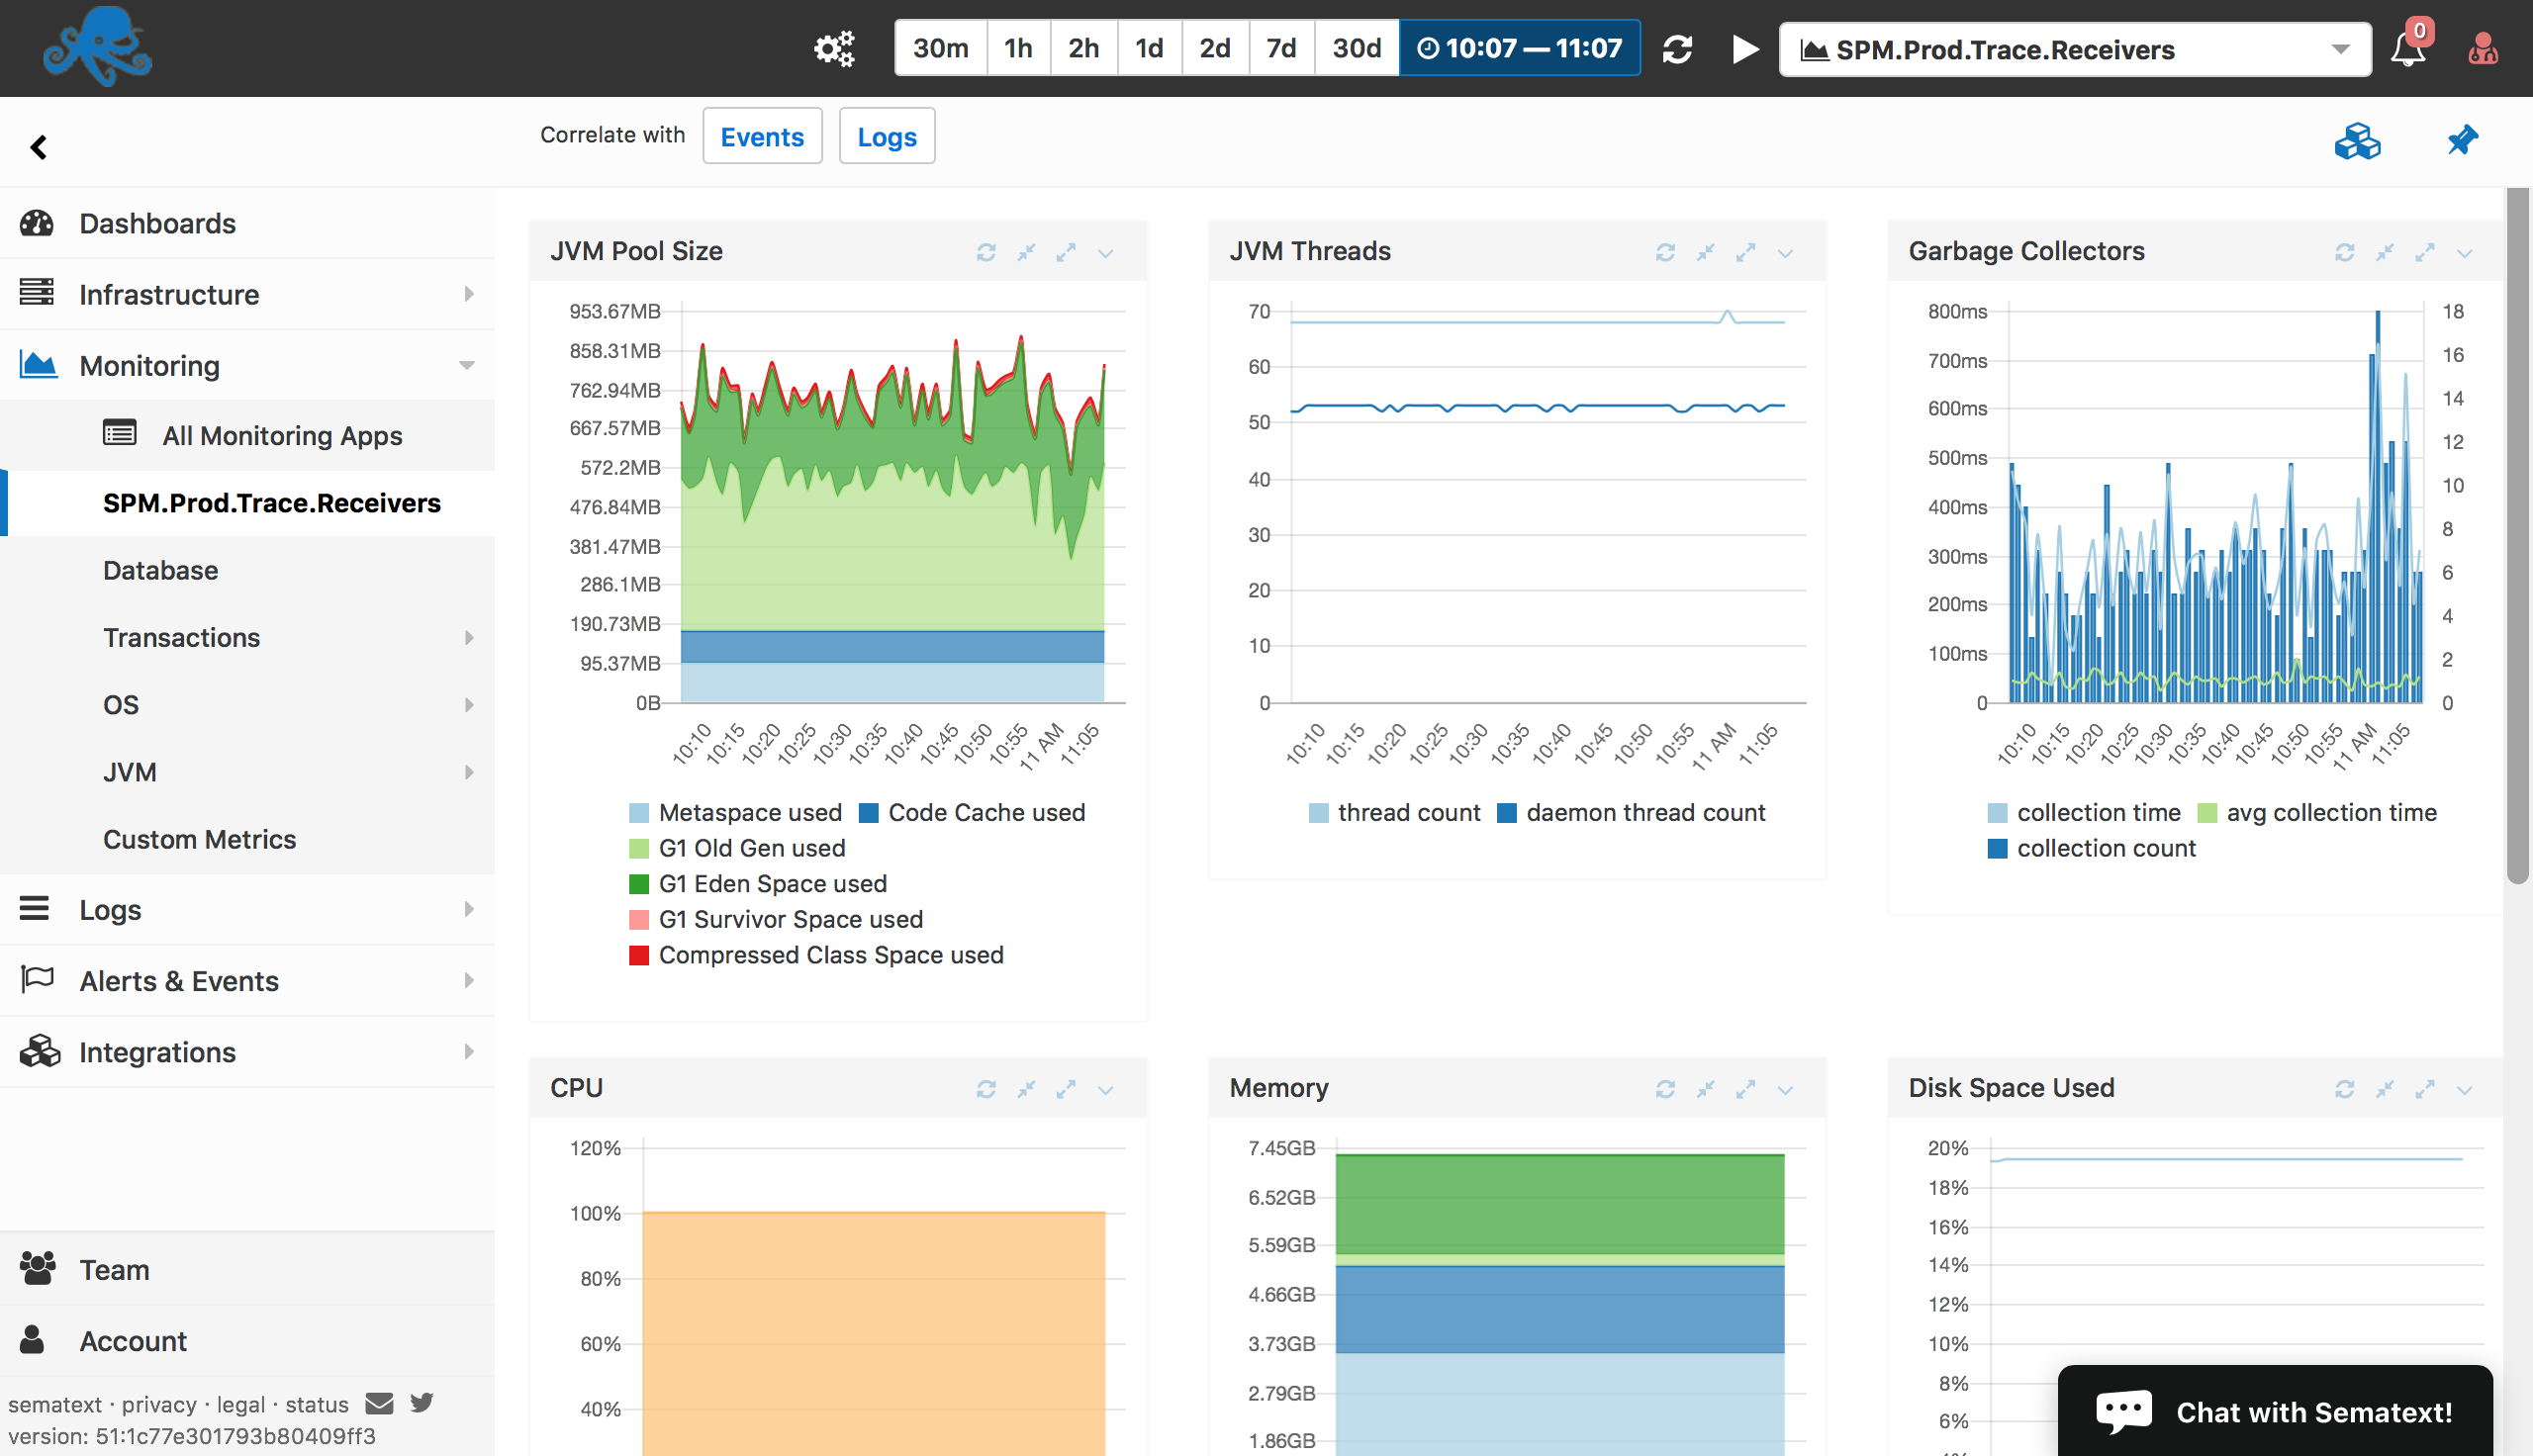
There is a lot more to our UI changes, some of which we’ve highlighted in Navigation, Discoverability, and Accessibility, but the best way to experience the goodness is by using Sematext Cloud yourself.
Enjoy! … and use our live chat (bottom-right) to shout if you see anything not working right.