Setting up and administering multiple servers for business and application purposes has become easier thanks to advancements in cloud technology. Today, enterprises are choosing to operate large numbers of servers both in the cloud and in their data centers to meet the ever-increasing demand. As a result of these changes, monitoring technologies have become crucial.
In this post, we’ll explore the best server monitoring tools and software currently on the market. We’ll also discuss how to choose the right monitoring tool for you.
What Is a Server Monitoring Software?
Server performance monitoring is the process of tracking the performance of how your server resources are being utilized by collecting and analyzing metrics. This is where monitoring software comes into play—it makes sure your applications run smoothly and that your servers have enough resources available to run their processes. This means it monitors certain key server components:
- CPU: The percentage of CPU utilization should ideally be peaking to its maximum only rarely, and the peaks should be short. If the CPU is maxed out frequently or very close to the max even during non-peak periods, it’s a sign the system doesn’t have much headroom.
- Used memory: If this indicator is reaching your memory limit, you might want to think about horizontally scaling your servers or adding more RAM.
- Storage: Being aware of disk storage utilization is crucial in production systems—if the disks run out of space, system crashes will ensue.
- Network: By monitoring network bandwidth and throughput, you can see how traffic is being delivered to your server.
Best Monitoring Tools for Servers
While there are many types of server management software, each one focuses on a different area of monitoring. In this section, we’ll discuss some of the best server monitoring tools and their standout features.
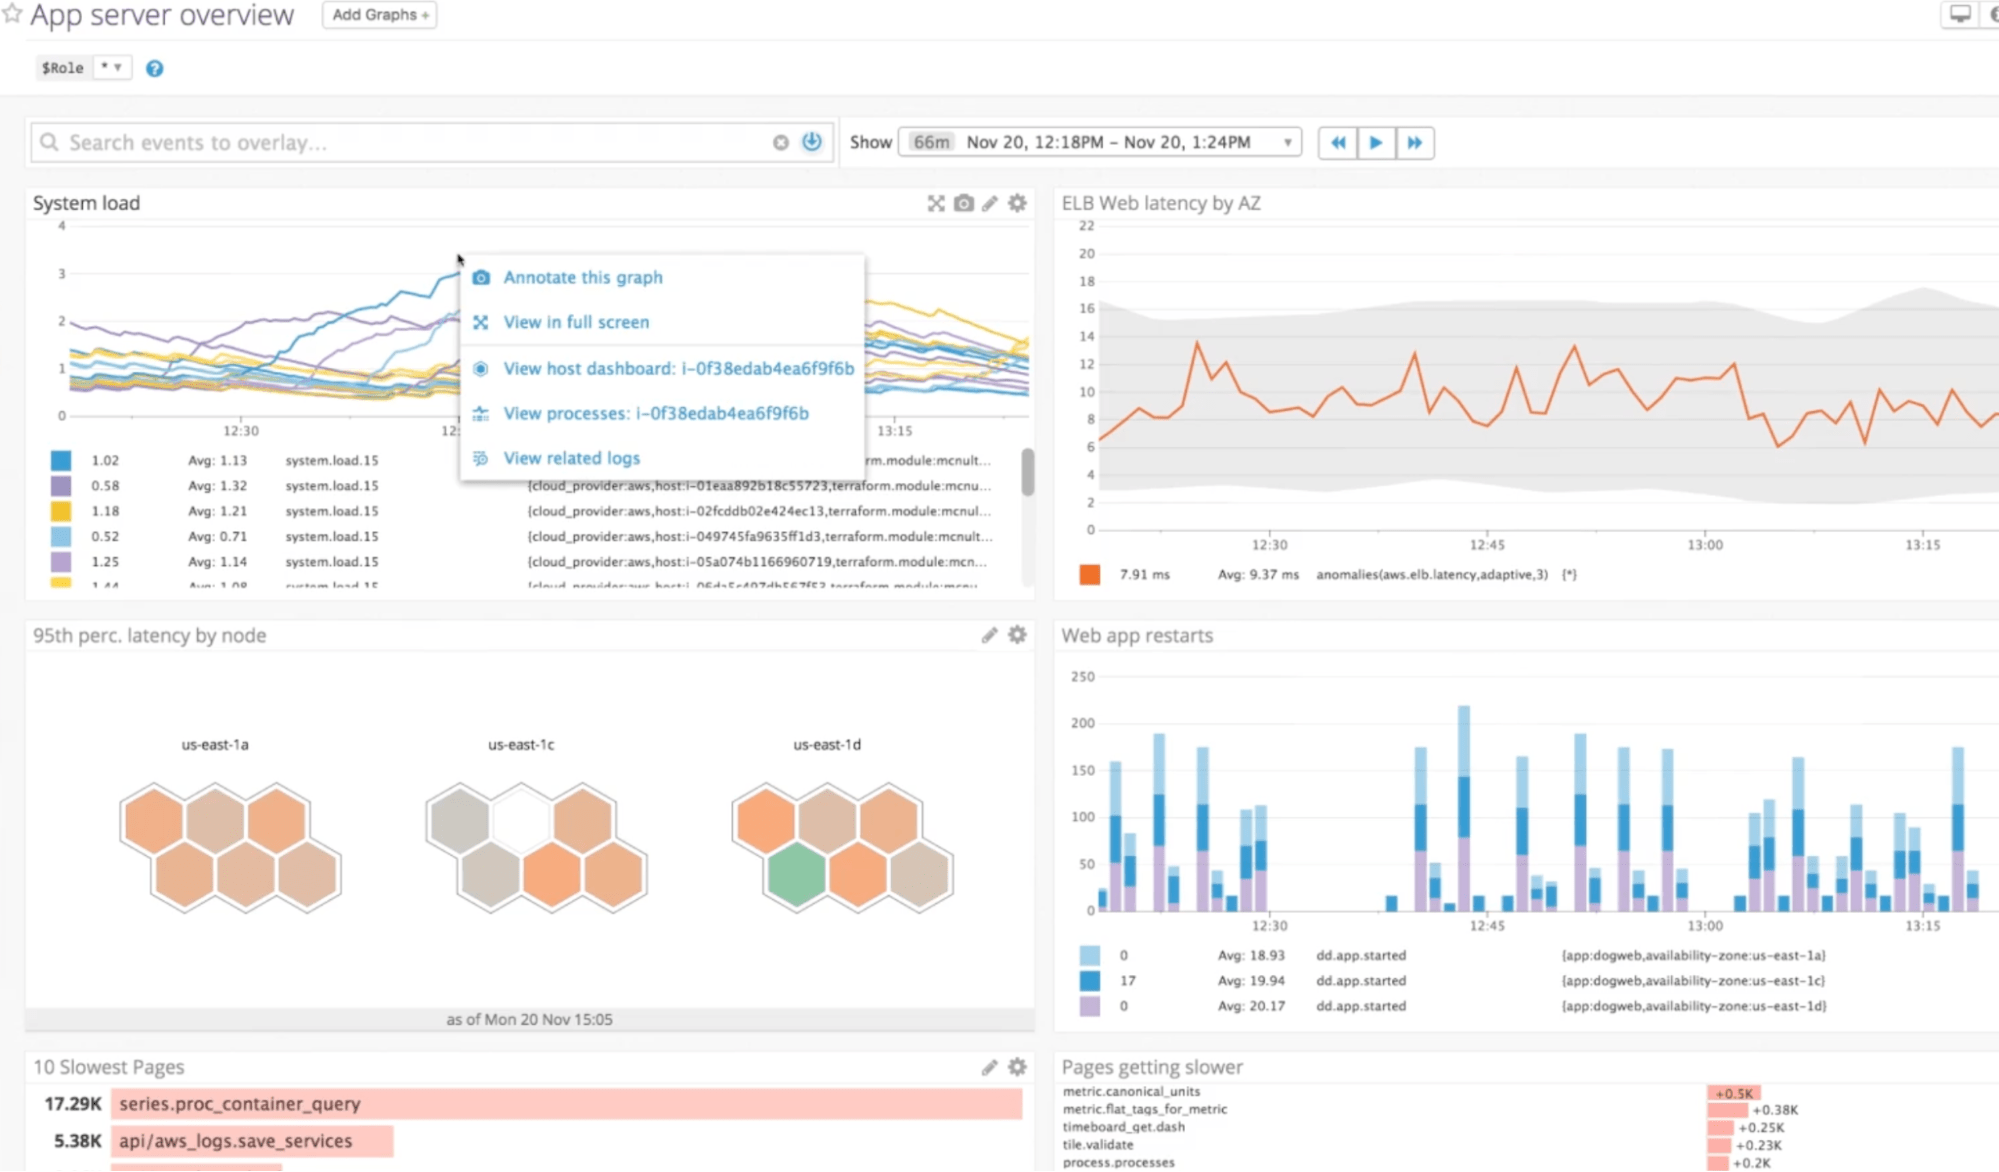
1. Sematext Monitoring
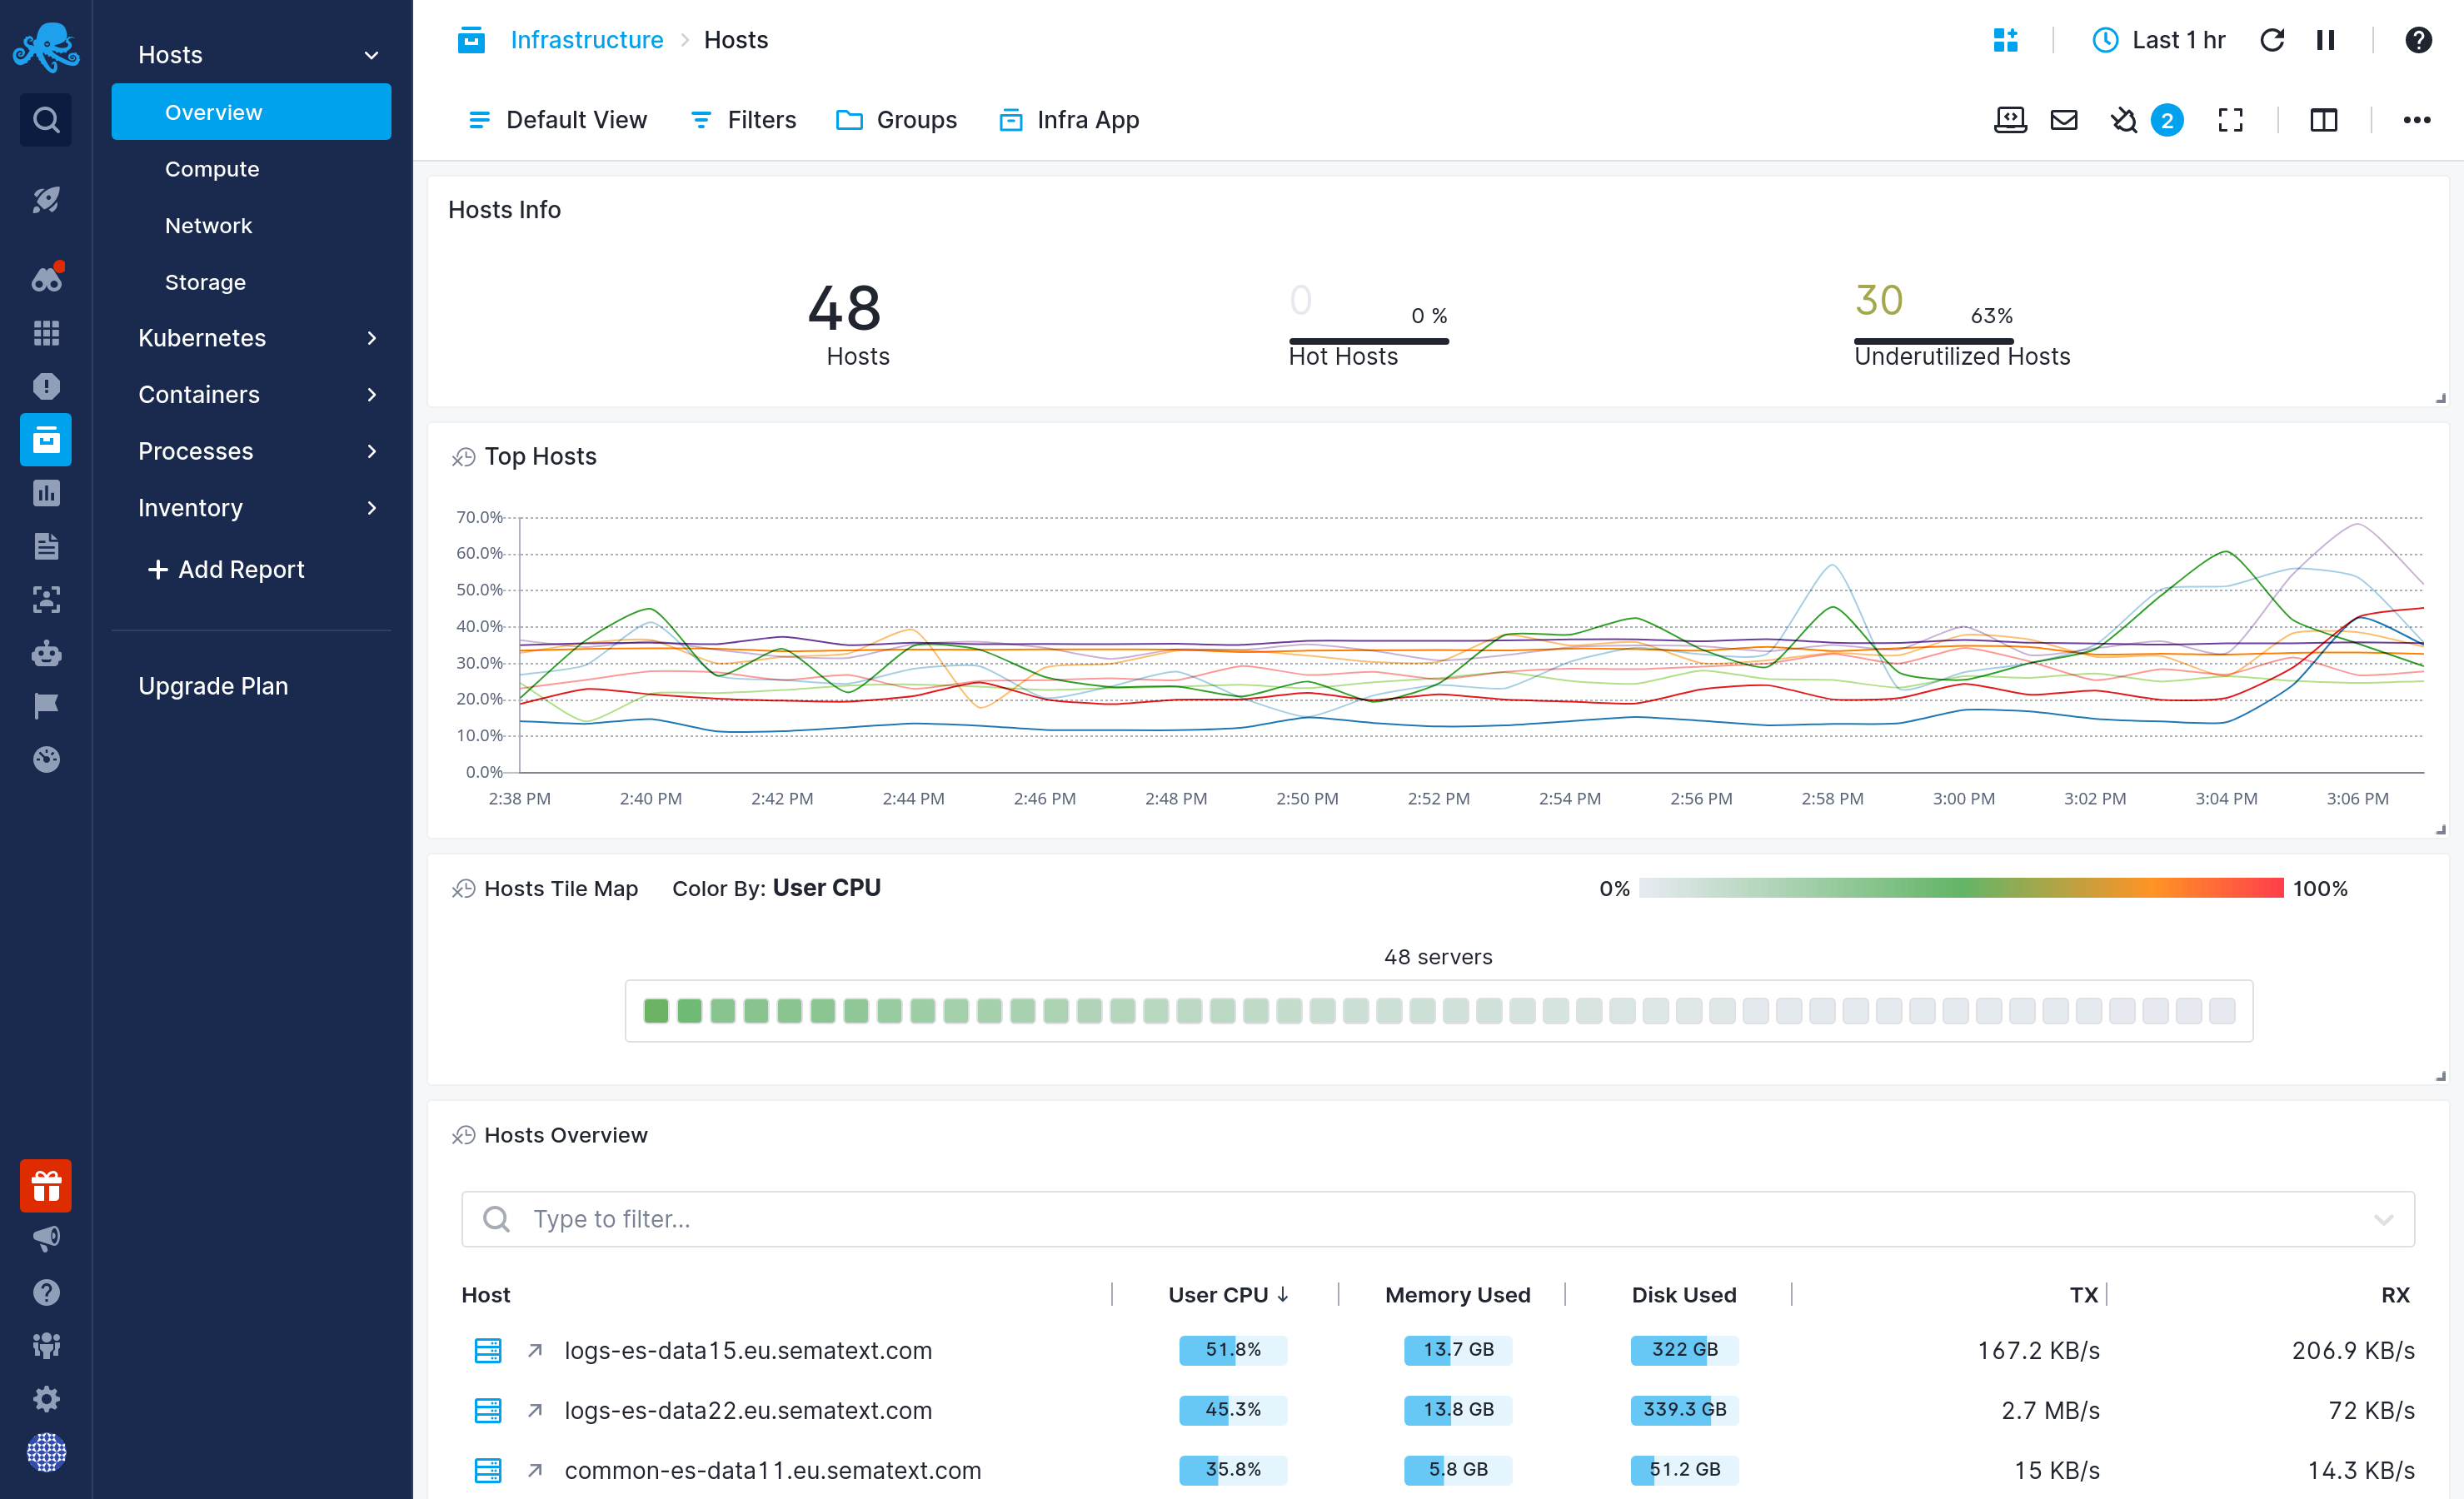
Sematext is a server monitoring solution that gives you everything you need in one place. Whether you have servers, applications, stacks in multi-cloud environments, or all of the above, sematext can monitor them.
Sematext collects all the server-related metrics you need, including:
- CPU
- Memory, Disk usage
- IO
- Network load
- Custom metrics
- and a whole lot more
Sematext gives you a quick bird’s-eye view of your entire infrastructure with an aggregate top-down perspective. It monitors all server processes, system packages, versions, installs and uninstalls, etc.
It’s important to note this server monitoring tool isn’t limited to monitoring system metrics.
Sematext also does log auto-discovery. Sematext will parse and enrich your logs with valuable metadata. This makes searching through your logs and correlating data an easy task in Sematext Cloud.
Sematext comes with pre-made alerts and dashboards for most technology stacks. You can also customize reports and components to visualize the metrics, events, and logs that matter most to you.
Set up personalized alerts and notifications to only be alerted by what’s important to you. Set parameters for each alert, like when to be notified or who should receive the notification. Let your whole team know or only a specific person via Slack, OpsGenie, MS Teams, and many more.
Pros
- Metric correlation between application performance and database traces and log analytics
- Support for integrations with all leading cloud providers, Kubernetes, containers, etc.
- Super simple GUI-based metric and log aggregation setup
- Support for anomaly detection and alerts
Cons
- Missing documentation for old agents
- Agents for specific integrations are not ideal for sending custom metrics. One may use other tools that support sending metrics to Sematext’s Influx Line Protocol-compatible API for metric ingestion.
- Limited support for transactional tracing
Pricing
Sematext provides a cost-effective pricing plan based on the number of nodes/agents operating in your system. Plus, it offers a 14-day no-strings-attached free trial.
Want to know more? Check out this short video below to see how Sematext Infrastructure Monitoring works, and how you can use it to monitor your server performance with ease.
2. Prometheus and Grafana
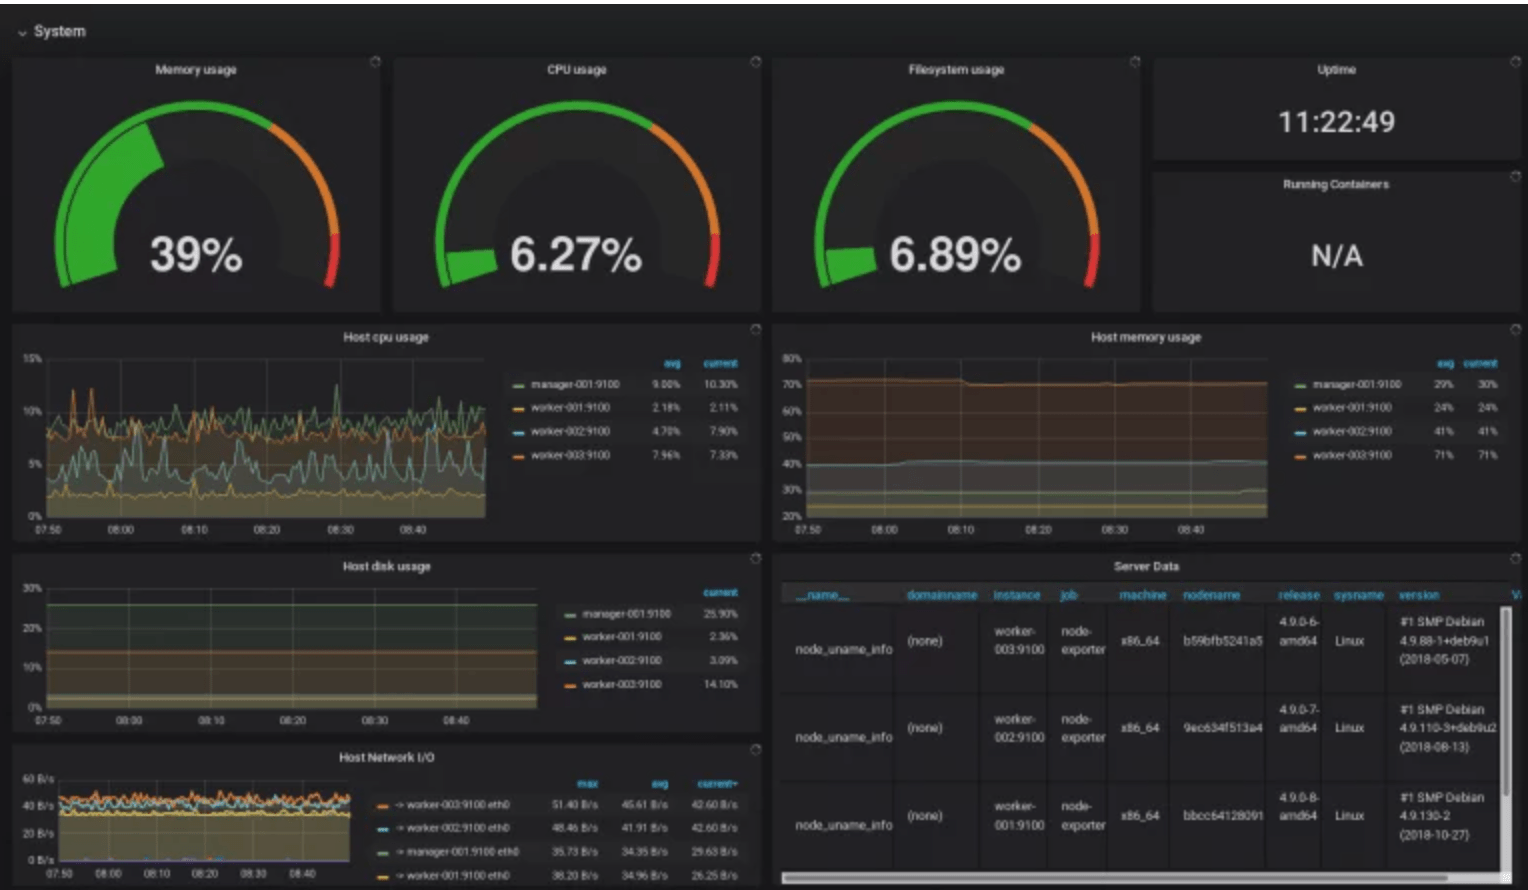
Prometheus and Grafana are two of the most well-known open-source monitoring tools currently available, very popular for server monitoring needs. You’ll need to install a slew of data-gathering agents known as exporters to send metrics to Prometheus, while Grafana lets you create stunning dashboards using those metrics.
Setting up a full-fledged server monitoring system using Prometheus and Grafana requires a good amount of configuration and complexity because this is a DIY solution. Still, if you have the right skills, it can be a piece of cake. One of the key benefits is that Prometheus will be running on your infrastructure, meaning you won’t be shipping your metrics to a third-party vendor.
Server monitoring alerts are supported by both Grafana and Prometheus, with multiple channel integrations including Slack, PagerDuty, Microsoft Teams, and a few others.
Prometheus and Grafana are a potent open-source combination giving you significant flexibility with a backend that provides excellent server performance monitoring.
Pros
- Free and open-source with a huge open-source community for support
- Automatic service discovery and support for both push and pull metric scraping models
- Support for custom metrics; huge number of exporters available to export metrics to Prometheus from different sources
Cons
- Complex and time-consuming to manage Prometheus instances; operational overhead if your staff is unfamiliar with the tool
- Need to manually configure and manage Prometheus exporters
- Manual setup required for graphs and alerts
Pricing
Prometheus and Grafana are free and open-source server monitoring tools.
3. SolarWinds Server & Application Manager
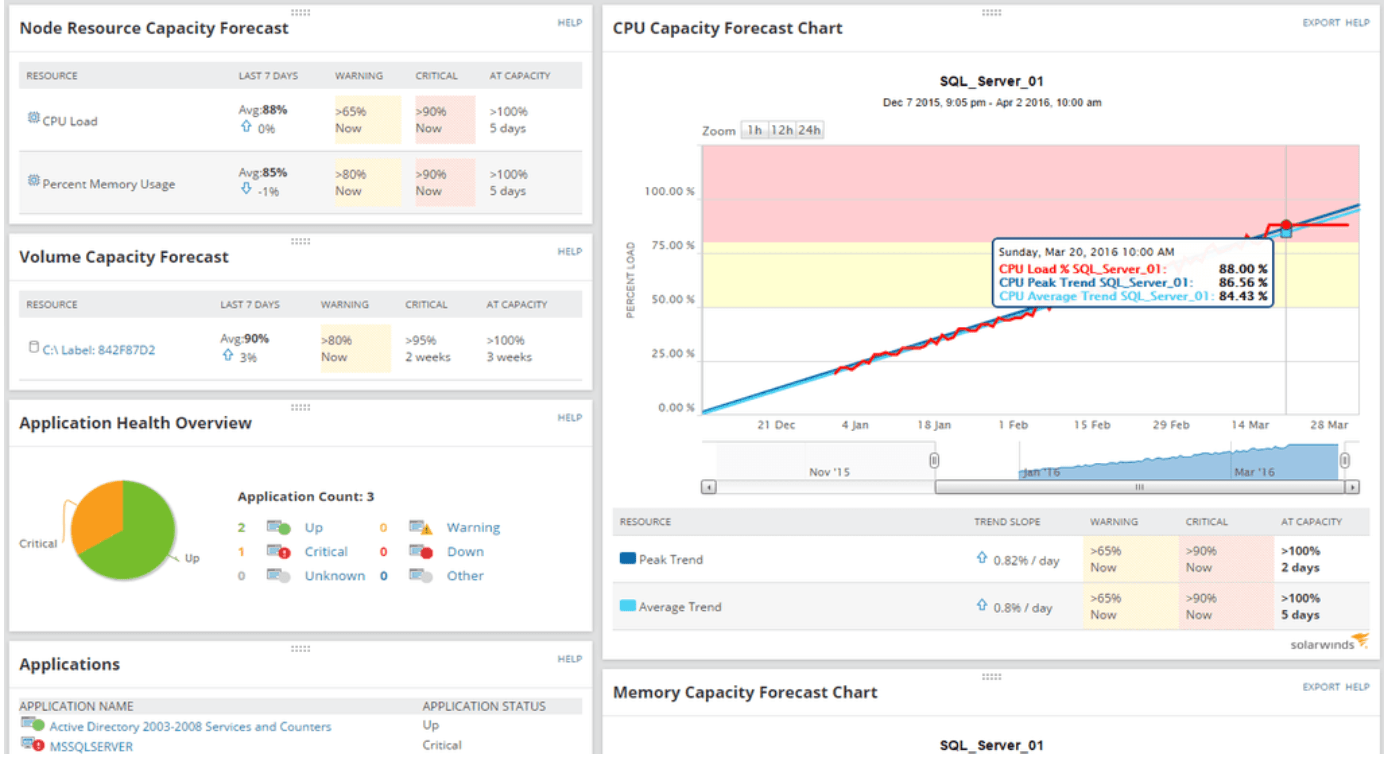
SolarWinds Server & Application Monitor is a reliable monitoring service for virtual servers across cloud, on-premise, or hybrid environments. Depending on your environment, it offers an understanding of your server usage metrics together with application performance metrics.
The solution is a fantastic candidate to monitor not just your servers but your entire infrastructure. Capabilities include automatic server services monitoring, remote server monitoring, server health monitoring, server application monitoring, server inventory monitoring, and server process monitoring. You get coverage for containers, databases, and applications with alerts and 1,200+ dashboards out of the box.
Pros
- End-to-end monitoring support with correlated metrics
- Automatic service discovery and application dependency mapping
- Support and recommendations for server capacity planning
Cons
- No anomaly detection for alerts
- No support for identity federation with LDAP
- Generic and limited reporting filters in the dashboard
Pricing
SolarWinds Server & Application Monitor charges on a per-host, per-month basis. There is also a 30-day free trial.
4. Dynatrace
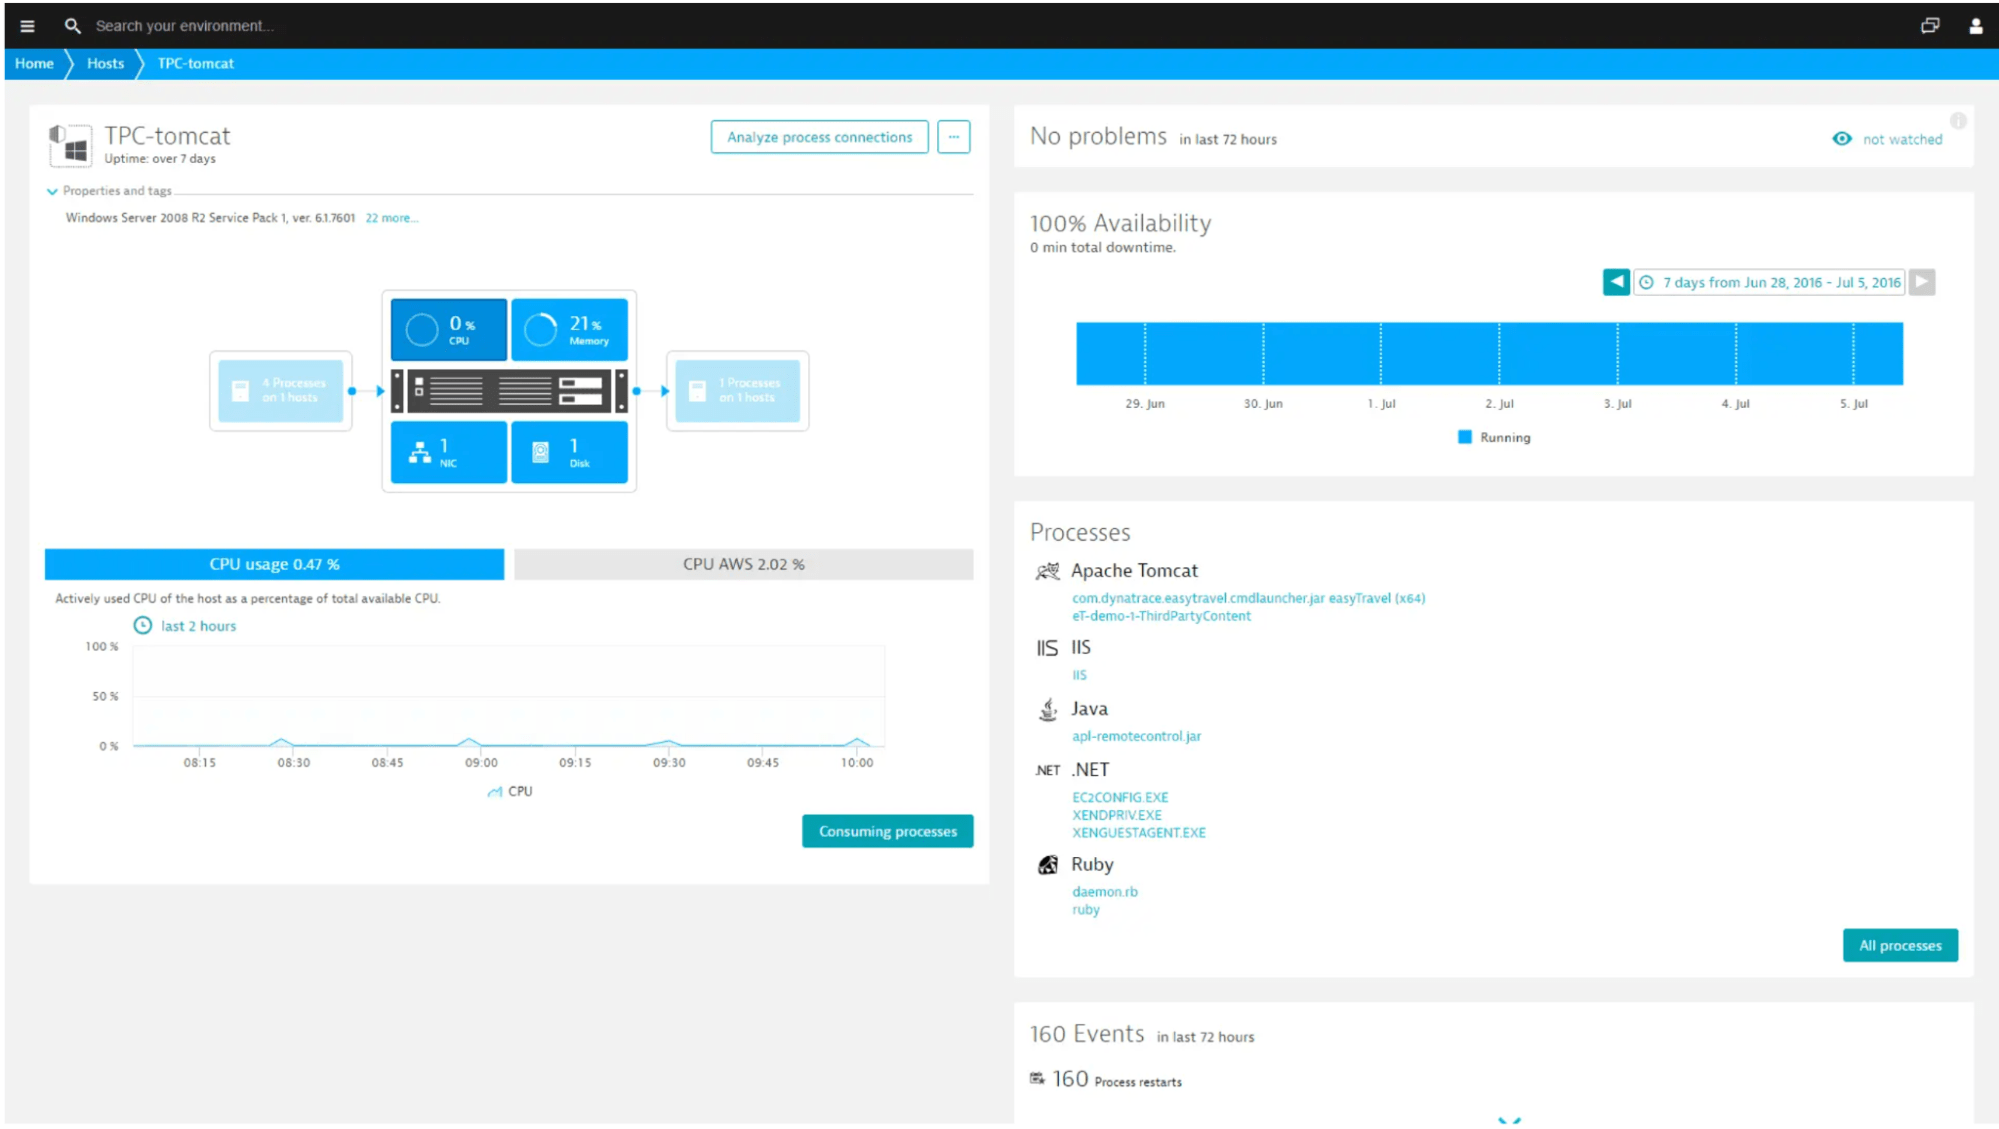
Dynatrace is a full-fledged server performance monitoring tool available in both software as a service (SaaS) and on-site models. With the ability to monitor server metrics as well as server logs, Dynatrace should meet most of your monitoring needs.
Setting up Dynatrace is relatively easy, as it takes just a few minutes to stream your metrics into beautiful dashboards to gain insights into your servers’ CPU, memory, and network health down to the process level.
One of the cool features of Dynatrace is that it can show you process-specific network metrics. It not only monitors your servers but also uses artificial intelligence to automatically understand the specifics of your entire application architecture, including the evaluation of availability and performance issues.
With minimal operational overhead and complexity, Dynatrace is an excellent monitoring solution for your organization’s infrastructure spread across multiple clouds.
Pros
- On-premises version available
- All-in-one platform with support for infrastructure, application performance, business analytics, and cloud automation
- AI-powered anomaly detection and alerts
Cons
- Some limited dashboard functionalities
- Complex to use, with additional training required
- Lagging documentation for the latest features released
Pricing
Dynatrace charges depending on the quantity of data ingested each month. A 15-day free trial is available.
Want to see how Sematext stacks up? Check out our page on Sematext vs Dynatrace. We also have a comprehensive comparison between all Dynatrace alternatives.
5. Datadog
Datadog is a server monitoring system for your infrastructure, apps, network, and logs. One of the standout features of Datadog is that it provides a unified view of monitoring with correlated metrics associated with server log discovery and traces. This is a convenient feature when you’re debugging performance issues on your servers. For example, by monitoring server metrics alongside application data, you can uncover hidden sources of lag, such as overburdened hosts or contested databases.
Installing Datadog is quite simple—you just have to install the metric collecting agent. As soon as the agent is set up, you can look at server health and monitoring metrics in real time via beautiful dashboards. Alerts are pretty standard, and you can minimize alert fatigue from noisy hosts by easily setting conditional alerts using a mixture of metrics, events, and other data sources.
Pros
- Support for log aggregation and analytics
- Support for anomaly detection and alerts
- Support for custom metrics and custom Datadog integrations
Cons
- No self-hosted solution
- Complex to use; can be overwhelming for new users
- Limited log analytics due to lack of support for JSON log processing
Pricing
Datadog’s price is variable and usually determined by the number of agents/hosts installed on your system; you also have to purchase each feature individually. You can use it for free for 14 days and monitor an unlimited number of servers.
Want to see how Sematext stacks up? Check out our page on Sematext vs Datadog. Additionally, you should familiarize yourself with all the alternatives to Datadog and how they compare to it.
6. New Relic
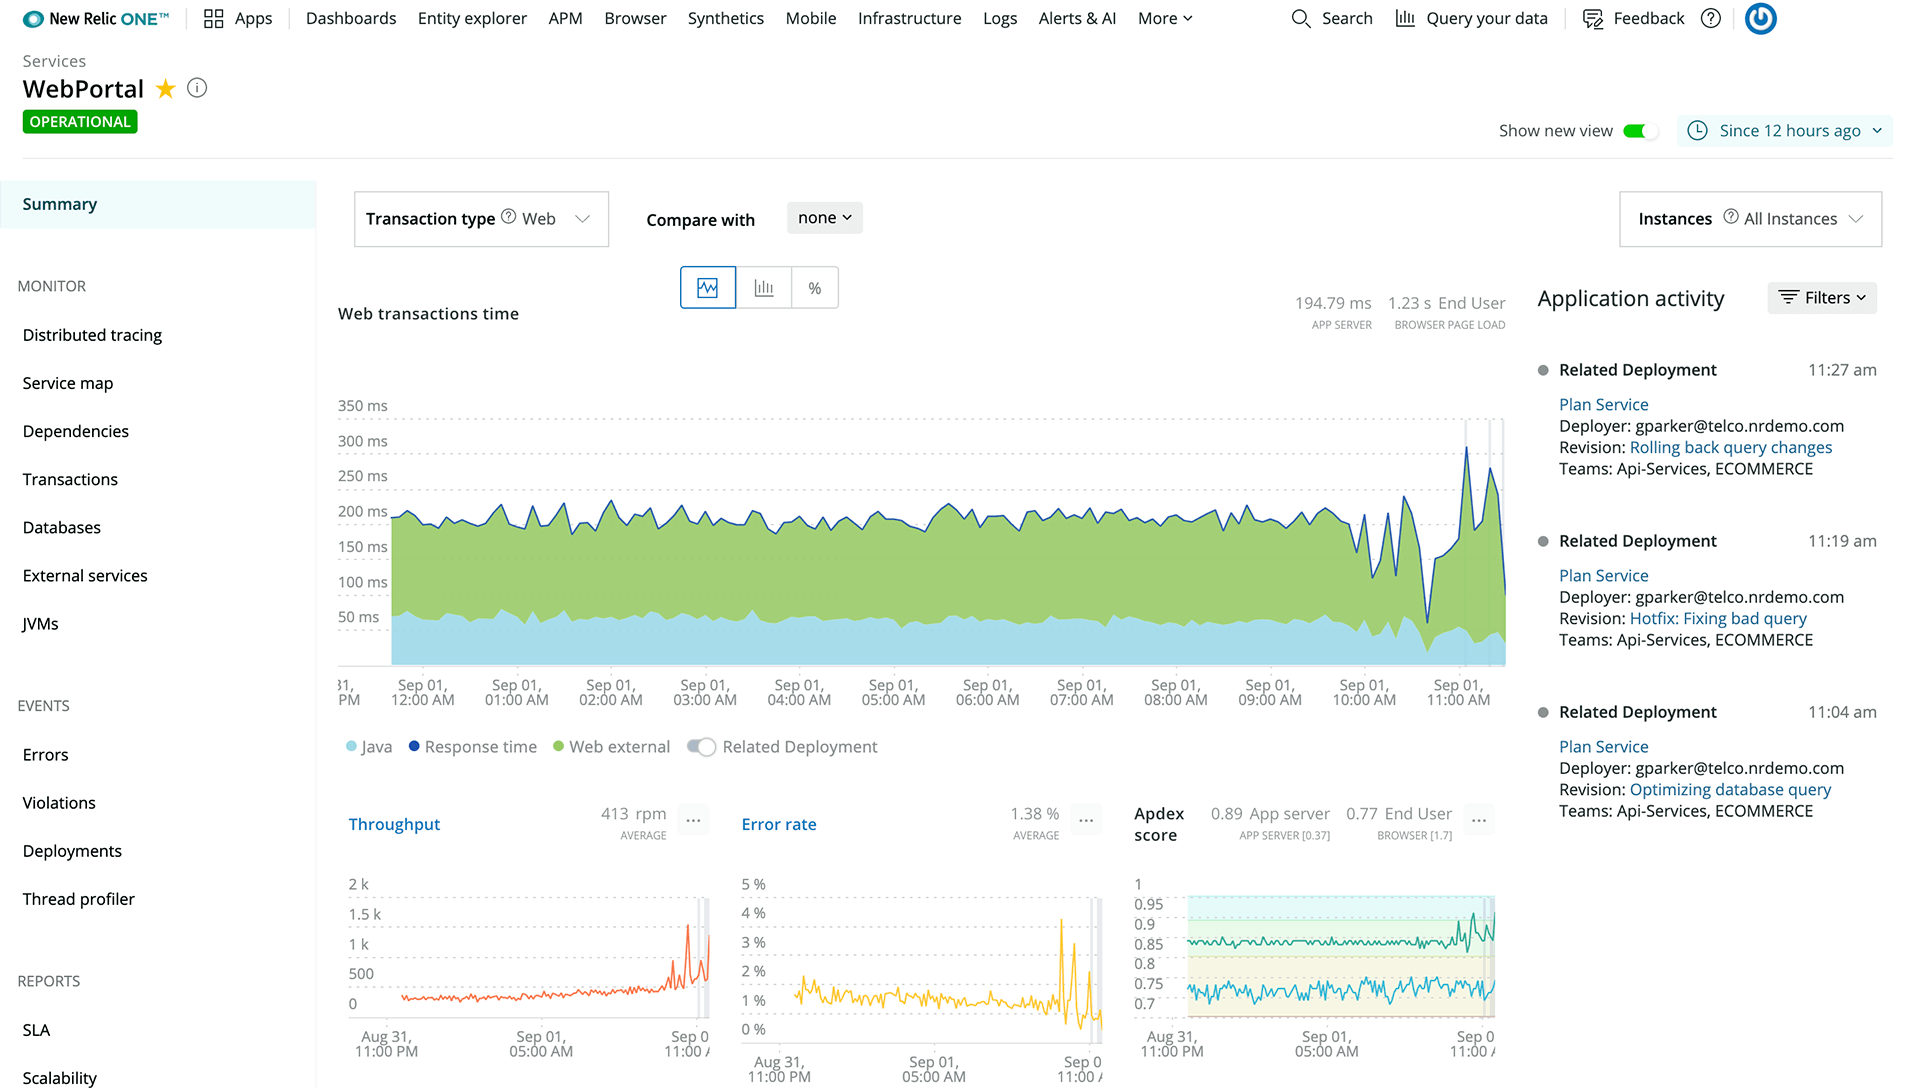
New Relic gives you a complete insight into your whole infrastructure in one location. One of the newer monitoring tools introduced with a greater focus on container and server monitoring, New Relic combines all of your correlated metrics into one data plane, enabling you to pursue a line of inquiry with just a few clicks and to see precisely how everything connects.
It has an open and flexible integration framework that enables it to integrate and support various systems, including Prometheus, Kubernetes, AWS, Azure, GCP, MySQL, NGINX, Apache Kafka, Apache Cassandra, and many more.
Setting up New Relic’s server monitoring software takes less than five minutes, and you can gain immediate insights into your system. Customization is pretty straightforward with its out-of-the-box integrations with other systems and easy-to-use SDK. If most of your workloads are related to Kubernetes and containers, New Relic is an excellent choice to monitor your infrastructure.
Pros
- Support for correlated metrics
- Proactive anomaly detection and alerts
- Integrations available for leading cloud providers; support for open standards
Cons
- No self-hosted solution
- Steep learning curve
- Less control over alert management
- Pricing model that charges by users and by data
Pricing
New Relic offers a different package each month according to the quantity of data ingested as well as the number of users. The unlimited free plan allows for 100 GB of data intake per month.
Want to see how Sematext stacks up? Check out our page on Sematext vs New Relic.
7. ManageEngine OpManager
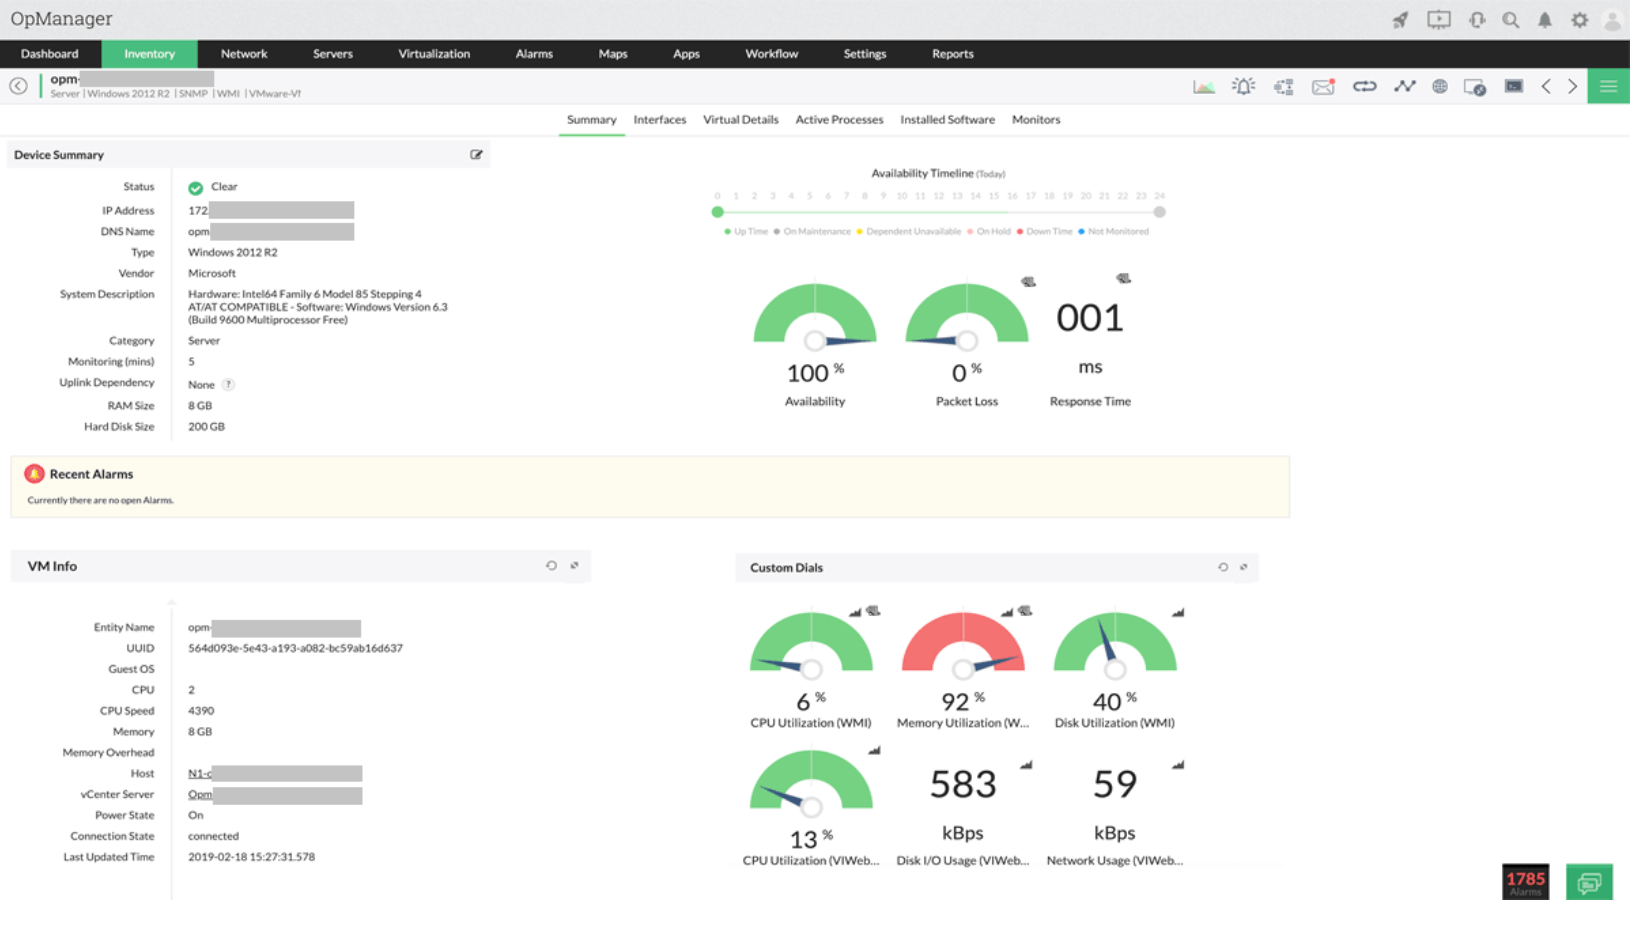
ManageEngine OpManager is an easy and economical server performance monitoring software with more focus given to the network. It includes sophisticated server and network monitoring capabilities, such as network traffic flow visualization and end-to-end server network monitoring. One interesting feature is that if your organization uses VoIP, ManageEngine OpManager can simply monitor and report on VoIP performance on your servers, providing insights on how to enhance it.
You also get monitoring support for any physical device with a network connection and an IP address such as servers, switches, routers, load balancers, firewalls, printers, and storage devices.
ManageEngine OpManager constantly monitors your network and gives comprehensive insights into and control over it. If your organization has a strong emphasis on network monitoring, especially if it is telco-based, ManageEngine OpManager is a great fit.
Pros
- End-to-end network monitoring
- Monitoring for physical devices, e.g., routers and switches
- Monitors and troubleshoots VoIP performance
Cons
- No cloud-based SaaS version available
- Application performance monitoring and network correlation not available
- Operational overhead due to managing continuous patch updates
Pricing
ManageEngine OpManager’s price is determined by each customer’s needs. There is a free version that lets you monitor up to three devices.
8. AppDynamics
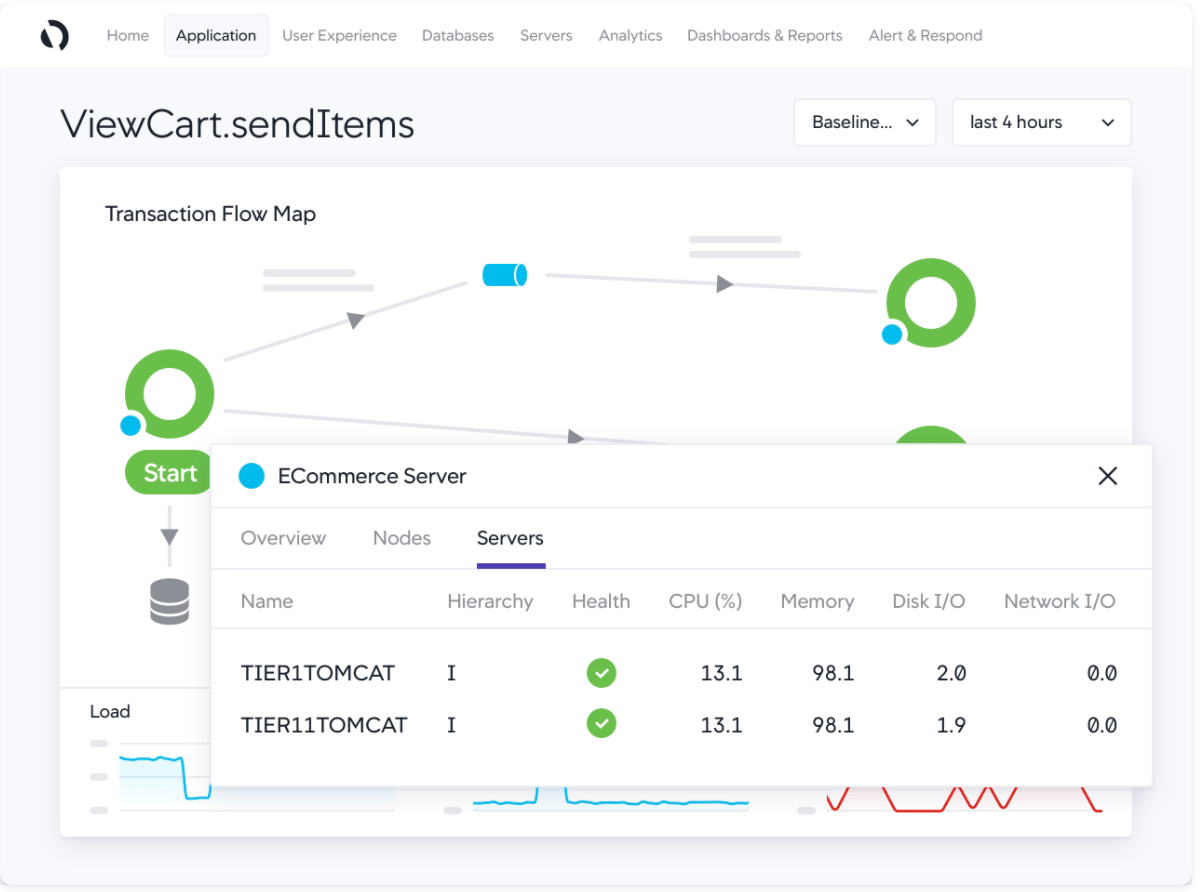
AppDynamics is a business-first observability platform that accelerates your digital transformation with the insights you need most for server performance and application monitoring. It enables you to identify application server performance issues that may impact business performance, along with correlated server and application metrics to view the full picture of how your cloud investments are facilitating business.
With a comprehensive set of dashboards and metrics, AppDynamics supports fine-grained alerts, which can be integrated with third-party alerting and incident management tools such as ServiceNow, PagerDuty, and Jira.
If your company is more business-driven, AppDynamics is a good solution. Most stakeholders are always searching for economic value in every digital infrastructure investment they make. AppDynamics’ business-first mentality allows stakeholders to see how their cloud infrastructure investments impact business KPIs like revenue with correlated application and server performance metrics.
Pros
- Correlation of application performance metrics with server and network performance metrics
- Anomaly detection and alerts
- Business-first observability platform with capacity-planning recommendations
Cons
- Steep learning curve required for advanced features
- Inadequate tutorials and documentation
- Self-hosted version not available
Pricing
AppDynamics charges you per CPU core. A 15-day free trial is available.
Want to see how Sematext stacks up? Check out our page on Sematext vs AppDynamics.
9. Sensu Go
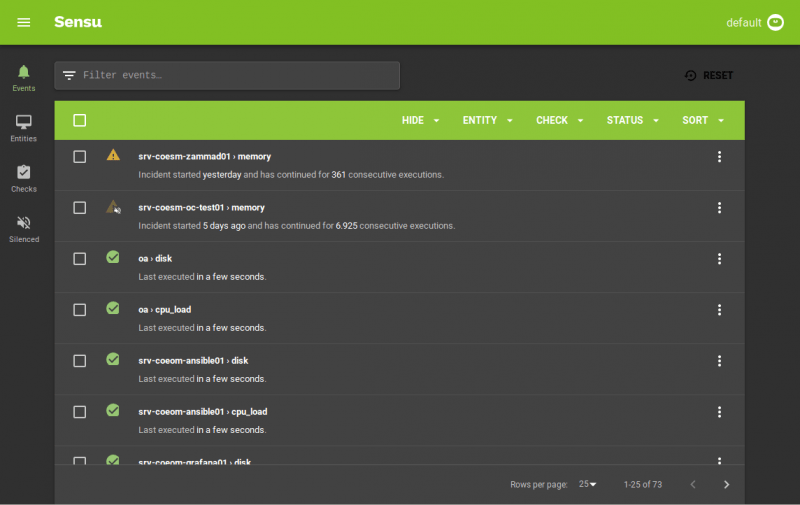
Sensu Go is an observability platform that supports server performance metrics and allows you to address gaps in monitoring visibility of correlations between metrics, logging, and tracing. Existing monitoring technologies such as Nagios, StatsD, Telegraf, Prometheus, and others can be integrated into Sensu seamlessly.
One of the key features of Sensu Go is its ability to support monitoring as code. It lets you define monitoring workflows using declarative configuration files shared with team members, as well as write tests, perform version control, edit, and review in a proper GitOps manner.
Supporting multiple clouds and all their related infrastructure, Sensu is one of the best server monitoring solutions if your organization observes GitOps principles and treats everything as code.
Pros
- Support for monitoring as code, good for GitOps practices
- Support for all leading cloud providers
- Can be integrated with existing monitoring platforms like Prometheus, Nagios, and others that support open standards
Cons
- Lacking documentation and support for community plugins
- Complex UI; learning curve to manage
- Inadequate documentation
Pricing
Sensu Go is entirely free up to 100 nodes; following that, there are subscriptions to various node bundles.
10. Nagios XI
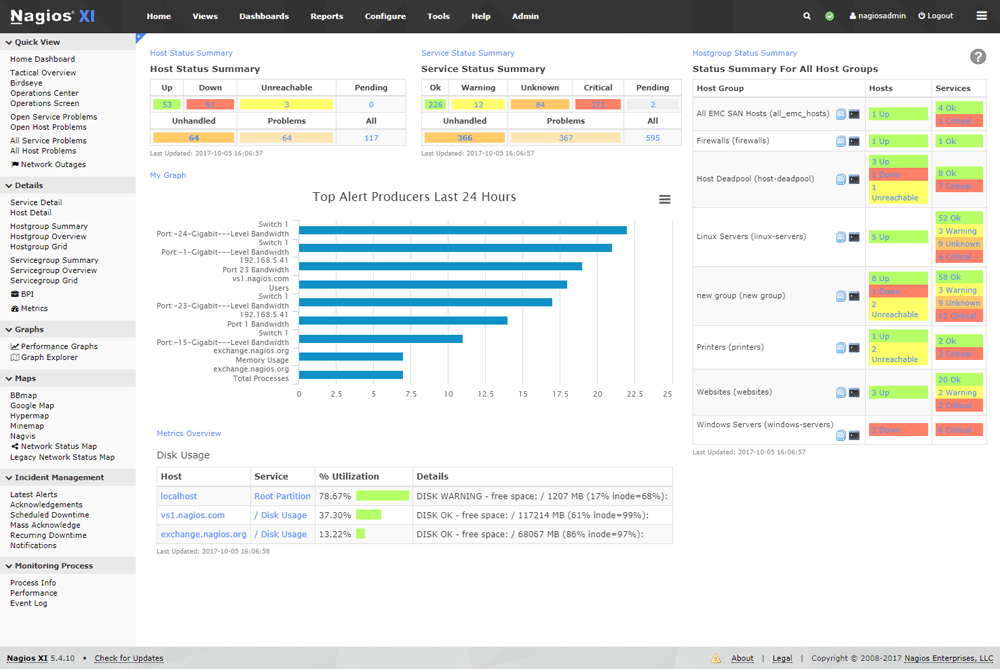
Nagios XI is a comprehensive software for monitoring enterprise servers and networks. The business version of Nagios, Nagios XI was created on top of the open-source version and has more functionality and requires less administration time. Nagios focuses primarily on server metrics, application performance, and network traffic. It collects data via the use of agents placed on both the network elements and the components it monitors.
Nagios can also connect to network switches or other components by querying their status using the Simple Network Management Protocol (SNMP). It communicates with and collects data from Windows-based products using the Windows Management Instrumentation (WMI) protocol.
Nagios is available as a downloadable bundle with specific packages for each product running on Windows or Linux. Following the tool’s download and installation, you need to go through a series of initial setups. Once the agents have been deployed, data should begin coming into Nagios and its standard dashboards.
The solution is highly customizable and can scale out of the box, making it a perfect fit for many enterprises. This high customizability does, however, come with additional complexity and maintenance overhead.
Pros
- Support for network-related components like routers, switches, and other physical hardware
- Highly customizable; supports custom metrics
- Supports monitoring both Windows and Linux servers
Cons
- Limited set of default dashboards
- Complex UI; configuration not very user friendly
- Maintenance and operational overhead
Pricing
Nagios XI is free for small environments, but after seven monitoring nodes, you need an annual license for support and Nagios server maintenance.
Which Is the Best Server Monitoring Tool for You
There are plenty of server performance monitoring tools available on the market—both open-source and SaaS models. At the end of the day, they all get the job done. Choosing the right one depends on your organization’s requirements and the resources—effort and money—you have to invest. Below are a few key areas to keep in mind when choosing an enterprise monitoring solution.
Metric Coverage
This is a no-brainer. Your monitoring solution needs to be able to collect and analyze all the metrics that are important to you. Some tools only support a few metrics, and some support a large number of metrics that you don’t really need. You also have to be able to configure the metrics you do need and customize them to match your requirements.
Less Configuration Overhead
While DIY tools sound exciting and fun, they can be frustrating when things don’t work out. For an enterprise monitoring solution, you need to look for a solution that is easy to set up, requires less maintenance, and has most of your needs covered via its default settings for alerts and dashboards.
Correlation of Metrics
Even if a tool supports all the metrics you need, it is cumbersome if there is no correlation between them, especially when debugging a problem. Having proper correlation between metrics can save you a lot of time and help you drill down to the root cause of your problem within minutes.
Anomaly Detection
Sometimes, it is not really feasible to give a static threshold for a given metric to fire an alert. Sometimes, you might not even know an alert is needed until something goes wrong. Tools with anomaly detection capabilities, integrated with machine learning and artificial intelligence, will automate and configure most alerts for you.
Identity Federation and Access Control
Enterprises often have teams dedicated to observability. User access management and fine-tuned access control are required to run a tight ship. Most enterprises have their own identity management tools with SSO functionality, and it is very important for the solution you select to support those tools either via LDAP or SAML.
Total Cost of Ownership
SaaS solutions for monitoring have become widely popular today, as managing and maintaining enterprise-level monitoring platforms by yourself on-premises can be very costly and time-consuming—not to mention the complexities of DIY monitoring to make sure your platform is running as expected. It is best to offload your monitoring to a SaaS and take the complexity and operational overhead away.
Server Monitoring Tools Comparison Table
| Server Monitoring Tools | Metric Coverage | Configuration | Metric Correlation | Anomaly Detection | IAM and Federation | On-Premises Support | Key Standout Points |
|---|---|---|---|---|---|---|---|
| Sematext | Configurable | Easy and straightforward | Metrics, traces, events, logs | Custom | LDAP and SAML | No | Full-rounded observability platform Support for remote server monitor |
| Prometheus | Configurable | Complex and operational overhead | Not available | No | No | Yes | Open-source and cloud-native |
| SolarWinds Server & Application Manager | Configurable | Average | Metrics, traces | No | SAML | No | Automatic service discovery and application dependency mapping |
| Dynatrace | Configurable | Complex with a learning curve | Metrics, traces | Automatic, powered by AI | LDAP and SAML | Yes | Process-specific network metrics AI-powered features |
| Datadog | Configurable | Complex with a learning curve | Metrics, traces, logs | Yes | LDAP and SAML | No | Correlated metric dashboards with drill-down views |
| New Relic | Limited | Complex with a learning curve | Metrics, traces | No | LDAP and SAML | No | Supports third-party system integrations such as Prometheus, Jaeger, Zipkin, etc Focus is more on container application performance monitoring |
| ManageEngine OpManager | Limited | Average | Not available | Custom | LDAP and SAML | No | More focused on network monitoring with support for physical network devices such as switches, routers, etc. |
| AppDynamics | Configurable | Easy and straightforward | Metrics, traces | Automatic, powered by AI | Yes | No | Business-first observability platform |
| Sensu Go | Limited | Average | No | No | No | Yes | Open-source, GitOps support |
| Nagios XI | Limited | Complex, operational overhead | Not available | No | No | Yes | Monitoring support for physical network devices, such as routers and switches |
Wrap-Up
Real-time server monitoring is required to keep your applications running smoothly. A comprehensive understanding of your server’s status and its effect on your architecture is essential. In fact, operating an in-house monitoring system is expensive and has a high operational overhead that is frequently underestimated. Monitoring using a SaaS solution allows for cost savings and operational compliance. With quicker debugging, you can prevent revenue loss due to a severe bug or performance problem affecting your commercial services.
Of all the server performance tools discussed in this article, Sematext is an all-around winner for any enterprise monitoring needs—whether for on-premises or multi-cloud servers. With easy set-up and out-of-the-box templates for dashboards and alerts, Sematext lets you fill your organization’s monitoring gaps within minutes. I recommend a comprehensive monitoring solution like Sematext Monitoring to get the monitoring support you need for your servers, network, cloud infrastructure, logs, databases, and application performance. Give it a try and see for yourself!
You might also be interested in:
Author Bio

Nilesh Jayanandana
Nilesh is an accomplished Software Architect with over eight years of industry experience. Skilled in developing full-stack applications, cloud computing, DevOps, and SRE. Expert in all things related to Kubernetes and the Cloud Native stack. He is passionate about assisting the community by sharing information via media articles and speaking at community events. Nilesh is now working as an architect on the development of an iPaaS solution based on Kubernetes.