As shown in Part 1, key Solr metrics to monitor, the setup, tuning, and operations of Solr require deep insights into the performance metrics such as request rate and latency, JVM memory utilization, garbage collector work time and count and many more. Sematext provides an excellent alternative to other Solr monitoring tools.
How Sematext Saves you Time, Work and Costs
Here are a few things you will NOT have to do when using Sematext for Solr monitoring:
- figure out which metrics to collect and which ones to ignore
- give metrics meaningful labels
- hunt for metric descriptions in the docs so that you know what each one actually shows
- build charts to group metrics that you really want on the same charts, not several separate charts
- figure out which aggregation to use for each set of metrics (min? max? avg? something else?)
- set up basic alert rules
All of the above is not even a complete story. Do you want to collect Solr logs? How about structuring them? Sematext does all this automatically for you!
In this post we will look at how Sematext provides more comprehensive – and easy to set up – monitoring for Solr and other technologies in your infrastructure.
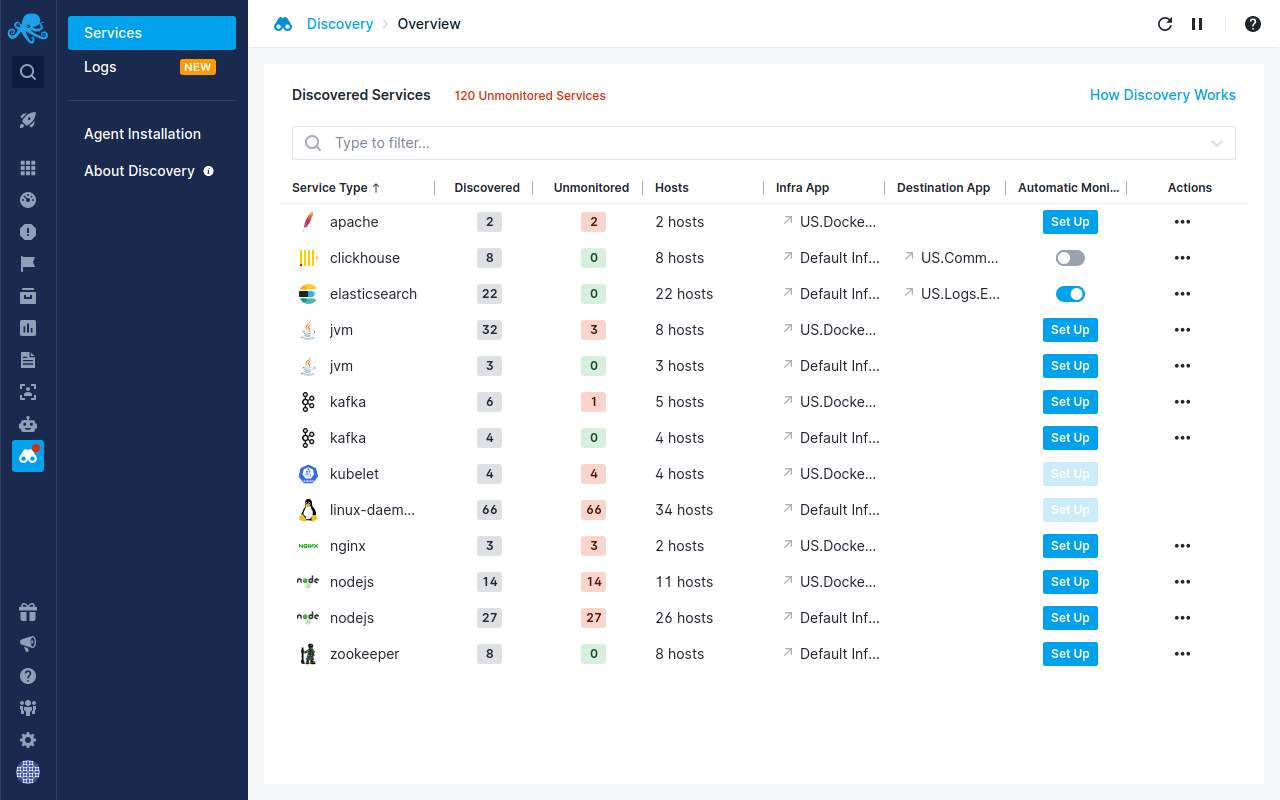
Sematext’s auto-discovery of services lets you automatically start monitoring your Solr services and logs directly through the user interface.
By combining events, logs, and metrics together in one integrated full stack observability platform and using the Sematext open-source monitoring agent and its integrations, which are also open-source, you can monitor your whole infrastructure and apps, not just Solr. You can also get deeper visibility into your entire software stack by collecting, processing, and analyzing your logs.
Solr Monitoring
Collecting Solr Metrics
Sematext Solr integration collects over 30 different Solr metrics for various caches, requests, latency and much more. JVM monitoring is included, too. Sematext maintains and supports official Solr monitoring integration. Moreover, the Sematext Solr integration is customizable and open source.
Bottom line: you don’t need to deal with configuring the agent for metrics collection, which is the first huge time saver!
Installing Monitoring Agent
Setting up the monitoring agent takes less than 5 minutes:
Step 1. Create a Solr App in the Integrations / Overview (or Sematext Cloud Europe). This will let you install the agent and control access to your monitoring and logs data. The short What is an App in Sematext Cloud video has more details.
Step 2. Name your Solr monitoring App and, if you want to collect Solr logs as well, create a Logs App along the way.
Step 3. Install the Sematext Agent according to the setup instructions displayed in the UI.
For example, on Ubuntu, add Sematext Linux packages with the following command:
echo "deb http://pub-repo.sematext.com/ubuntu sematext main" | sudo tee
/etc/apt/sources.list.d/sematext.list > /dev/null
wget -O - https://pub-repo.sematext.com/ubuntu/sematext.gpg.key | sudo apt-key add -
sudo apt-get update
sudo apt-get install spm-client
Then setup Solr monitoring by preparing Solr server connection details:
sudo bash /opt/spm/bin/setup-sematext  \
    --monitoring-token <your-monitoring-token-goes-here>   \
    --app-type solr  \
    --agent-type javaagent  \
    --infra-token <your-infra-token-goes-here>
Finally, adjust your solr.in.sh file:
SOLR_OPTS="$SOLR_OPTS -Dcom.sun.management.jmxremote
-javaagent:/opt/spm/spm-monitor/lib/spm-monitor-generic.jar=::default"
Step 4. Go grab a drink… but hurry – Solr metrics will start appearing in your charts in less than a minute.
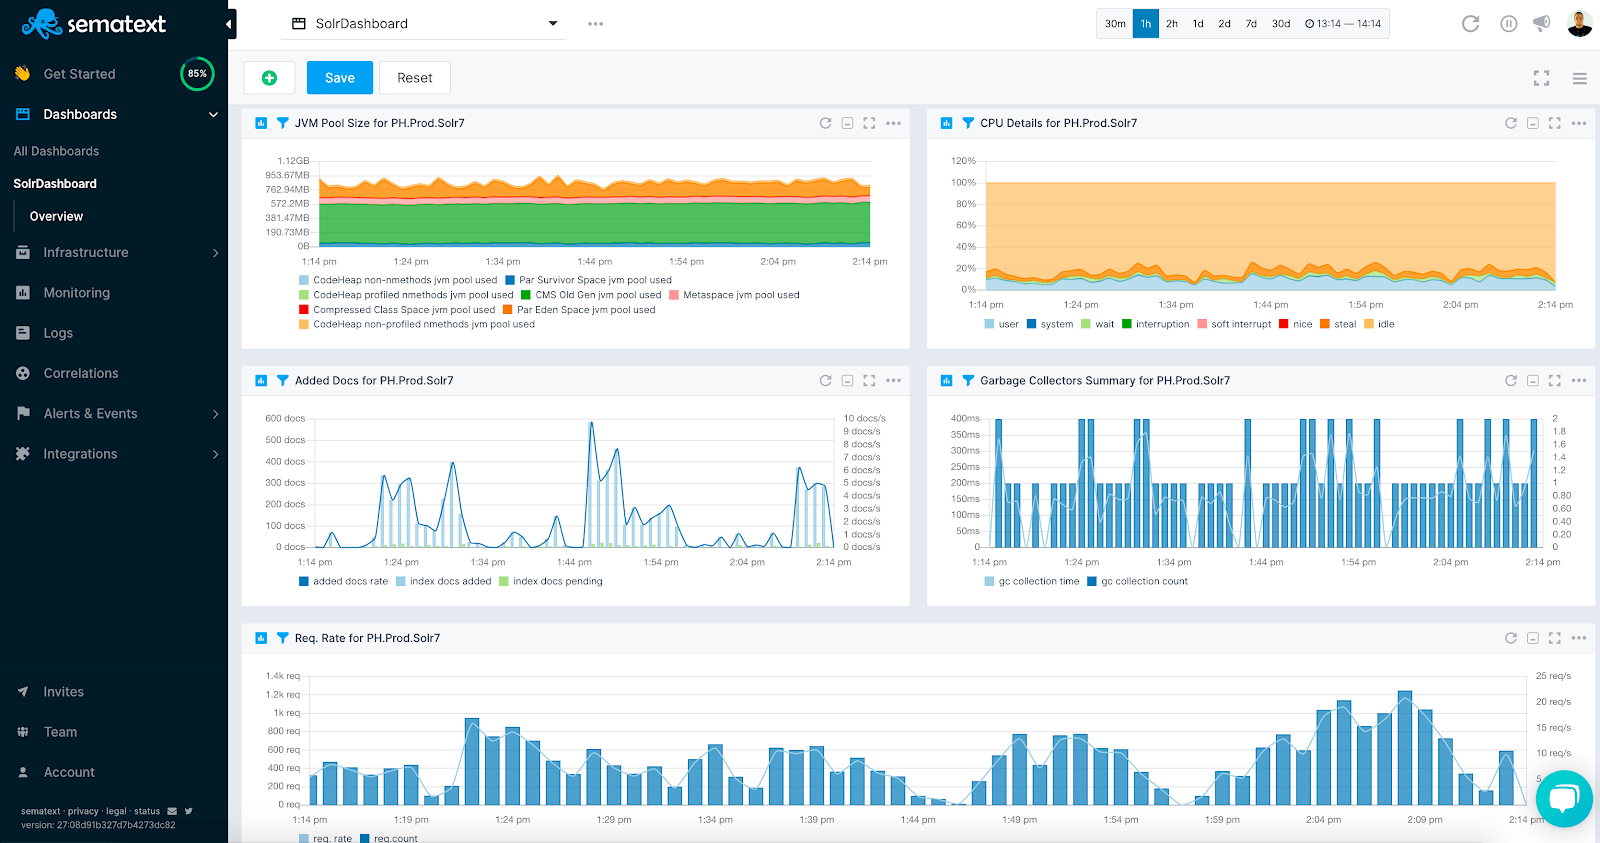
Solr Monitoring Dashboard
When you open the Solr App you’ll find a predefined set of dashboards that organize more than 60 Solr metrics and general server monitoring in predefined charts grouped into an intuitively organized set of monitoring dashboards:
- Overview with charts for all key Solr metrics
- Operating System metrics such as CPU, memory, network, disk usage, etc.
- Solr metrics
- Request Rate & Latency: requests per second, requests latencies, including percentiles
- Index Size: Solr data size, file system statistics
- Indexing: Added documents, delete by identifier, delete by queries, commit events, other events such as update errors or expunge deletes
- Cache: Query result cache, document cache, filter cache, and per segment filter cache metrics
- Warmup: Searcher and caches warmup times
Solr key metrics in Sematext Cloud
Setup Solr Alerts
To save you time Sematext automatically creates a set of default alert rules such as alerts for low disk space. You can create additional alerts on any metric. Watch Alerts in Sematext Cloud for more details.
Alerting on Solr Metrics
There are 3 types of alerts in Sematext:
- Heartbeat alerts, which notify you when a Solr server is down
- Classic threshold-based alerts that notify you when a metric value crosses a pre-defined threshold
- Alerts based on statistical anomaly detection that notify you when metric values suddenly change and deviate from the baseline
Let’s see how to actually create some alert rules for Request Rate metrics in the animation below. The Request Rate chart shows a drop in the number of requests. We normally have above three requests per second, but we can see that it drops to zero. We would like to be notified about such situations. To create an alert rule on a metric we’d go to the pull down in the top right corner of a chart and choose “Create alert”. The alert rule applies the filters from the current view and you can choose various notification options such as email or configured notification hooks (PagerDuty, Slack, VictorOps, BigPanda, OpsGenie, Pushover, generic webhooks, etc.). Alerts are triggered either by anomaly detection, watching metric changes in a given time window or through the use of classic threshold-based alerts.
Alert creation for Solr Request Rate
Monitoring Solr Logs
Shipping Solr Logs
Since having logs and metrics in one platform makes troubleshooting simpler and faster let’s use the Sematext Solr Logs Integration, too. You can use many log shippers, but we’ll use Logagent because it’s lightweight, easy to set up and because it can parse and structure logs out of the box. The log parser extracts timestamp, severity, and messages. For query traces, the log parser also extracts the unique query ID to group logs related to query execution.
Step 1. Create a Solr Logs App to obtain an App token
Step 2. Install Logagent npm package
sudo npm i -g @sematext/logagent
If you don’t have Node, you can install it easily. E.g. On Debian/Ubuntu:
curl -sL https://deb.nodesource.com/setup_14.x | sudo -E bash -
sudo apt-get install -y nodejs
Step 2. Install Logagent service by specifying the logs token and the path to Solr log files.
You can include /var/solr/logs/solr.log to ship only logs from Solr server. To do this, you’d create a logagent.conf like this:
# Global options
options:
  # print stats every 60 seconds
  printStats: 60
  # don't write parsed logs to stdout
  suppress: true

input:
  files:
    - /var/solr/logs/solr.log

output:
  elasticsearch:
    module: elasticsearch
    # logsene-receiver.eu.sematext.com for the EU region
    url: https://logsene-receiver.sematext.com
    indices:
      # send Solr logs to this Logs App
      YOUR_LOGS_APP_TOKEN_GOES_HERE:
        - .*solr.*\.log
Finally, use logagent-setup to install a Systemd script using the configuration you just created:
sudo logagent-setup -c /path/to/logagent.conf
Note, if you run Solr in containers, setup Logagent for container logs.
Log Search and Dashboards
One you have logs in Sematext you can search them when troubleshooting, save queries you run frequently or create your individual logs dashboard. Though there are some predefined dashboards as well. Here’s the first one, Overview:
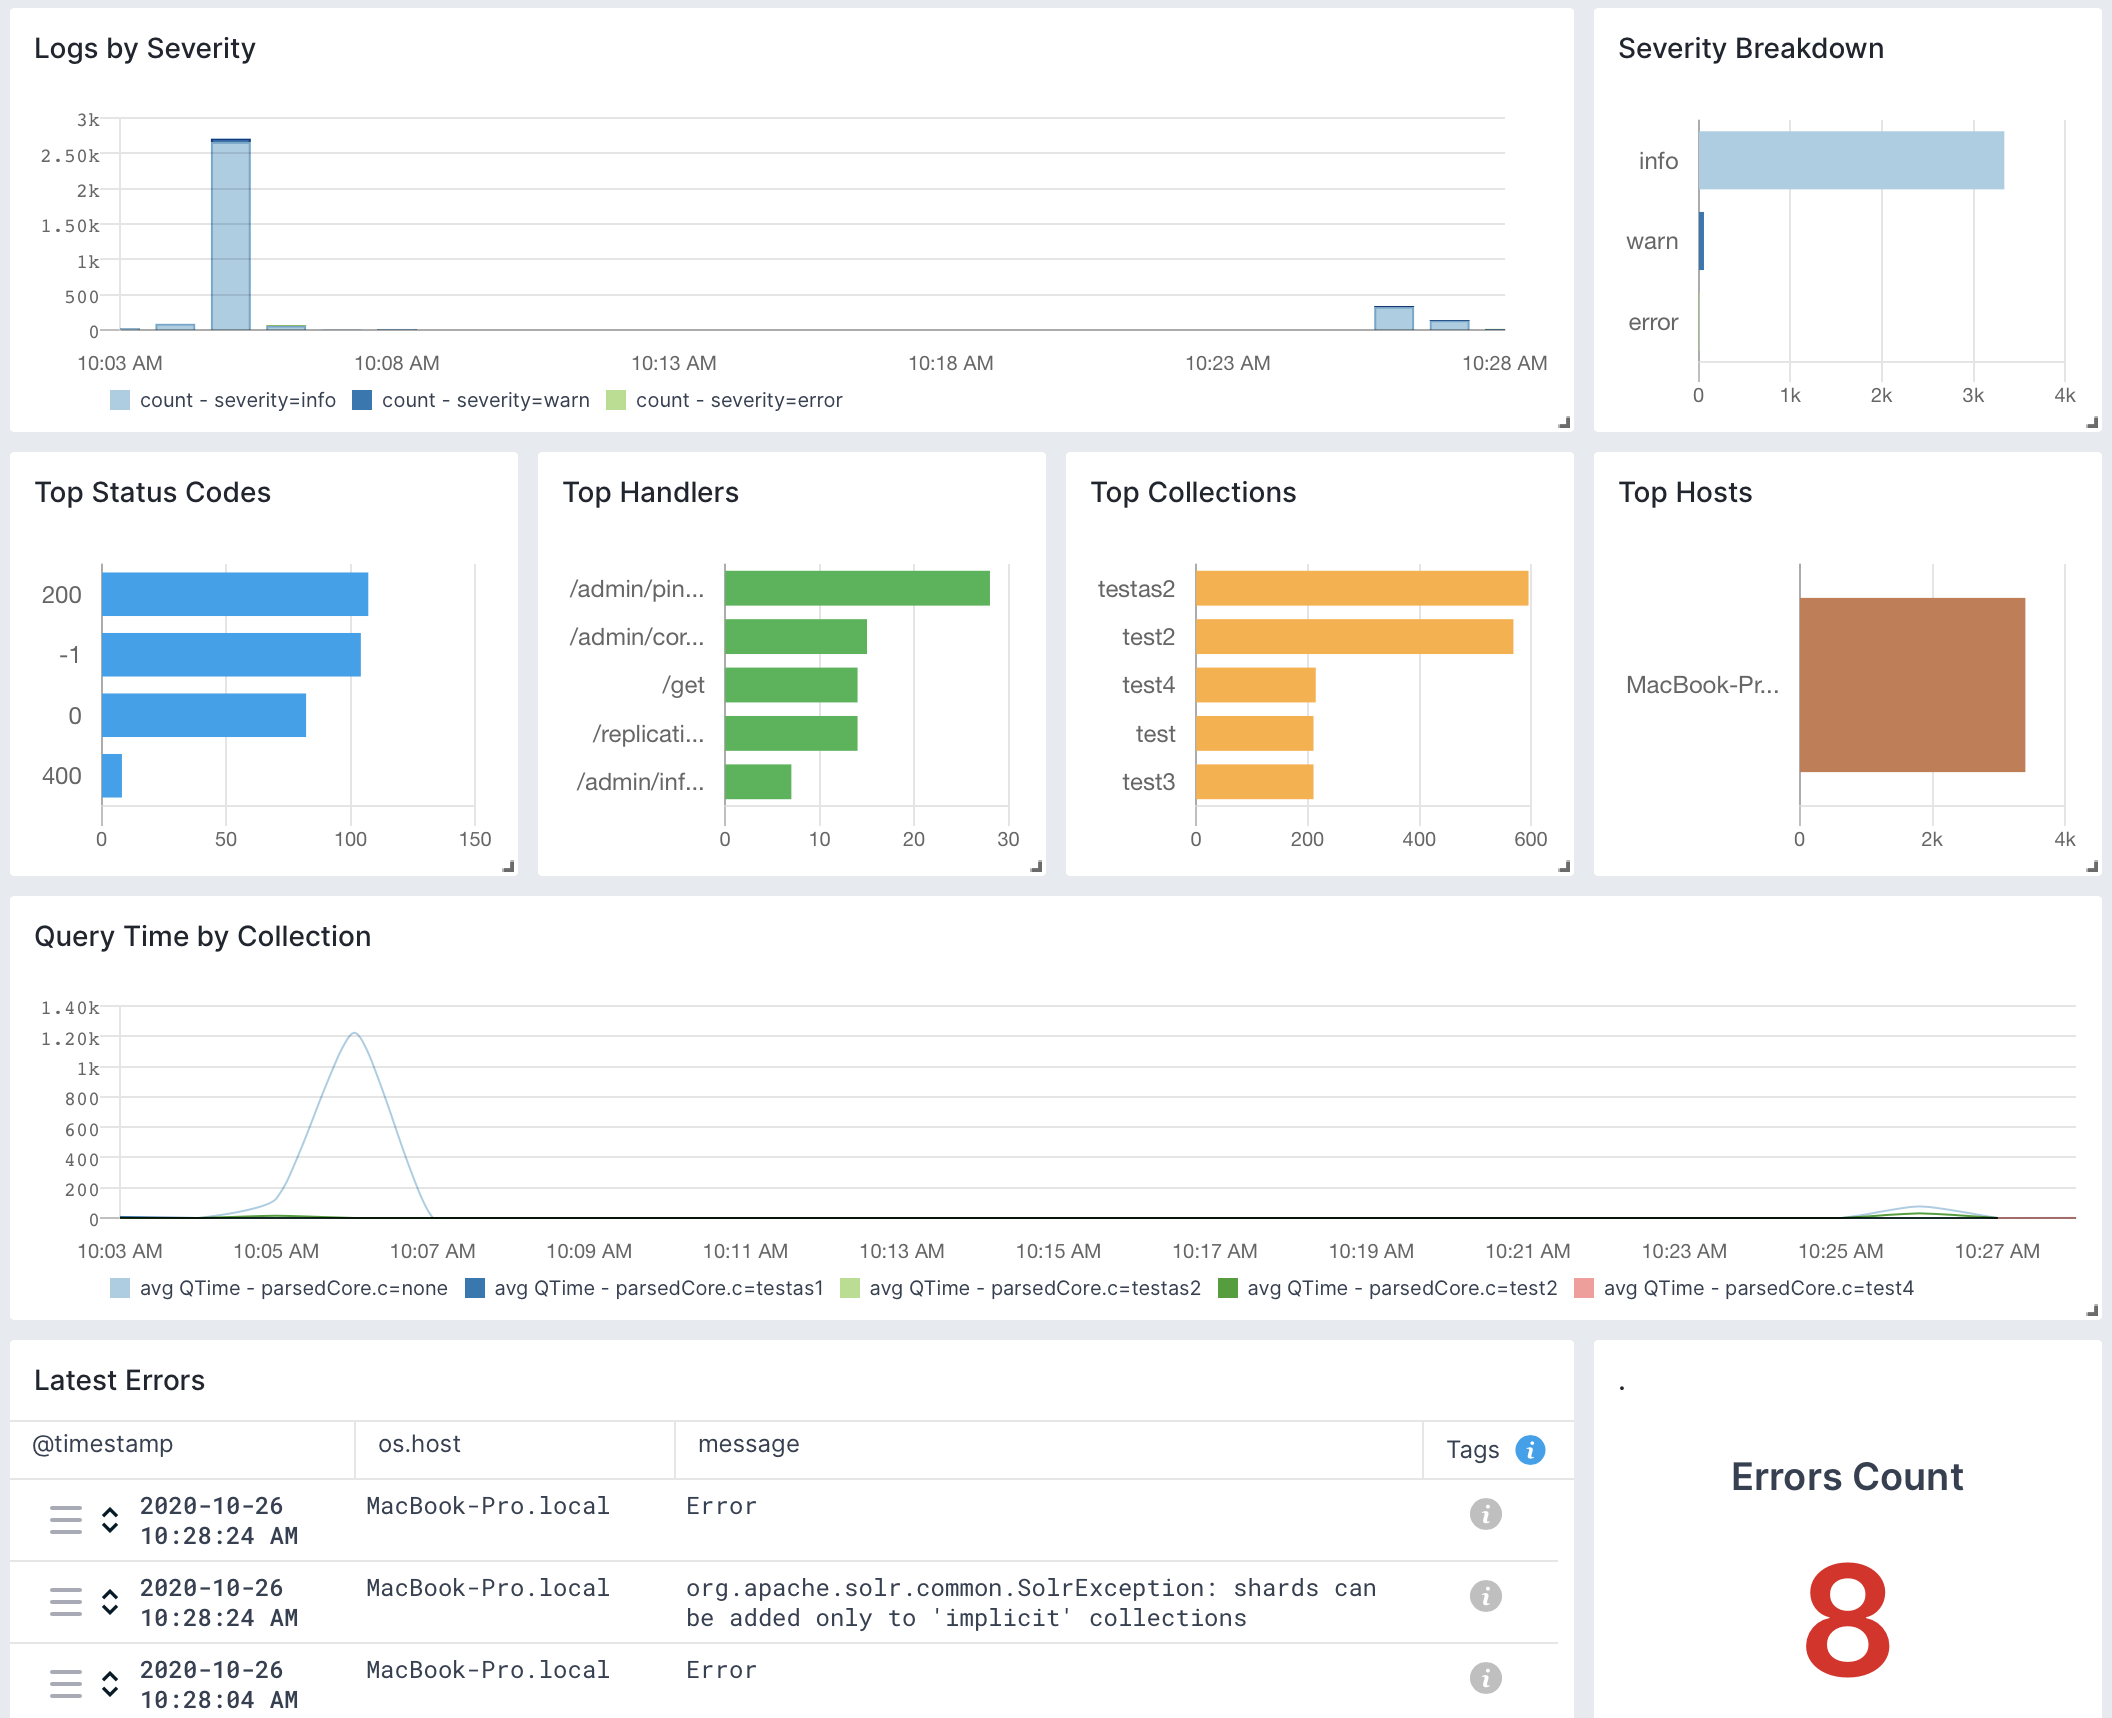
Search for Solr Logs
There are other predefined dashboards as well, tailored for specific tasks, such as the Queries dashboard for troubleshooting slow searches:
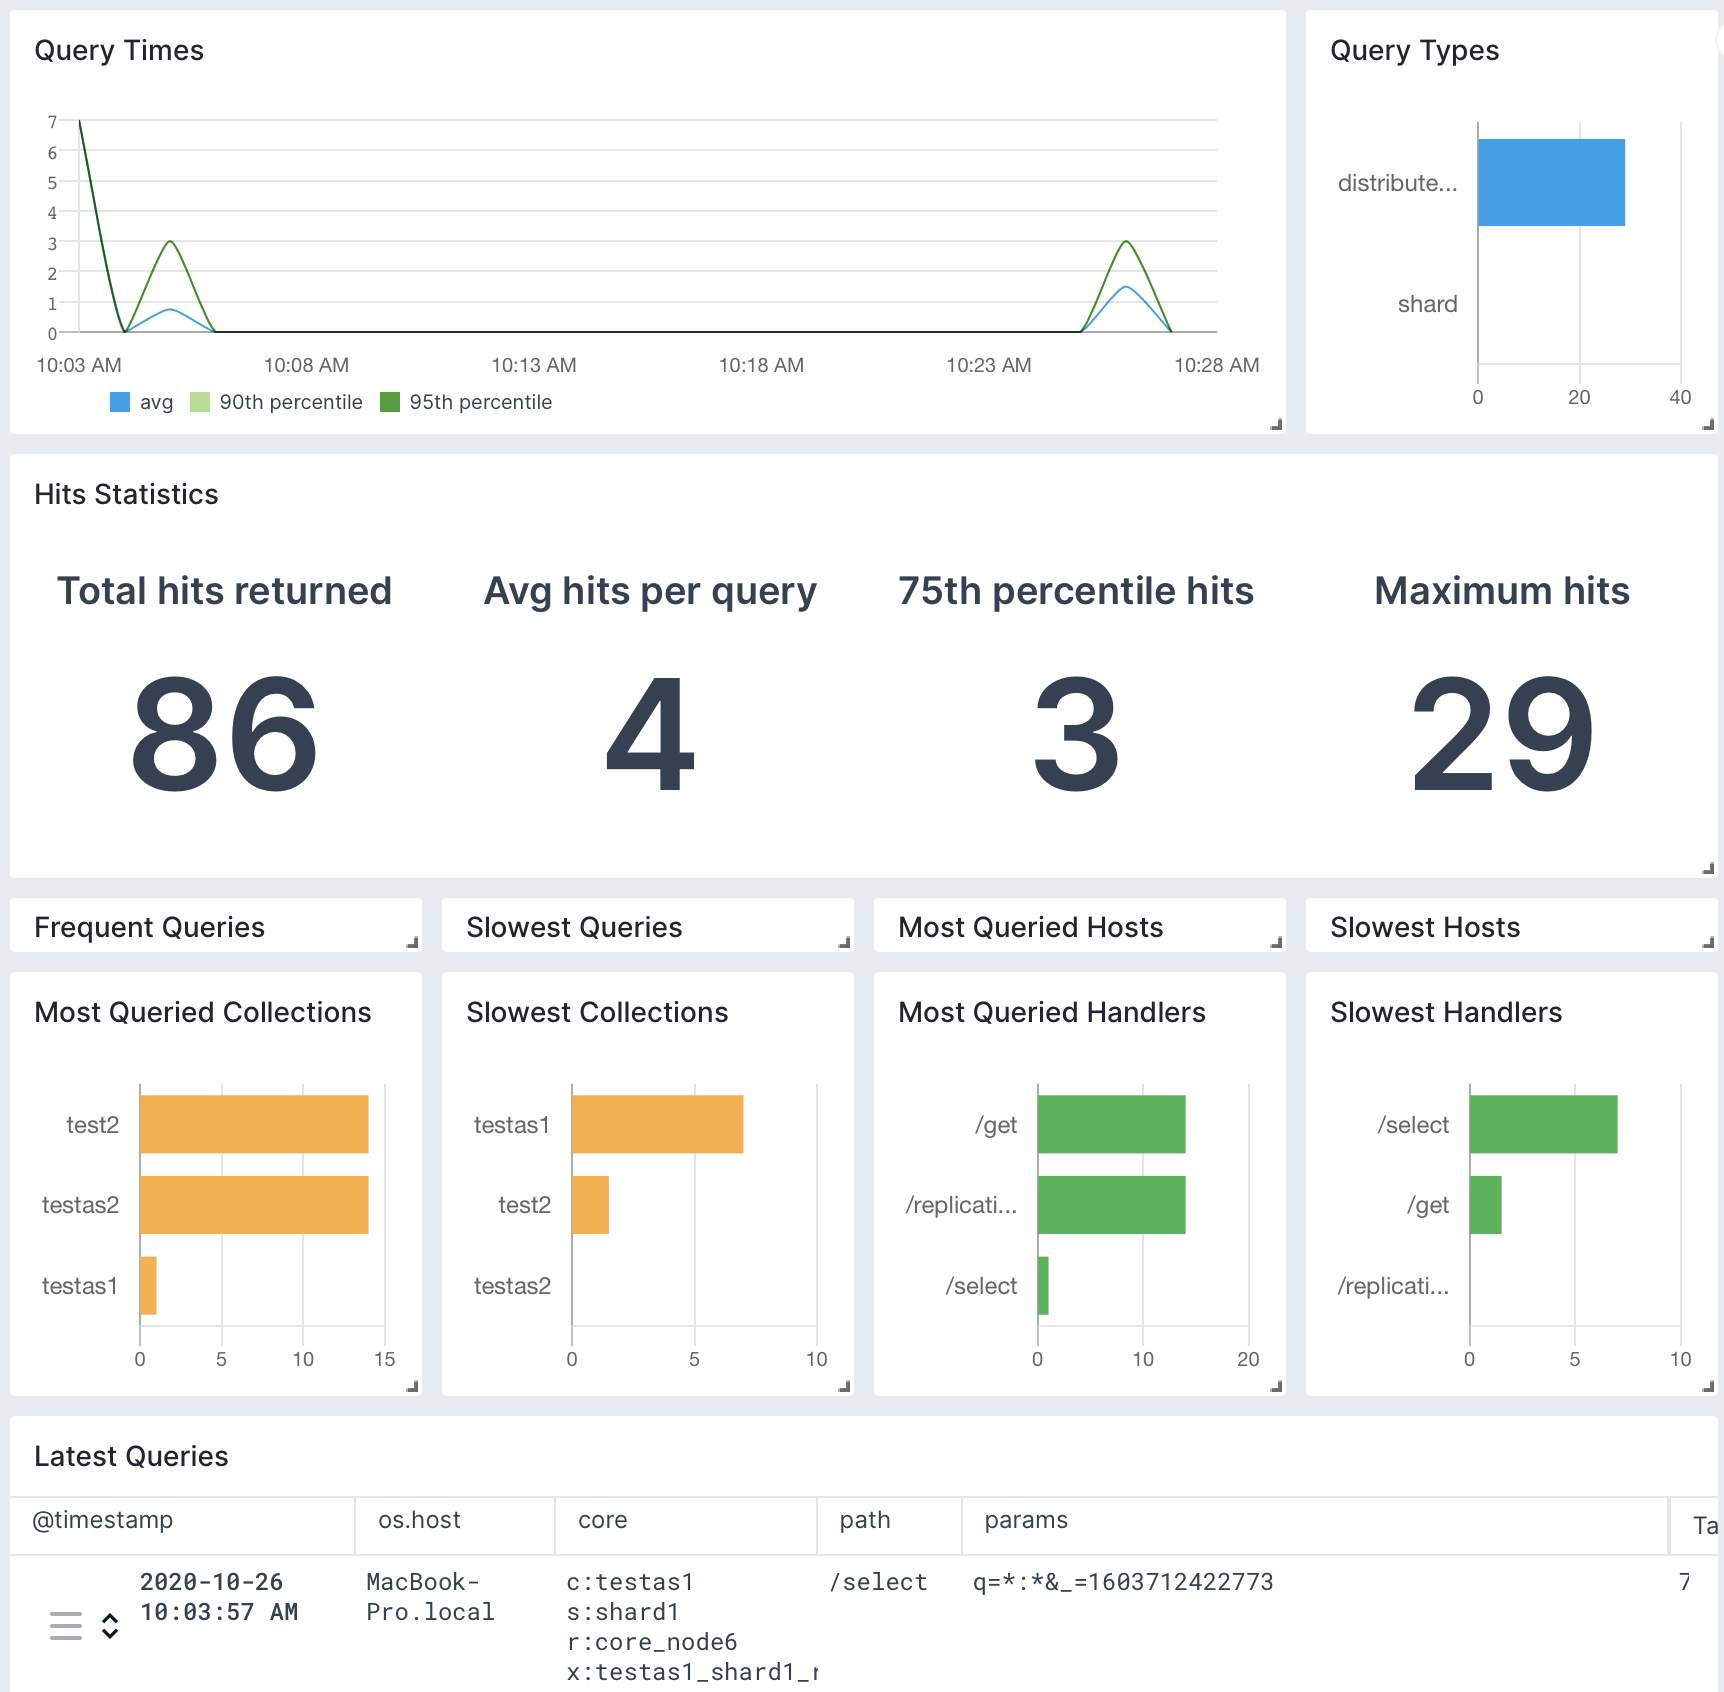
Explore Query Logs
Other built-in reports include:
- Errors: breakdown of what’s wrong: which nodes/classes/collections/etc generate errors
- Zookeeper: logs produced by Solr’s Zookeeper client and other Zookeeper-related classes and threads. Look here for insights on SolrCloud’s stability
- Overseer: logs produced by SolrCloud’s Overseer thread and other Overseer activities (e.g. shard leader election)
- Start & Stop: startup-related and shutdown-related logs. Look here if a node went down unexpectedly or doesn’t show up in the cluster when started
Log Search Syntax
If you know how to search with Google, you’ll know how to search your logs in Sematext Cloud.
- Use AND, OR, NOT operators – e.g. (error OR warn) NOT exception
- Group your AND, OR, NOT clauses – e.g. message:(exception OR error OR timeout) AND severity:(error OR warn)
- Don’t like Booleans? Use + and – to include and exclude – e.g. +message:error -message:timeout -host:db1.example.com
- Use explicitly field references – e.g. message:timeout
- Need a phrase search? Use quotation marks – e.g. message:”fatal error”
When digging through logs you might find yourself running the same searches again and again. To solve this annoyance, Sematext lets you save queries so you can re-execute them quickly without having to retype them. Please watch how using logs for troubleshooting simplifies your work.
Alerting on Solr Logs
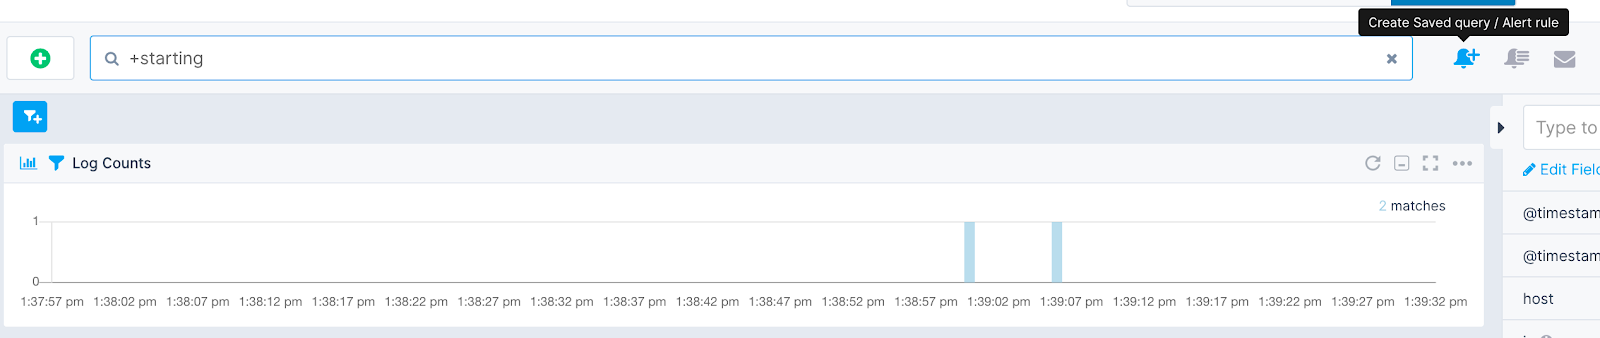
To create an alert on logs we start by running a query that matches exactly those log events that we want to be alerted about. To create an alert just click on the “Create Saved query / Alert rule” icon next to the search box.
Similar to the setup of metric alert rules, we can define threshold-based or anomaly detection alerts based on the number of matching log events the alert query returns.
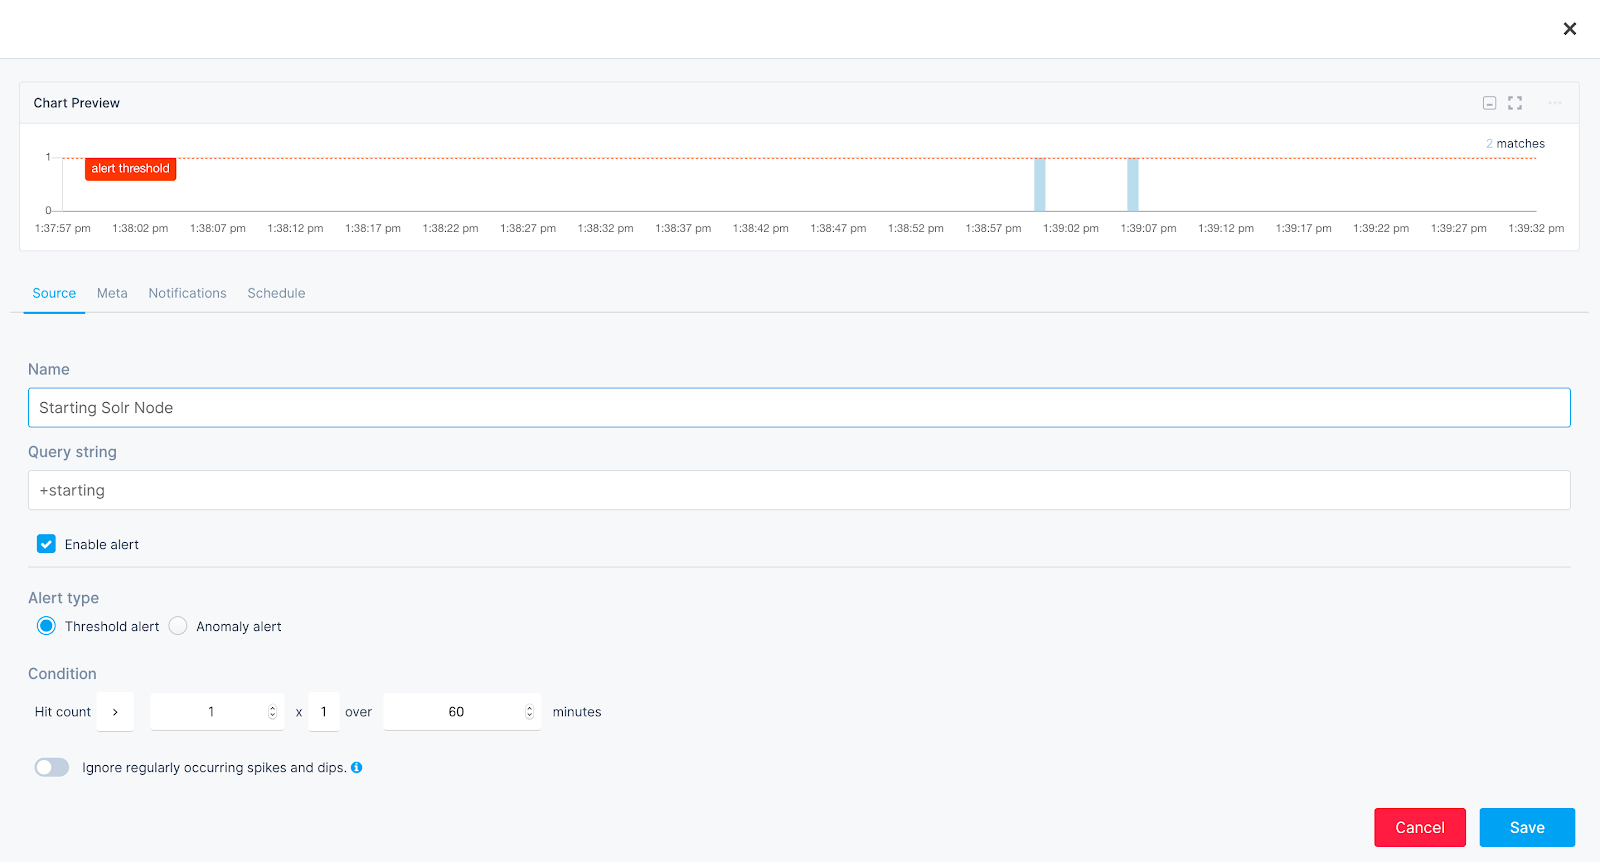
Please watch Alerts in Sematext Cloud for more details.
Finding Common Solr Problems from Solr Logs
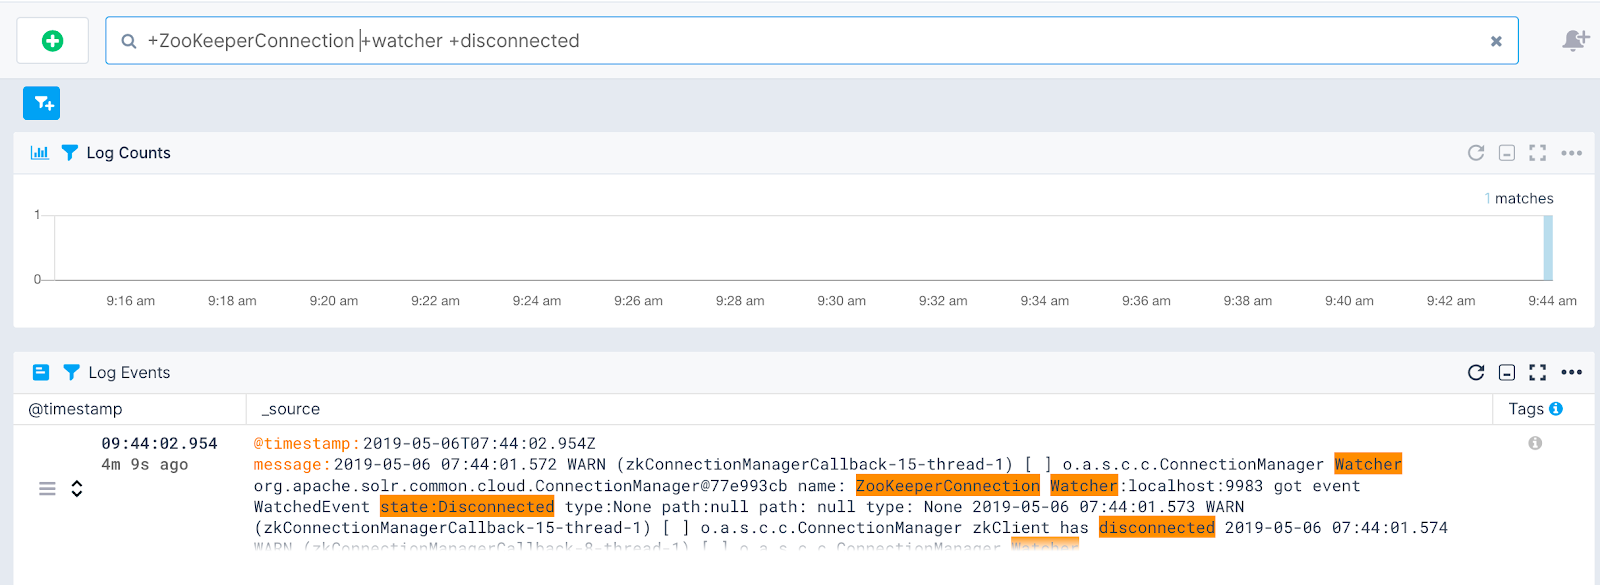
There are common issues that you may want to watch for when running Solr / SolrCloud:
- ZooKeeper disconnects, which you can find with e.g. +ZooKeeperConnection +watcher +disconnected
- Issues with auto commit operations: +auto +commit +error
- Issues with caches warming up:. +error +during +auto +warming
- Issues with commit operations: +unable +distribute +commit
- SolrCloud leader election issues: +met +exception +give +up +leadership
- Issues with shards: +no +servers +hosting +shard
You might, of course, want to save some of these as alerts.
Solr Metrics and Log Correlation
A typical troubleshooting workflow starts from detecting a spike in the metrics, then digging into logs to find the root cause of the problem. Sematext makes this really simple and fast. Your metrics and logs live under the same roof. Logs are centralized, the search is fast, and the powerful log search syntax is simple to use. Correlation of metrics and logs is literally one click away.
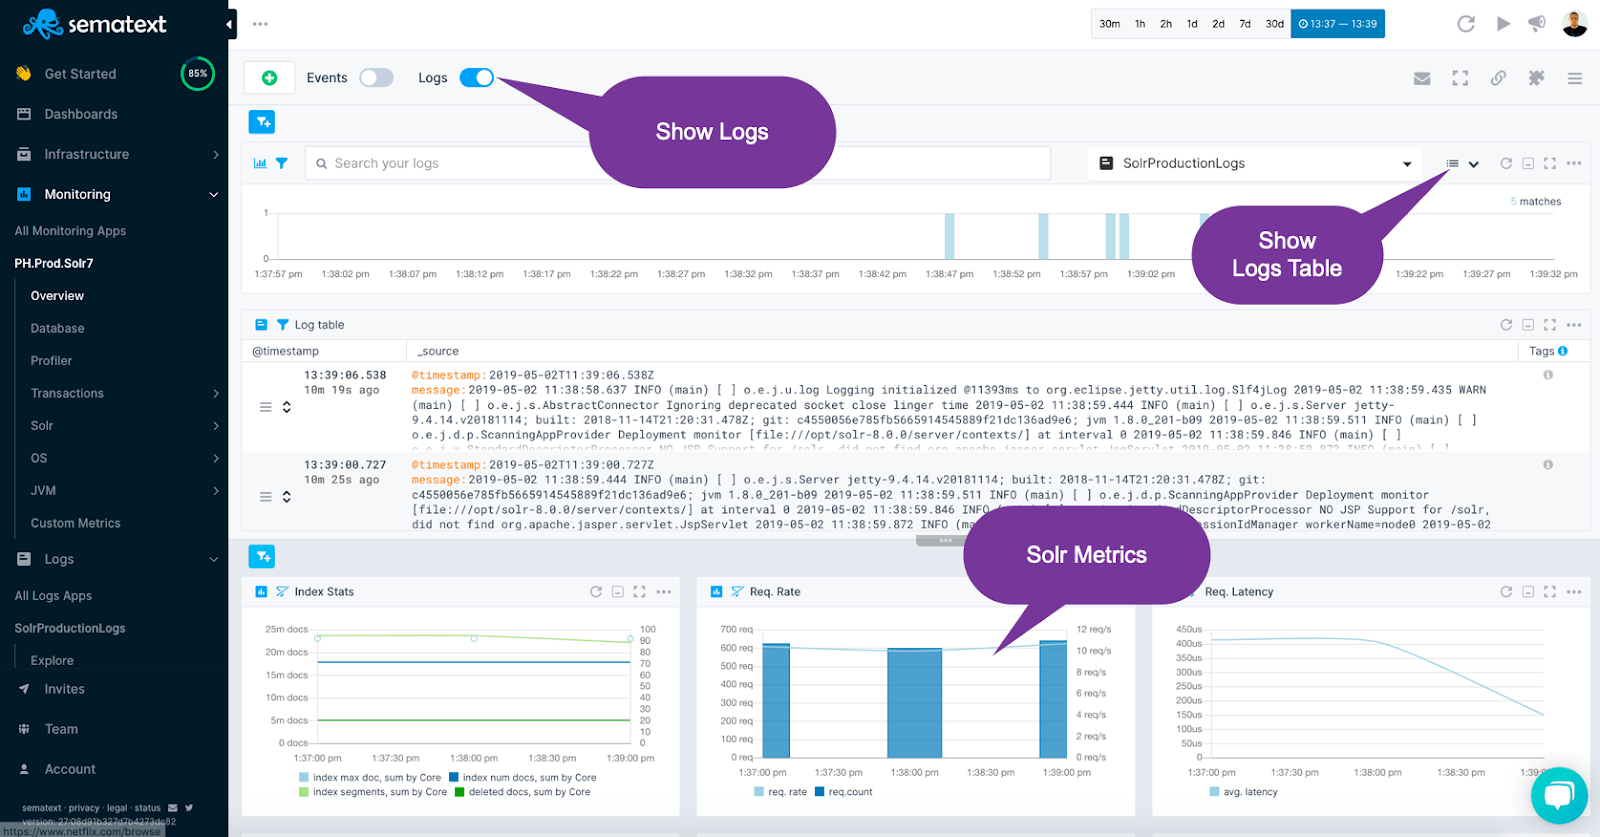
Solr logs and metrics in a single view
Full Stack Observability for Solr & Friends
Solr is your best friend, especially when using its SolrCloud mode is Apache ZooKeeper. SolrCloud requires ZooKeeper to operate, handle partitions and perform leader elections. Monitoring ZooKeeper and SolrCloud together is crucial to correlate metrics from both and have full observability of your SolrCloud operations.
Custom Solr Dashboard
Monitor Solr with Sematext
Comprehensive monitoring for Solr involves identifying key metrics for Solr collecting metrics and logs, and connecting everything in a meaningful way. In this post, we’ve shown you how to monitor Solr metrics and logs in one place. We used OOTB and customized dashboards, metrics correlation, log correlation, anomaly detection, and alerts. And with other open-source integrations, like MySQL or Kafka, you can easily start monitoring Solr alongside metrics, logs, and distributed request traces from all of the other technologies in your infrastructure. Get deeper visibility into Solr today with a free Sematext trial.
Or, if you’re looking for a little more help, Sematext also offers a one-stop shop for Solr services like consulting, training, and support.
Further reading: