Guest blog post by Nick Pentreath, Co-founder of Graphflow
Democratizing Recommendation Technology
At Graphflow, our mission is to empower online stores of all sizes to grow their businesses by providing them access to the same machine learning and Big Data tools used by the largest and most sophisticated tech players in the market.
To deliver on this mission, we decided from the very beginning to go ‘all in’ on Spark for our scalable analytics and machine learning applications. When Graphflow started using Spark, it was on version 0.7.0, and it was relatively immature. A lot has changed over the past year and a half: Spark has become a top-level Apache project, version 1.2.0 was released, and Spark has matured significantly in terms of functionality, deployment, stability, and operations.
Spark Monitoring
There are, however, still a few “missing pieces.” Among these are robust and easy-to-use monitoring systems. With the version 1.0.0 release, Spark added a metrics system to allow reporting and monitoring of various internal and custom Spark application metrics. Built on top of Coda Hale’s Metrics, the metrics system supports various methods of reporting to external monitoring systems.
This is all very well, but being a very small team, we tend to rely on managed services wherever it makes sense — we just don’t have the resources to manage a dedicated monitoring infrastructure. We recently started using SPM (for monitoring, alerting, and anomaly detection) and Logsene (for our logs) — both from Sematext — across most of our systems, including EC2 metrics, Elasticsearch, and web application log collection and monitoring.
With the recent release of SPM for Spark monitoring, we definitely wanted to take it for a spin!
Getting up and Running
The installation process is straightforward:
- Install the SPM monitor on each node in the Spark cluster using the standard package manager.
- Amend `SPARK_MASTER_OPTS`, `SPARK_WORKER_OPTS`, and `SPARK_SUBMIT_OPTS` in `spark-env.sh` and `spark.executor.extraJavaOptions` in `spark-defaults.conf` on each node, with the appropriate config properties, including an SPM access key (don’t forget to propagate these config changes to each worker – we do this using *spark-ec2’s* `copy-dirs` command).
- Create or amend the metrics properties file `metrics.properties` to point to the JMX sink (by setting `*.sink.jmx.class=org.apache.spark.metrics.sink.JmxSink`).
Once all nodes are restarted, you should start seeing metrics appearing in the SPM dashboard within a few minutes.
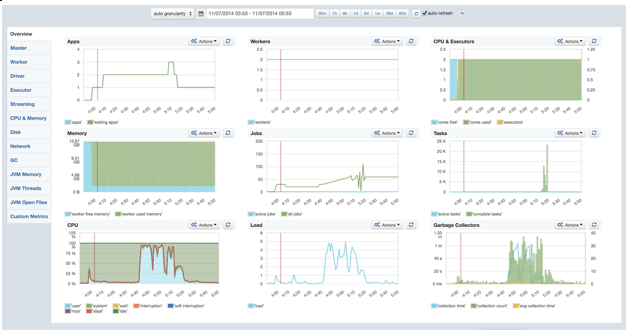
The main dashboard provides a useful overview of what’s going on in the cluster. The detail tabs on the side allow you to drill down into more detailed metrics for the Master / Driver, and Workers / Executors, and, of course, all key JVM and server metrics. We can also feed any custom metrics we want to chart into SPM, but we are not making use of that yet.
Spark Troubleshooting with SPM
Spark, being a complex distributed system, sometimes has issues. While these have become rarer with the past few releases — which have improved efficiency and stability significantly — they still happen. Probably the most common causes of failure (either of a Job, a Worker, or the Master) are related to memory pressure or misconfiguration.
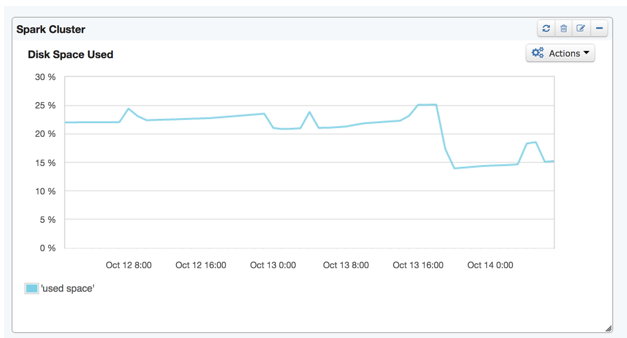
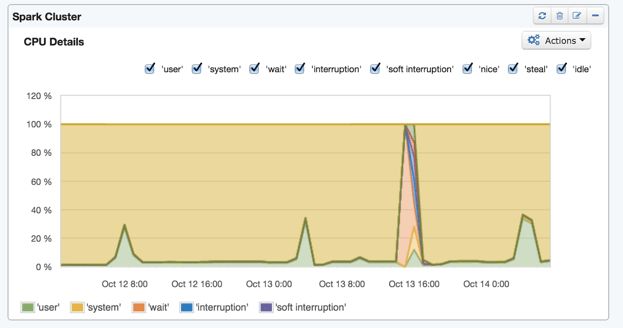
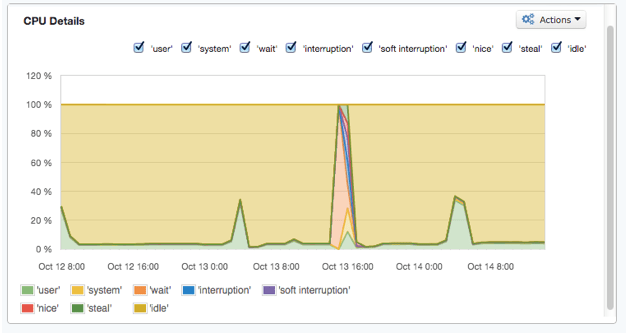
As a case in point: on a number of days we were experiencing periodic job failures due to Workers going down. However, we were not seeing a precise cause in the logs. Since we had installed SPM for Spark, we took a look through a few of the metrics dashboards. At first, it was still not clear what might be causing the issue. However, we noticed that at the time of the failure, there was a big spike in CPU usage and, directly afterwards, the overall disk usage dropped off noticeably.
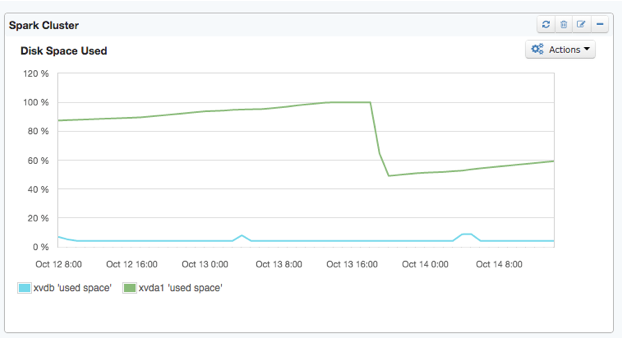
Once we drilled down from the aggregated metrics view (above) to the individual disk view, the root cause became clear – running out of disk space on the root device!
Sure enough, once we knew what to look for, we found that the Spark working directory on each Worker node had gotten clogged up with job logs and JARs. We run a fairly large number of jobs on regular schedules (every 15 minutes, every hour, daily and so on), and each job caused more build up of these files in the working directory.
We had correctly set spark.local.dir to the large disk volume, but the default working directory is set to $SPARK_HOME/work. This setting can be changed with the environment variable SPARK_WORKER_DIR in spark-env.sh. We also turned on the ‘worker cleanup’ functionality by setting spark.worker.cleanup.enabled true in spark-defaults.conf. The Spark Standalone guide has more detail on these settings.
Everything in One Place
Using SPM, together with the Spark Web UI and its ability to keep history on previously run Spark applications, we’ve found that troubleshooting Spark performance issues has gotten much easier. On top of that, the ability to manage metrics, monitoring and logging across our entire stack in one place, as well as integrate log search and analytics for Spark, is a huge win for our team.
To learn more about us and our eCommerce and Recommendation Analytics solutions, visit the Graphflow web site. And to learn more about SPM for Spark monitoring, check out Sematext.
Got some feedback or suggestions? Drop Sematext a line — they’d love to hear from you!
