Apache is the second most popular web server, after …., with its roots and official release going back as far as 1995. Throughout the years, it gained features, including HTTP/2, caching, and many more, while retaining its most appreciated capabilities: speed, modularity, and great stability.
To fully leverage its features, you need to understand the environment, bottlenecks, traffic and user behavior. Just like with every software inside your infrastructure, Apache is no different. Working without observability tools is like going in blind, making it difficult or even impossible to detect and fix potential issues that may affect your users.
To help with that, in this article we will look at the top Apache log analyzer tools that will help you analyze log events to get a detailed picture of what is happening with your Apache servers.
Top Apache Log Analyzer Tools
1. Sematext
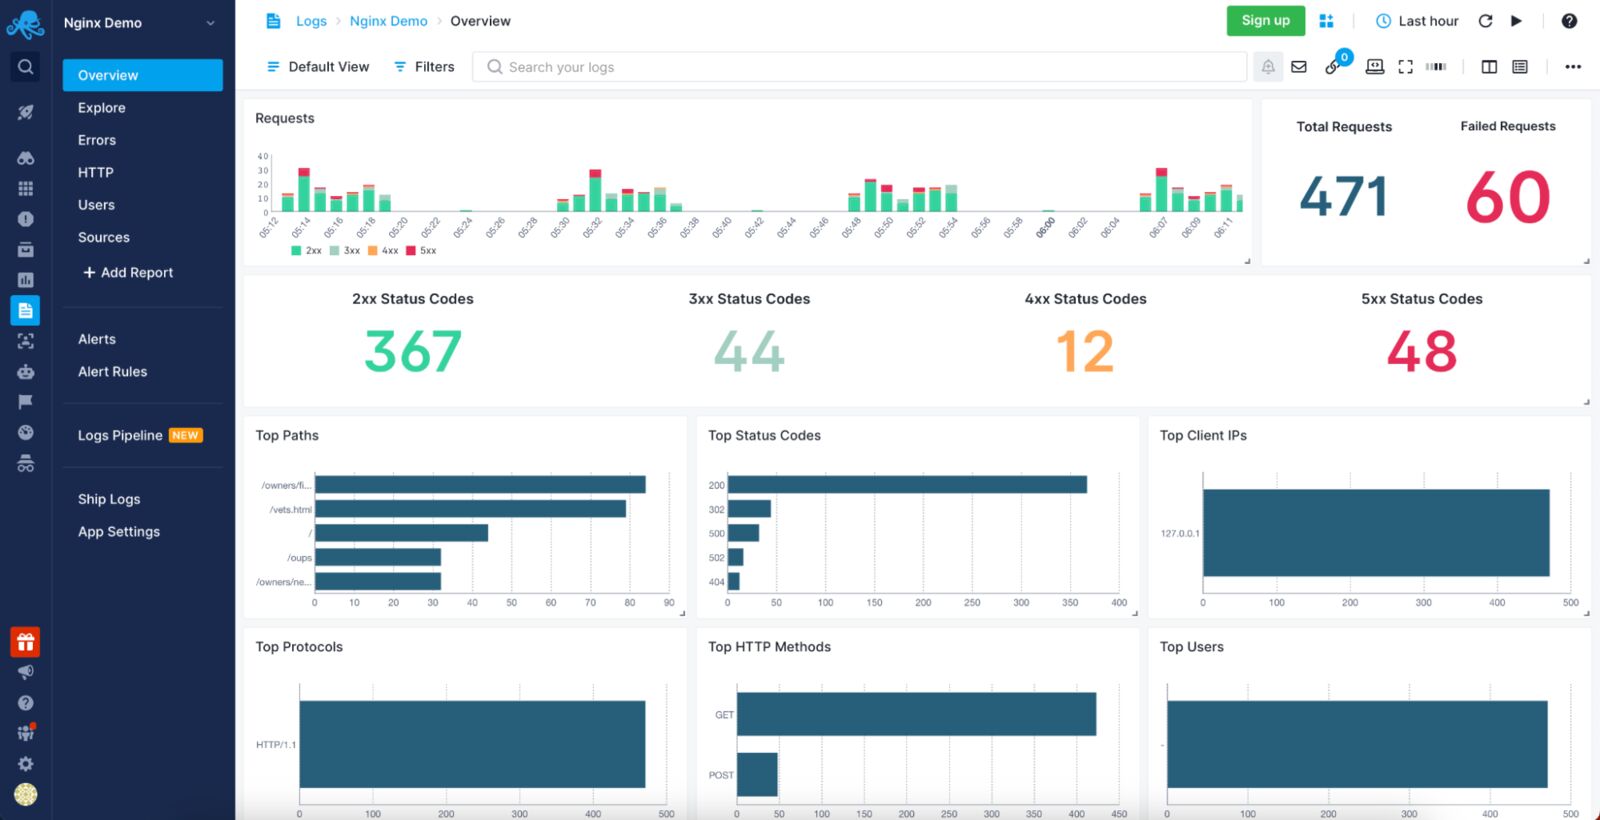
Sematext Logs is a log centralization and aggregation tool with support for Apache logs. Whether you want to analyze how your users behave, which pages they access, or what errors they encounter, Sematext has you covered. It allows you to slice and dice through the data quickly and easily once your data is in to get all the critical information needed for efficient troubleshooting. Details such as requests summary, the number of requests with given response code and much more are available via rich out-of-the-box dashboards. Here, you can correlate logs with events and metrics, live-tail logs, alert on logs, and use Google-like syntax for filtering.
Pros:
- Provides an agent with preconfigured parsing rules for Apache and other common formats like NGINX, Docker, or Java garbage collector.
- The user-friendly Logs Pipelines allow you to further modify the log files sent to Sematext for functionalities such as IP to geolocation translation or numerical data extraction.
- Accepts data from various sources that can ship data via Syslog or in Elasticsearch-compatible format, enabling integration of log events from technologies across your whole environment.
- Part of the Sematext Cloud suite – an observability platform ideal for troubleshooting, as it allows you to monitor your infrastructure, monitor your real users using Sematext Experience, and run synthetics tests using Sematext Synthetics.
Cons:
- No support for unstructured text. It won’t be an issue with Apache log events, but it may become a limitation when dealing with many different log sources.
- You can’t mix Kibana and Sematext native UI widgets in a single dashboard – it is one or the other.
Price:
Sematext Logs pricing starts with a free Basic plan, allowing up to 500MB/day worth of Apache logs and 7 days of data retention. The Standard plan starts at $50/month and includes 1GB/day and 7 days retention, which translates to around $0.1/GB of received data and $1.56/GB of stored data, but with limited features. The fully-featured Pro plan has Logs Pipelines, Log Archiving, and more, starting with around $60/month for 1GB/day of data and 7-day retention translating to $0.1/GB of received data and $1.90/GB of stored data.
Watch the video below to get a better glimpse into what Sematext Logs look like and how it works!
2. GoAccess
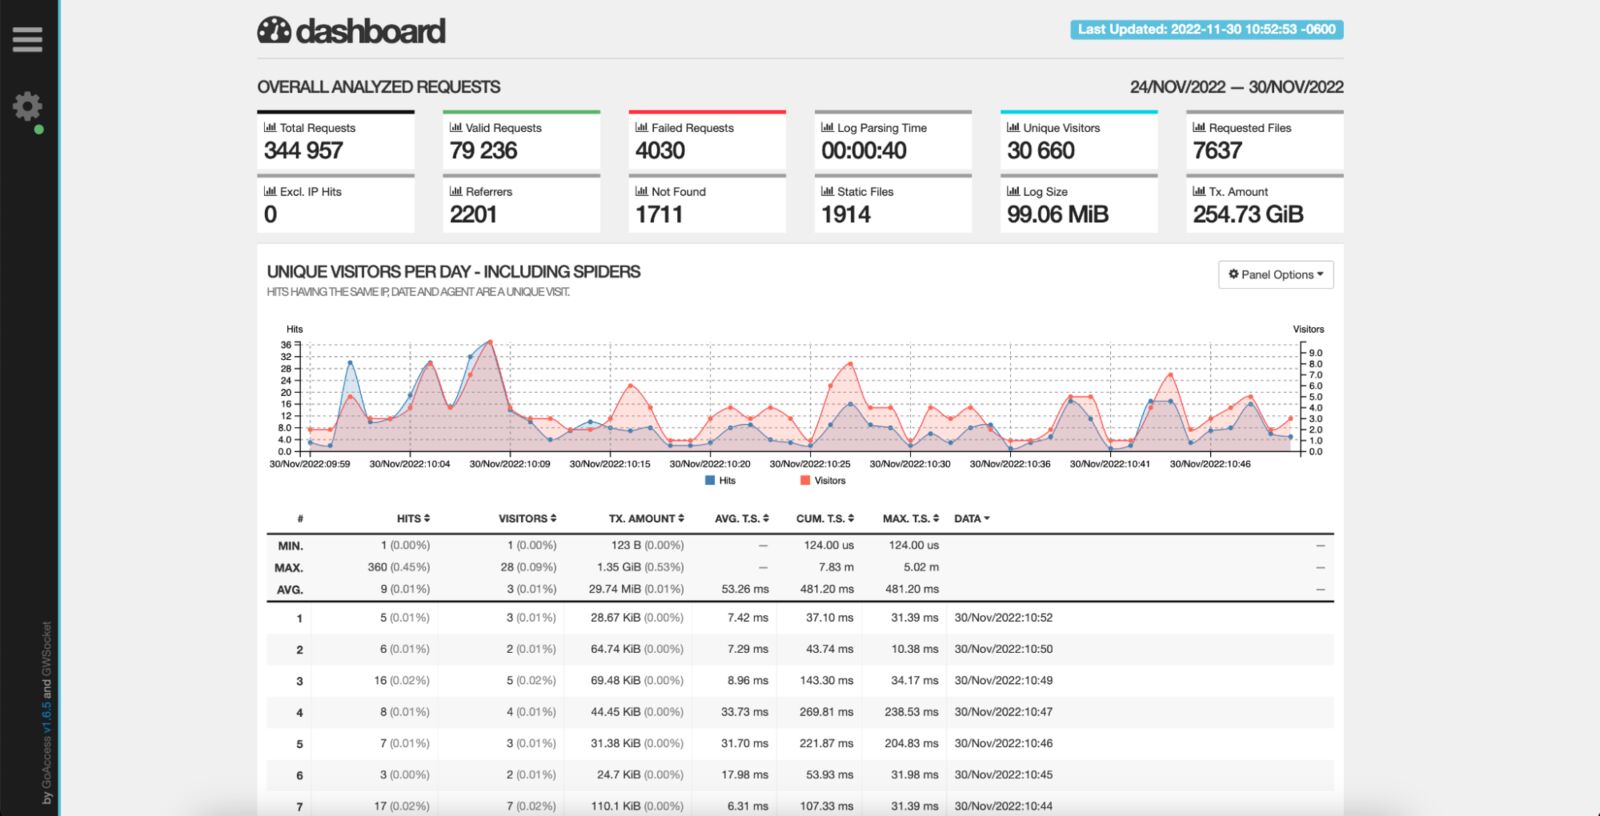
GoAccess is an open-source, real-time web log analyzer with first-class support for Apache logs and other web server log formats, including NGINX and Amazon S3. It’s written in C and extremely fast, with two ways of visualizing data. On the one hand, it can work in the terminal, allowing you to see log data via command line. On the other hand, you can also view logs data via the HTML files GoAccess generates, which are updated automatically to provide information such as requests, visitors, top URLs, 404 pages, IPs and hostnames of your visitors. With GoAccess, you get all the information needed for efficient troubleshooting out-of-the-box in a single pane of glass.
Pros:
- Easy and fast to set up.
- Ability to parse the Apache logs without any additional configuration.
- Beautiful terminal dashboard for the engineers preferring terminal rather than rich web visualizations, with the latter available as well.
- Support for incremental log processing with the on-disk database.
Cons:
- If you want to visualize the logs of all your Apache instances simultaneously, you need to centralize them in a single shared place, a process you will have to manage yourself.
Price:
GoAccess is an open-source and free Apache log file analyzer.
3. Elastic Stack (ELK)
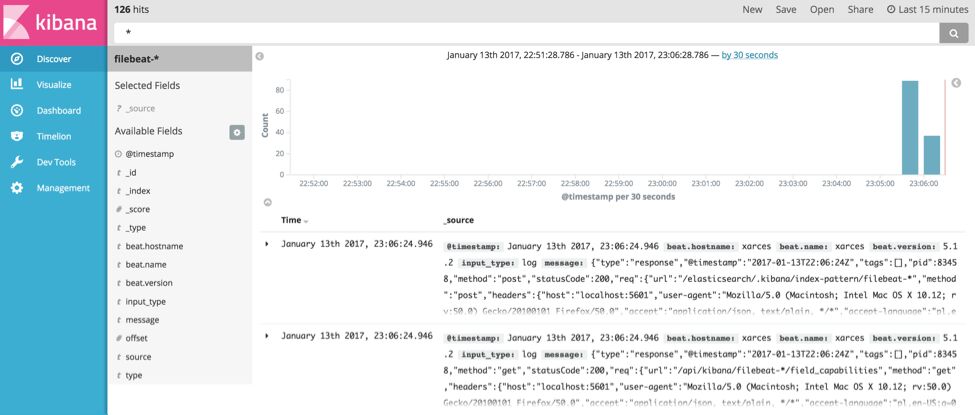
The ELK Stack is a widely known set of tools for gathering, parsing and analyzing logs from Apache and many other web servers and technologies. Comprised of Elasticsearch, the search and analytics engine, Logstash, the log processing and shipping tool, and Kibana, the visualization layer, this log analyzer gained popularity because of its ease of use, user-friendliness and high versatility when it comes to all things logs related. As part of the Elastic Stack, it can now be enriched with additional tools, such as Beats, a lightweight log shipper with Apache support.
The Elastic Stack allows you to aggregate and manage large amounts of Apache logs easily, enrich them, slice and dice through them, and create stunning dashboards tailored to your use case. You can see critical data, such as the users who’s using your application, how and when. The Elastic Stack provides everything in one single, simple-to-use, yet comprehensive platform you can use in the cloud or install and run in your environment.
Pros:
- With the right hardware, it’s easily scalable to support large data volumes and virtually unlimited data retention.
- Mature and configurable log shippers with native support for Apache log files and more.
- Possibility to set up and configure logging according to needs to accommodate many other technologies in your stack, besides Apache. It can easily become the center of observability in your organization.
- Rich, virtually unlimited visualizations.
Cons:
- May be challenging to maintain at a larger scale, requiring in-depth knowledge.
- Limited features of the Basic version.
Price:
The Basic version of Elastic Stack is free but self-managed, so you need to consider that with it comes maintenance and limited capabilities. For example, the free enterprise-grade basic plan lacks machine learning.
Want to see how Sematext stacks up? Check out our page on Sematext vs ELK.
4. Splunk
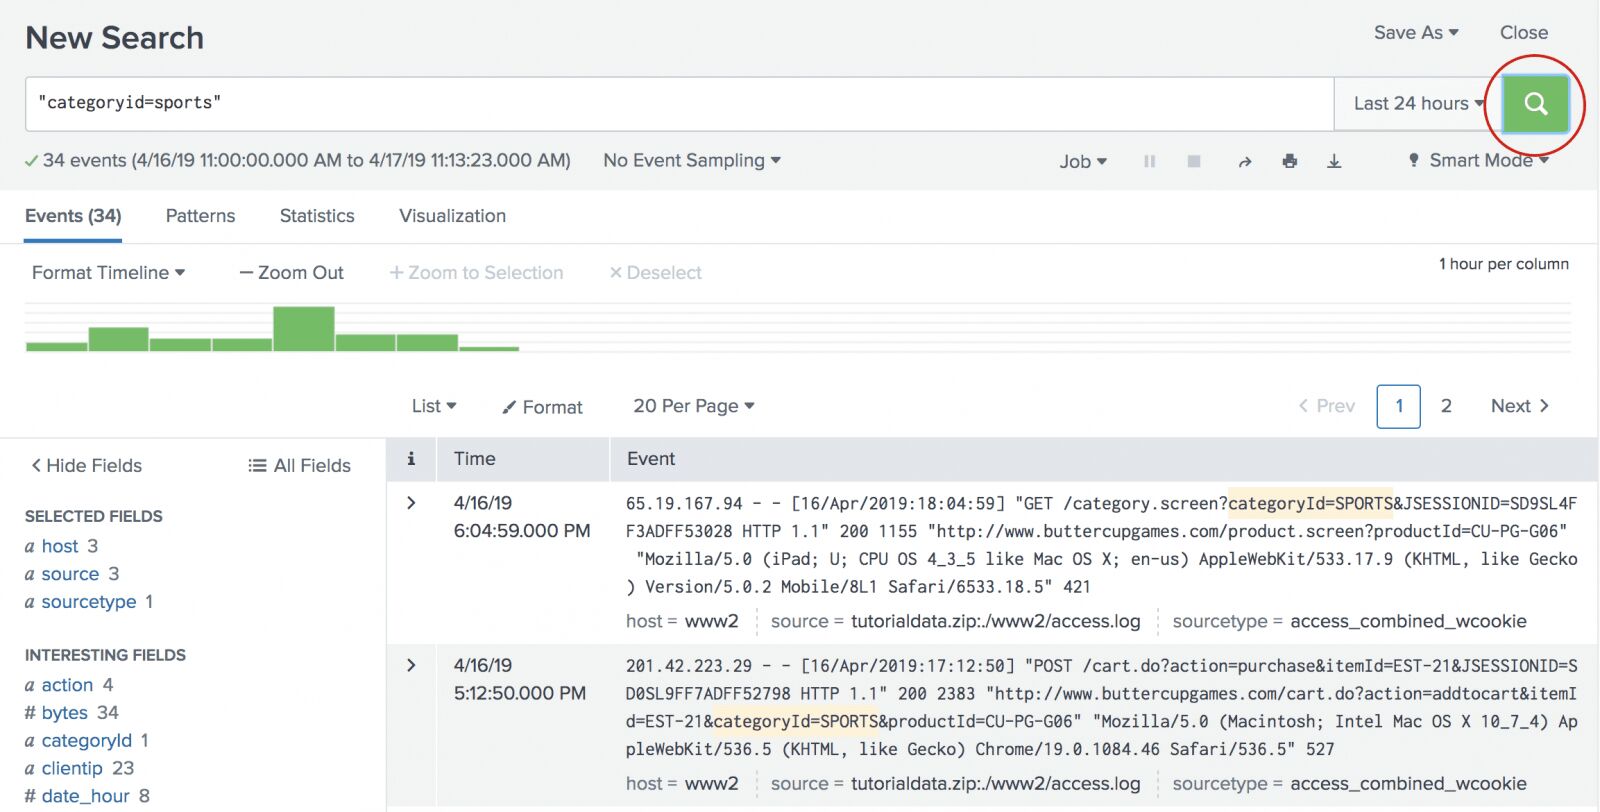
Splunk is one of the first commercial log centralization tools that gained a lot of traction and popularity, especially due to its many integrations, including Apache. Splunk offers a wide variety of features, including data visualization for the metrics derived from your Apache servers logs, real-time search, KPI tracking, reporting and monitoring, making it one tool to rule them all, at least when it comes to performance observability. Everything is available on-premises or as software as a service.
Pros:
- Mature, future-rich and widely adopted, meaning that it will be a good solution not only for Apache logs observability but for your whole infrastructure.
- Rich visualizations allow you to graph whatever you want from Apache logs.
- Custom dashboarding and reports support creating the visualizations that you commonly need.
- Real-time alerting helps you stay updated with the important events in your Apache logs.
Cons:
- Powerful, but expensive.
Price:
Splunk pricing starts with a free plan allowing up to 500MB of data per day. Paid plans are available upon request.
Want to see how Sematext stacks up? Check out our page on Sematext vs Splunk.
5. ManageEngine EventLog Analyzer
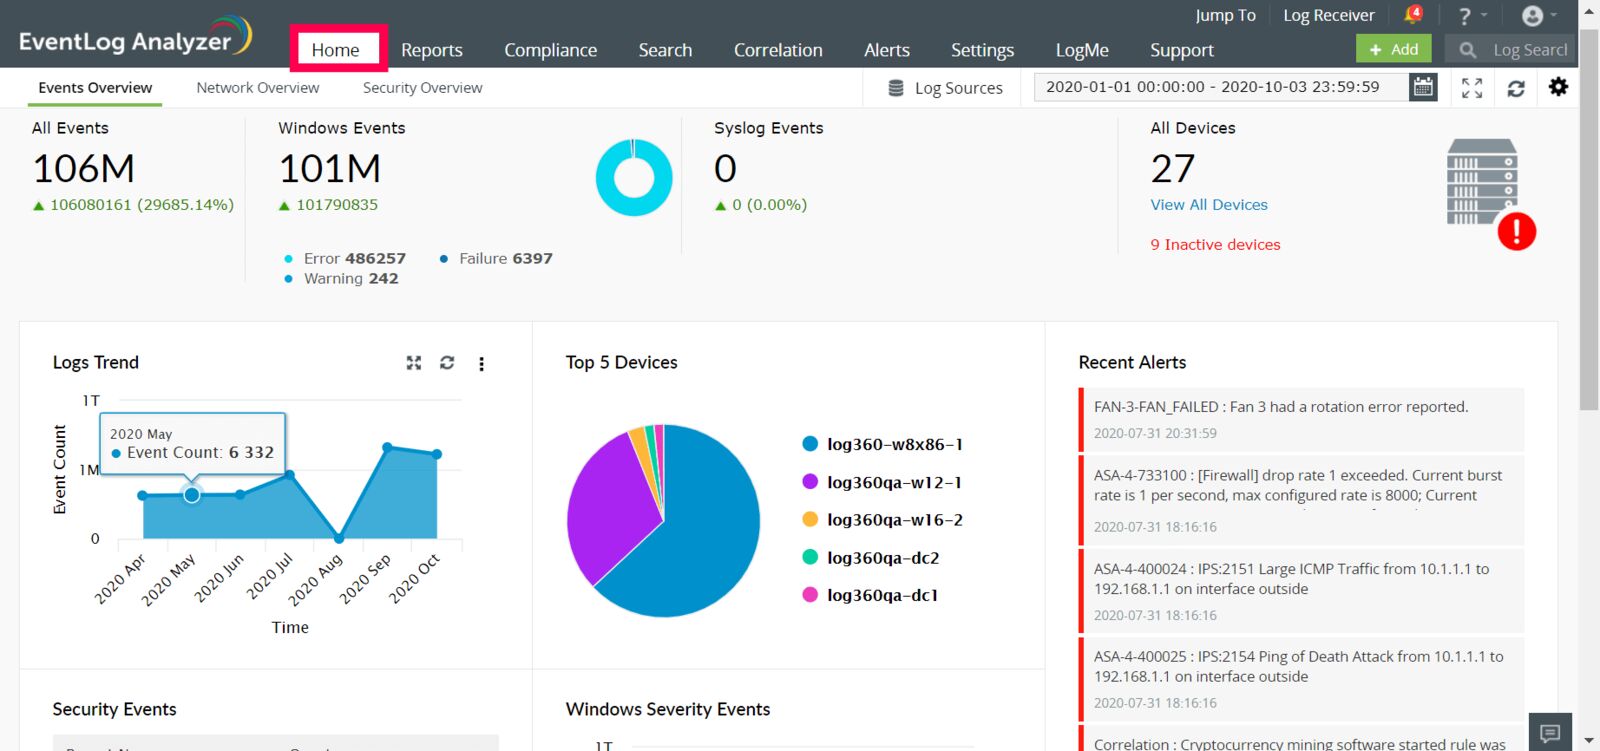
ManageEngine EventLog Analyzer is a log management solution that has the basic functionalities of a SIEM product, but it also features advanced capabilities for analyzing Apache logs. Easy to set up and use, this log analyzer can collect, parse, and analyze event logs from various sources, including devices in your network, database platforms, routers, and so on. It supports real-time alerting and event correlation, helping you be on top of what is happening with your Apache servers.
Pros:
- Possibility to understand how your users access your site and navigate through it.
- Monitoring anomalous activity, enabling you to investigate it further.
- Real-time alerting via e-mail and SMS.
- Common attack vectors reports, including SQL injection reports, cross-site scripting reports and directory traversal reports.
Cons:
- Too comprehensive if used only Apache logging.
Price:
ManageEngine EventLog Analyzer offers only paid options, but you can get a 30-day free trial to try it out. Pricing is available upon request.
6. SolarWinds Loggly
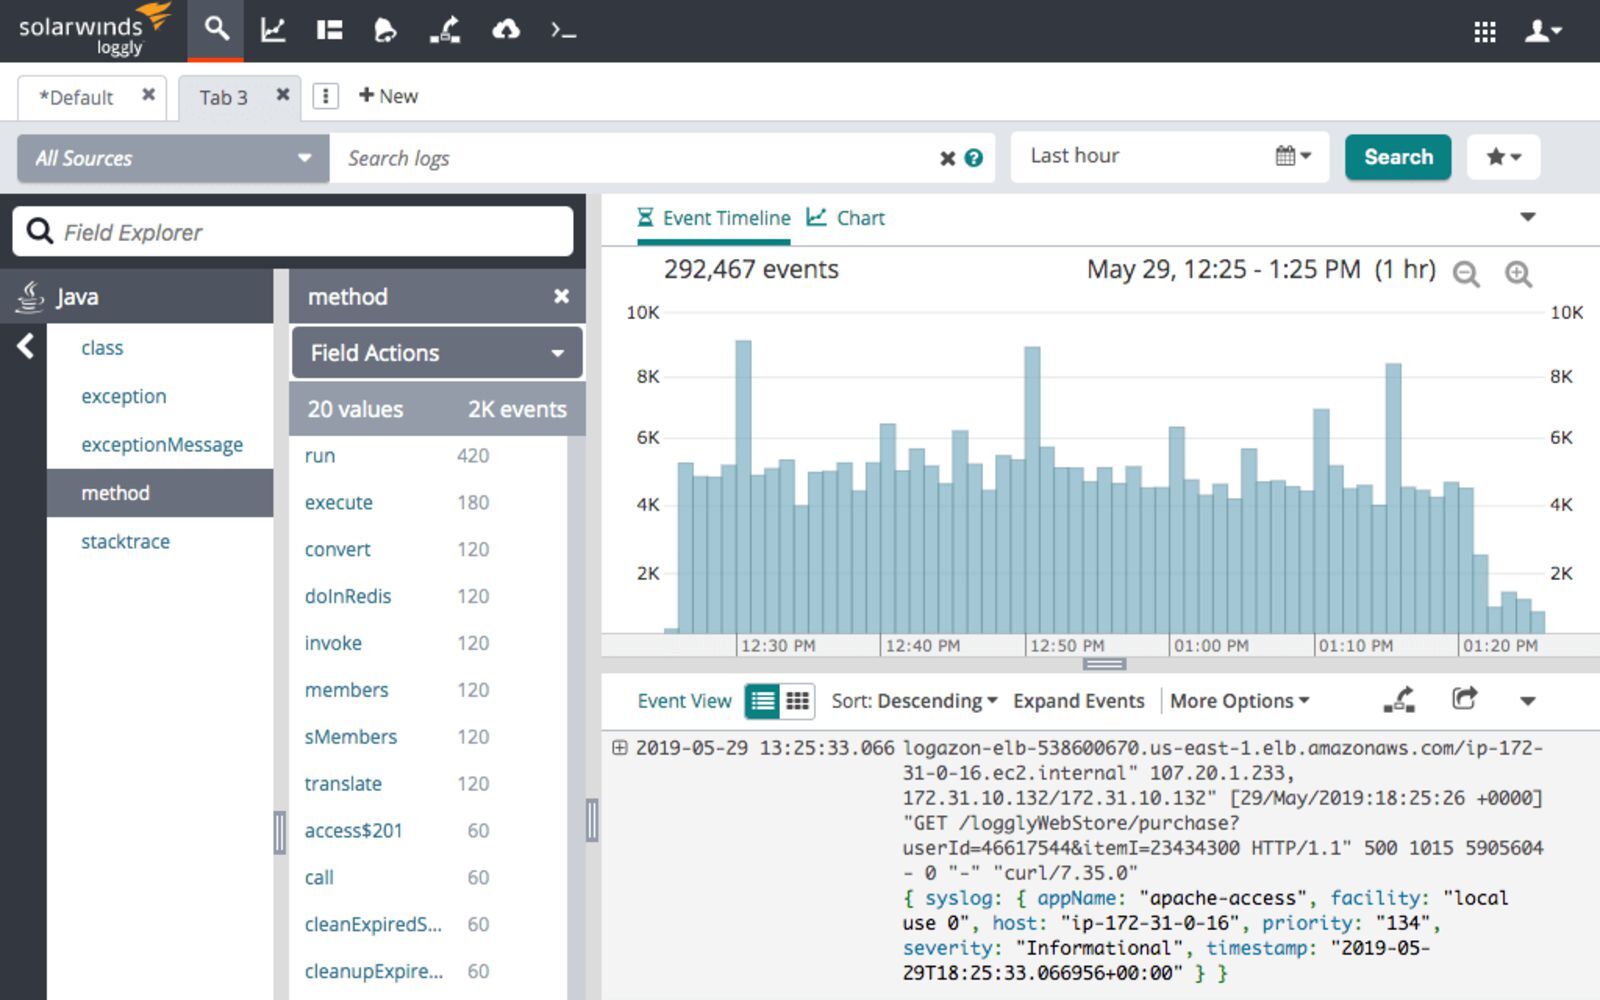
Loggly is a cloud-based log aggregation and management service that allows you to access and analyze all types of Apache web logs in a very efficient and simple way, while giving you real-time insights into what is happening with your web server. The tool uses well-established protocols such as HTTP or Syslog to ship the Apache log data to your central location, ensuring you use battle-tested ways of shipping each type of Apache logs.
Loggly features a dynamic field explorer that gives you real-time visibility into your Apache logs categorized by structure or custom filters of your choice. It also comes with powerful full-text search capabilities that enable you to search on individual fields to find the log events that matter the most, like those coming from your most valuable URL handled by the Apache HTTP server.
Pros:
- Larger flexibility because of query time field extraction allows you to experiment without the need of thinking about parsing.
- Agent-free logs collection and support for most popular log shippers makes the integration super easy.
- Server-side logs parsing allows avoiding expensive parsing operations on the Apache servers themselves.
Cons:
- API access and other enterprise-grade features only available using higher plans.
- Restrictive overage rules.
Price:
Loggly pricing starts with a free tier that includes 200MB/day of data ingestion with 7 days retention and includes basic functionality lacking alerting and customized dashboards. The paid plan starts at $79/month, billed annually for 1GB/day of data ingestion and 15 days retention and has customized dashboards and email alerting. The Enterprise version starts at $279/month billed annually and includes all the features of the earlier plans, webhooks, custom daily data volume, and 15 to 90 days retention.
Want to see how Sematext stacks up? Check out our page on Sematext vs Loggly.
7. SolarWinds Security Event Manager
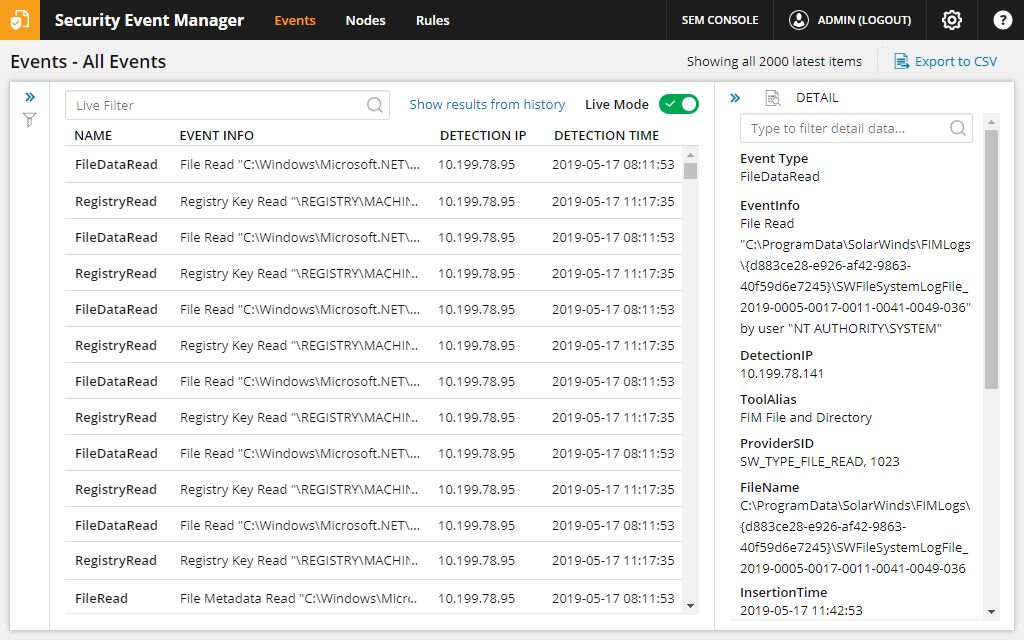
SolarWinds’ Log & Event Manager is a log management tool with Apache logging capabilities. It allows you to monitor your web server logs in a user-friendly environment offering intuitive dashboards for analyzing log correlations and data sources. This log analyzer lets you store and investigate historical data and use it to run automated audits. It also features real-time event correlation, file integrity monitoring, configurable dashboards, scheduled searches, and a threat intelligence feed.
Pros:
- Provides all the necessary information from Apache logs, such as HTTP status codes, URL paths, request timings, and more.
- Event-time correlation capabilities speed up troubleshooting your Apache logs.
- Advanced visualizations, including treemaps, charts and word clouds based on your Apache log files.
- Designed with efficiency in mind to streamline root cause analysis.
- Compliance management support.
Cons:
- Powerful but expensive, especially when you’re using it to monitor only Apache logs.
Price:
SolarWinds offers only paid plans, but you can test it with a 30-day free trial. The price starts at $2,341.
8. WebLog Expert
WebLog Expert is a paid Apache log analyzer supporting both common and combined logs file formats, giving aggregated information as pre-created reports. It provides much-needed information such as activity statistics, access files and paths, referring pages, browsers, operating systems used, and the search engines users use to access your site. You can easily filter data by using the file name, query, method, port and many more to narrow down the events. All of that is available for other well-known web server log formats, which helps you never to miss the information you are looking for.
Pros:
- Automatic log format detection.
- Support for gzip and zip compressed files.
- Possibility of downloading log files from external servers and uploading the generated reports to a dedicated storage.
- Built-in web server for ease of reports access.
Cons:
- Support for Microsoft Windows operating system only.
Price:
WebLog Expert comes with three pricing tiers – Standard for $99, Professional for $199, and Enterprise for $399. Each version differs when it comes to the functionalities it provides. You can try them out with the 30-day free trial.
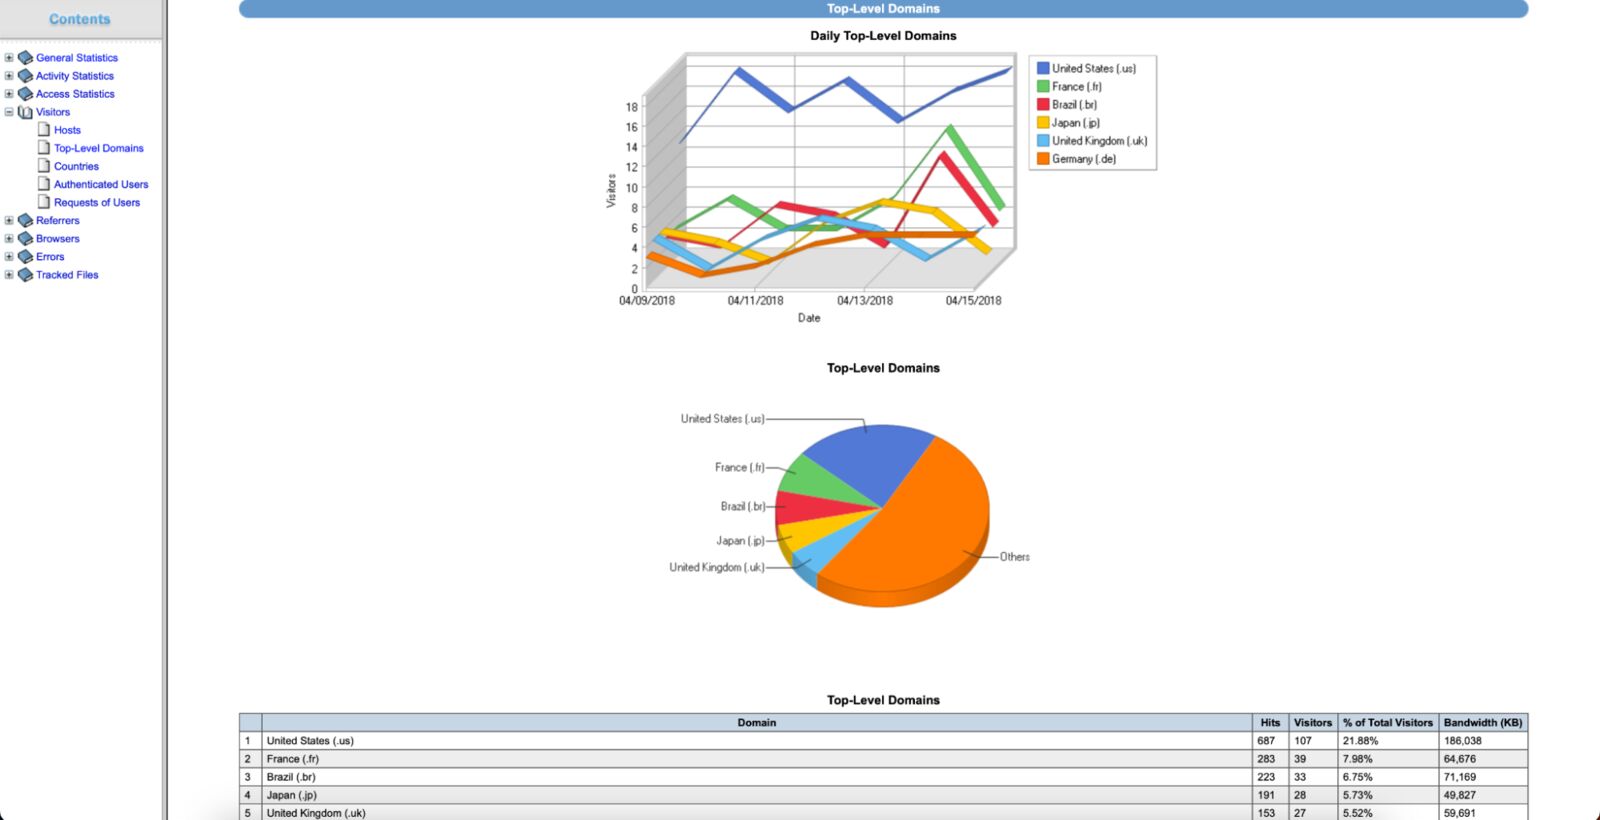
9. AWStats
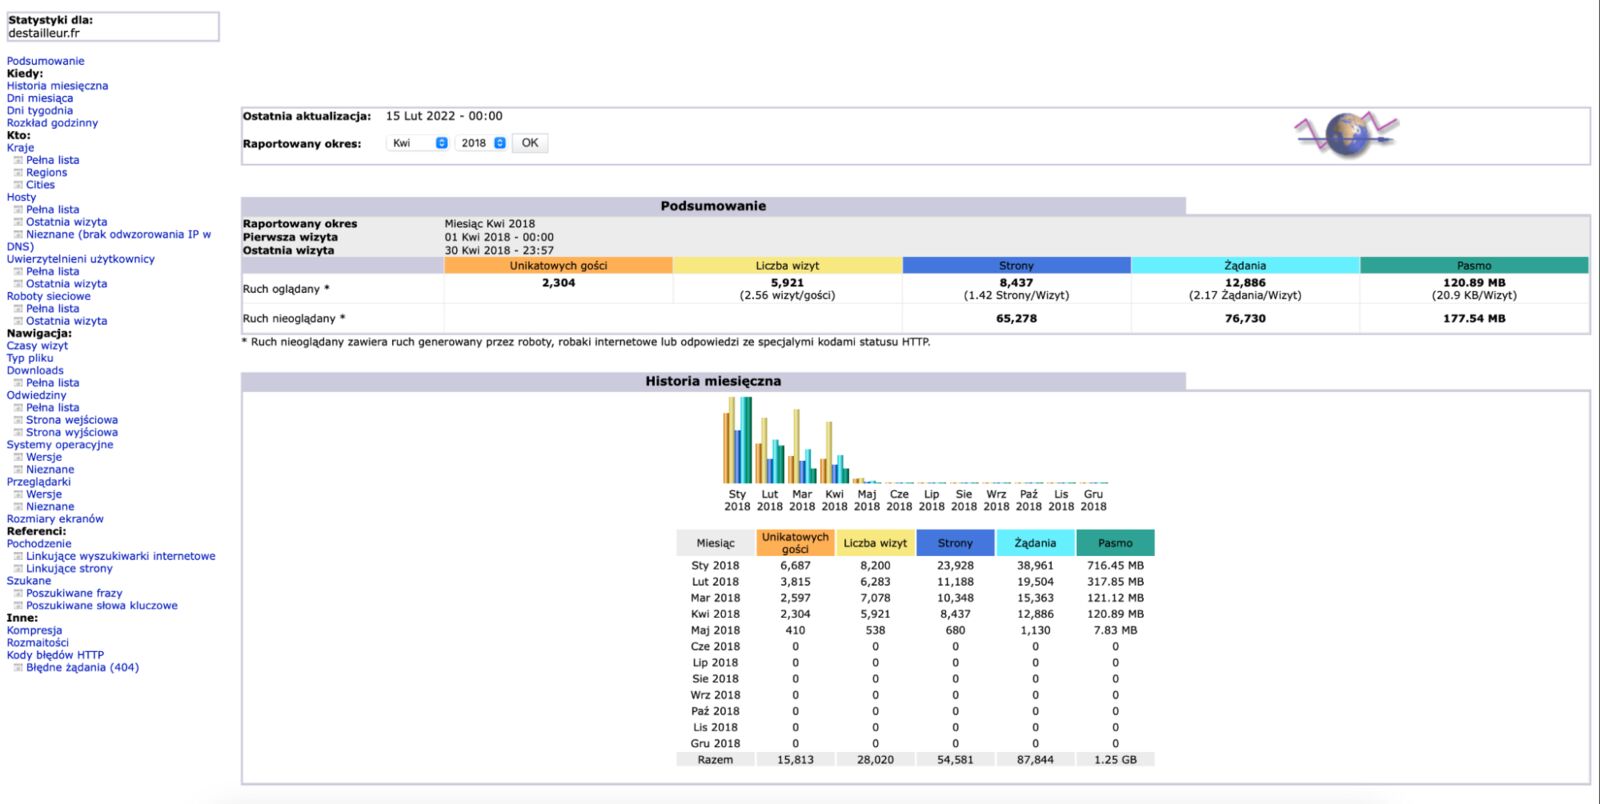
AWStats is a free, full-featured web server log analyzer with support for Apache and the logs it produces. It is published under the GNU GPL license and integrates with other well-established web servers and many more, including proxy, mail servers, and FTP server log files. It provides all the statistics and metrics related to user behavior needed to solve issues before they affect users or escalate. AWStats works from the command line as well as a simple web server with very minimal requirements to install and run it.
Pros:
- Very easy to configure and run with first-class support for Apache logs.
- Wide variety of visualizations, including visits and their duration, HTTP errors, rush hours presentation, robots, search engines referring to your site, origin countries and many more.
- Limited resource usage.
- Support for various log formats produced by various components of your infrastructure, starting from other web servers like NGINX and ending at FTP server log files.
Cons:
- No support for any kind of alerting out-of-the-box.
- May seem dated compared to some modern tools like ELK.
Price:
AWStats is a free Apache log analyzer tool with no associated pricing.
10. HTTPS Logs Viewer (formerly Apache Viewer)
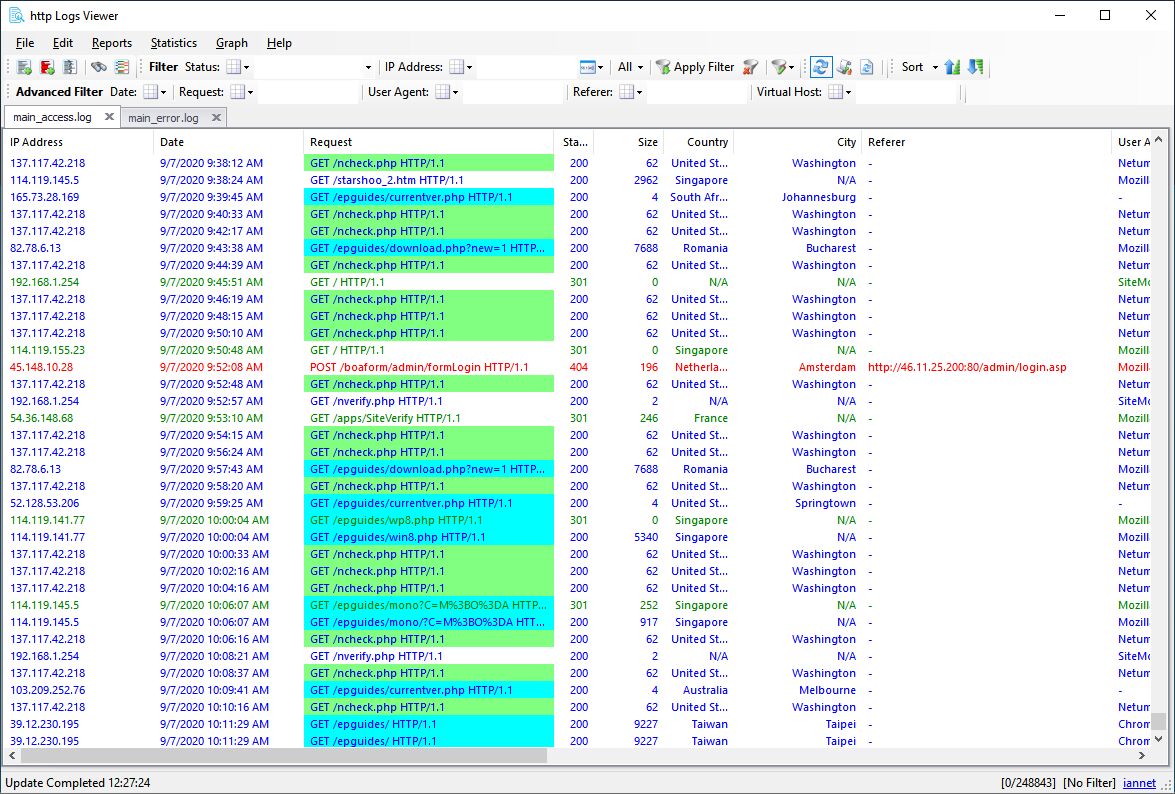
Formerly known as the Apache Viewer, HTTP Logs Viewer is a powerful log management tool that allows monitoring, viewing, and analyzing of Apache HTTP server logs. You can use it to search, filter, and highlight any relevant log events. The solution also supports aggregated statistics based on the logs you analyze, IP and origin country analysis with visualization, and a wide variety of reports such as top user agents, top browsers, top countries, and more.
Pros:
- Support for Apache, IIS, NGINX and Wamp server logs, making it a versatile tool for log analysis.
- Support for search and filtering across logs makes it easy to pinpoint that single, interesting event you are searching for.
- Rich reporting support for most commonly needed reports gives you full visibility into your visitors’ behavior.
- Rich visualization support, including geographical data analysis.
Cons:
- Some features, like visualizations and certain reports, are behind a paywall.
- Not a distributed application meaning that you can’t easily share the reports with the whole team
Price:
Apache Logs Viewer is free to use with a limited feature set. Unlocking premium features starts at $20 for individuals and $70 for businesses.
What to Look for in an Apache Log Analyzer?
The answer depends on your logging needs and the size of the organization you are working with. That dictates the tool form – for large organizations with many Apache instances, you need a tool that can easily accept the data from all of them. If your infrastructure is dynamically scaled, such a tool should also be scalable to scale with you. If your organization and infrastructure are small, you will probably be OK with a less complicated tool.
However, no matter the size of your organization, the Apache log analyzer should allow you to slice and dice logs and provide insights in a visual form about your users, errors and issues. Depending on your Apache usage, you may also look for automatic alerting and custom dashboarding capabilities.
Conclusion
Understanding the traffic served by your Apache instances, the resources it needs and the software’s health is crucial for ensuring users get the optimal experience when accessing the content you want to deliver. It doesn’t matter if that is a simple website or a very complex application – users like applications that are running smoothly. Understanding Apache logs helps with that. You can spot potential problems quickly and react immediately – quicker than most users will notice. This ensures user satisfaction and is key to a healthy Apache installation.
A good Apache log analysis tool will give you insights into metrics derived from your server logs. Hopefully, this blog post gave you an overview of the potential solutions you can consider when looking for the right tool for your use case.
If Sematext caught your eye, use the 14-day free trial to decide whether this is the right Apache log analyzer for you.