MySQL
MySQL is an open-source relational database management system (RDBMS) that enables efficient organization, storage, and retrieval of data using SQL (Structured Query Language). The Sematext Agent collects MySQL metrics and logs, transmits them to Sematext Cloud; installing the agent takes less than 5 minutes.
Install Sematext Agent
- Create an MySQL Logs or Monitoring App. This will let you install the agent and control access to your monitoring and logs data.
- Install the Sematext Agent according to the https://apps.sematext.com/ui/howto/MySQL/overview displayed in the UI.
- After installing the agent, the Discovery tab shows all the MySQL services identified on the host and you will start receiving metrics or logs from MySQL services.
- If you've created an MySQL Monitoring App and want to collect MySQL logs as well, or vice versa, click on the Create Logs App button from the left menu panel. This will navigate you to the 'Create Logs App' (or Monitoring App) page, where you'll find all the discovered log sources from MySQL services and manage log and metric shipping effortlessly.
Having both MySQL Logs and Monitoring Apps lets you correlate performance metrics and logs, and accelerate troubleshooting using Split Screen for faster resolution. For example, correlating metrics (such as query execution time, throughput, and resource utilization) with logs (query execution logs, error logs) helps in identifying slow queries, inefficient indexing, or resource bottlenecks. This correlation aids in optimizing queries, refining indexing strategies, and fine-tuning resource allocation for better MySQL performance.
To explore logs and services across multiple hosts, navigate to Fleet & Discovery > Discovery > Services (or Sematext Cloud Europe). From there, you can create additional Apps or stream data to existing ones without requiring any additional installations.
Metrics
| Metric Name Key (Type) (Unit) |
Description |
|---|---|
| binlog cache disk use mysql.binlog.cache.use.disk (long counter) |
Binlog_cache_disk_use: The number of transactions that used the temporary binary log cache but that exceeded the value of binlog_cache_size and used a temporary file to store statements from the transaction |
| binlog cache use mysql.binlog.cache.use (long counter) |
Binlog_cache_use: The number of transactions that used the temporary binary log cache |
| binlog stmt cache disk use mysql.binlog.stmt.cache.use.disk (long counter) |
Binlog_stmt_cache_disk_use: The number of nontransaction statements that used the binary log statement cache but that exceeded the value of binlog_stmt_cache_size and used a temporary file to store those statements |
| binlog stmt cache use mysql.binlog.stmt.cache.use (long counter) |
Binlog_stmt_cache_use: The number of nontransactional statements that used the binary log statement cache |
| binlog cache size mysql.binlog.cache.size (long gauge) (bytes) |
binlog_cache_size: The size of the cache to hold the SQL statements for the binary log during a transaction. A binary log cache is allocated for each client if the server supports any transactional storage engines and if the server has the binary log enabled (--log-bin option). If you often use large, multiple-statement transactions, you can increase this cache size to get better performance |
| binlog stmt cache size mysql.binlog.stmt.cache.size (long gauge) |
binlog_stmt_cache_size: Beginning with MySQL 5.5.9, this variable determines the size of the cache for the binary log to hold nontransactional statements issued during a transaction. In MySQL 5.5.3 and later, separate binary log transaction and statement caches are allocated for each client if the server supports any transactional storage engines and if the server has the binary log enabled (--log-bin option). If you often use large nontransactional statements during transactions, you can increase this cache size to get more performance |
| binlog max size mysql.binlog.size.max (long gauge) (bytes) |
max_binlog_size: If a write to the binary log causes the current log file size to exceed the value of this variable, the server rotates the binary logs (closes the current file and opens the next one). The minimum value is 4096 bytes. The maximum and default value is 1GB. |
| commit commands mysql.commands.commit (long counter) |
Com_commit: The number of times COMMIT command has been executed |
| create DB commands mysql.commands.create.db (long counter) |
Com_create_db: The number of times CREATE DATABASE command has been executed |
| create table commands mysql.commands.create.table (long counter) |
Com_create_table: The number of times CREATE TABLE command has been executed |
| create user commands mysql.commands.create.user (long counter) |
Com_create_user: The number of times CREATE USER command has been executed |
| drop DB commands mysql.commands.drop.db (long counter) |
Com_drop_db: The number of times DROP DATABASE command has been executed |
| drop table commands mysql.commands.drop.table (long counter) |
Com_drop_table: The number of times DROP TABLE command has been executed |
| drop user commands mysql.commands.drop.user (long counter) |
Com_drop_user: The number of times DROP USER command has been executed |
| delete commands mysql.commands.delete (long counter) |
Com_delete: The number of times DELETE command has been executed |
| delete multi commands mysql.commands.delete.multi (long counter) |
Com_delete_multi: The number of times DELETE command with multiple-table syntax has been executed |
| insert commands mysql.commands.insert (long counter) |
Com_insert: The number of times INSERT command has been executed |
| insert select commands mysql.commands.insert.select (long counter) |
Com_insert_select: The number of times INSERT with SELECT command has been executed |
| rollback commands mysql.commands.rollback (long counter) |
Com_rollback: The number of times ROLLBACK command has been executed |
| rollback to savepoint commands mysql.commands.replace.rollback.savepoint (long counter) |
Com_rollback_to_savepoint: The number of times ROLLBACK TO SAVEPOINT command has been executed |
| select commands mysql.commands.select (long counter) |
Com_select: The number of times SELECT command has been executed |
| update commands mysql.commands.update (long counter) |
Com_update: The number of times UPDATE command has been executed |
| update multi commands mysql.commands.update.multi (long counter) |
Com_update_multi: The number of times UPDATE command with multiple-table syntax has been executed |
| load commands mysql.commands.load (long counter) |
Com_load: The number of times LOAD command has been executed |
| replace commands mysql.commands.replace (long counter) |
Com_replace: The number of times REPLACE command has been executed |
| replace select commands mysql.commands.replace.select (long counter) |
Com_replace_select: The number of times REPLACE with SELECT command has been executed |
| handler commit mysql.handler.commit (long counter) |
Handler_commit: The number of internal COMMIT statements |
| handler delete mysql.handler.delete (long counter) |
Handler_delete: The number of times that rows have been deleted from tables |
| handler discover mysql.handler.discover (long counter) |
Handler_discover: The MySQL server can ask the NDBCLUSTER storage engine if it knows about a table with a given name. This is called discovery. Handler_discover indicates the number of times that tables have been discovered using this mechanism |
| handler prepare mysql.handler.prepare (long counter) |
Handler_prepare: A counter for the prepare phase of two-phase commit operations |
| handler read first mysql.handler.read.first (long counter) |
Handler_read_first: The number of times the first entry in an index was read. If this value is high, it suggests that the server is doing a lot of full index scans; for example, SELECT col1 FROM foo, assuming that col1 is indexed |
| handler read key mysql.handler.read.key (long counter) |
Handler_read_key: The number of requests to read a row based on a key. If this value is high, it is a good indication that your tables are properly indexed for your queries |
| handler read last mysql.handler.read.last (long counter) |
Handler_read_last: The number of requests to read the last key in an index. With ORDER BY, the server will issue a first-key request followed by several next-key requests, whereas with With ORDER BY DESC, the server will issue a last-key request followed by several previous-key requests. This variable was added in MySQL 5.6.1 |
| handler read next mysql.handler.read.next (long counter) |
Handler_read_next: The number of requests to read the next row in key order. This value is incremented if you are querying an index column with a range constraint or if you are doing an index scan |
| handler read prev mysql.handler.read.prev (long counter) |
Handler_read_prev: The number of requests to read the previous row in key order. This read method is mainly used to optimize ORDER BY ... DESC |
| handler read rnd mysql.handler.read.rnd (long counter) |
Handler_read_rnd: The number of requests to read a row based on a fixed position. This value is high if you are doing a lot of queries that require sorting of the result. You probably have a lot of queries that require MySQL to scan entire tables or you have joins that do not use keys properly |
| handler read rnd next mysql.handler.read.rnd.next (long counter) |
Handler_read_rnd_next: The number of requests to read the next row in the data file. This value is high if you are doing a lot of table scans. Generally this suggests that your tables are not properly indexed or that your queries are not written to take advantage of the indexes you have |
| handler rollback mysql.handler.rollback (long counter) |
Handler_rollback: The number of requests for a storage engine to perform a rollback operation |
| handler savepoint mysql.handler.savepoint (long counter) |
Handler_savepoint: The number of requests for a storage engine to place a savepoint |
| handler savepoint rollback mysql.handler.savepoint.rollback (long counter) |
Handler_savepoint_rollback: The number of requests for a storage engine to roll back to a savepoint |
| handler update mysql.handler.update (long counter) |
Handler_update: The number of requests to update a row in a table |
| handler write mysql.handler.write (long counter) |
Handler_write: The number of requests to insert a row in a table |
| innodb buffer pool pages data mysql.innodb.buffer.pages.data (long gauge) |
Innodb_buffer_pool_pages_data: The number of pages in the InnoDB buffer pool containing data. The number includes both dirty and clean pages |
| innodb buffer pool bytes data mysql.innodb.buffer.bytes.data (long gauge) (bytes) |
Innodb_buffer_pool_bytes_data: The total number of bytes in the InnoDB buffer pool containing data. The number includes both dirty and clean pages |
| innodb buffer pool pages dirty mysql.innodb.buffer.pages.dirty (long gauge) |
Innodb_buffer_pool_pages_dirty: The current number of dirty pages in the InnoDB buffer pool |
| innodb buffer pool bytes dirty mysql.innodb.buffer.bytes.dirty (long gauge) (bytes) |
Innodb_buffer_pool_bytes_dirty: The total current number of bytes held in dirty pages in the InnoDB buffer pool |
| innodb buffer pool pages flushed mysql.innodb.buffer.pages.flushed (long counter) |
Innodb_buffer_pool_pages_flushed: The number of requests to flush pages from the InnoDB buffer pool |
| innodb buffer pool pages free mysql.innodb.buffer.pages.free (long gauge) |
Innodb_buffer_pool_pages_free: The number of free pages in the InnoDB buffer pool |
| innodb buffer pool pages misc mysql.innodb.buffer.pages.misc (long gauge) |
Innodb_buffer_pool_pages_misc: The number of pages in the InnoDB buffer pool that are busy because they have been allocated for administrative overhead, such as row locks or the adaptive hash index |
| innodb buffer pool pages total mysql.innodb.buffer.pages (long gauge) |
Innodb_buffer_pool_pages_total: The total size of the InnoDB buffer pool, in pages |
| innodb buffer pool read ahead rnd mysql.innodb.buffer.read.ahead.rnd (long counter) |
Innodb_buffer_pool_read_ahead_rnd: The number of “random” read-aheads initiated by InnoDB. This happens when a query scans a large portion of a table but in random order |
| innodb buffer pool read ahead seq mysql.innodb.buffer.read.ahead.seq (long counter) |
Innodb_buffer_pool_read_ahead_seq: The number of sequential read-aheads initiated by InnoDB. This happens when InnoDB does a sequential full table scan |
| innodb buffer pool read ahead mysql.innodb.buffer.read.ahead (long counter) |
Innodb_buffer_pool_read_ahead: The number of pages read into the InnoDB buffer pool by the read-ahead background thread. This variable was added in MySQL 5.1.41 |
| innodb buffer pool read ahead evicted mysql.innodb.buffer.read.ahead.evicted (long counter) |
Innodb_buffer_pool_read_ahead_evicted: The number of pages read into the InnoDB buffer pool by the read-ahead background thread that were subsequently evicted without having been accessed by queries. This variable was added in MySQL 5.1.41 |
| innodb buffer pool read requests mysql.innodb.buffer.read.requests (long counter) |
Innodb_buffer_pool_read_requests: The number of logical read requests |
| innodb buffer pool reads mysql.innodb.buffer.reads (long counter) |
Innodb_buffer_pool_reads: The number of logical reads that InnoDB could not satisfy from the buffer pool, and had to read directly from the disk |
| innodb buffer pool wait free mysql.innodb.buffer.wait.free (long counter) |
Innodb_buffer_pool_wait_free: Normally, writes to the InnoDB buffer pool happen in the background. However, if it is necessary to read or create a page and no clean pages are available, it is also necessary to wait for pages to be flushed first. This counter counts instances of these waits. If the buffer pool size has been set properly, this value should be small. |
| innodb buffer pool write requests mysql.innodb.buffer.write.requests (long counter) |
Innodb_buffer_pool_write_requests: The number writes done to the InnoDB buffer pool |
| innodb buffer pool instances mysql.innodb.buffer.instances (long gauge) |
innodb_buffer_pool_instances: The number of regions that the InnoDB buffer pool is divided into |
| innodb buffer pool size mysql.innodb.buffer.size (long gauge) (bytes) |
innodb_buffer_pool_size: The size in bytes of the buffer pool, the memory area where InnoDB caches table and index data |
| innodb data fsyncs mysql.innodb.data.fsyncs (long counter) |
Innodb_data_fsyncs: The number of fsync() operations |
| innodb data pending fsyncs mysql.innodb.data.fsyncs.pending (long gauge) |
Innodb_data_pending_fsyncs: The current number of pending fsync() operations |
| innodb data pending reads mysql.innodb.data.reads.pending (long gauge) |
Innodb_data_pending_reads: The current number of pending reads |
| innodb data pending writes mysql.innodb.data.writes.pending (long gauge) |
Innodb_data_pending_writes: The current number of pending writes |
| innodb data read mysql.innodb.data.read (long counter) (bytes) |
Innodb_data_read: The amount of data read |
| innodb data reads mysql.innodb.data.reads (long counter) |
Innodb_data_reads: The number of data reads |
| innodb data writes mysql.innodb.data.writes (long counter) |
Innodb_data_writes: The number of data writes |
| innodb data written mysql.innodb.data.written (long counter) (bytes) |
Innodb_data_written: The amount of data written in bytes |
| innodb dblwr pages written mysql.innodb.pages.written.dblwr (long counter) |
Innodb_dblwr_pages_written: The number of pages that have been written for doublewrite operations |
| innodb dblwr writes mysql.innodb.pages.writes.dblwr (long counter) |
Innodb_dblwr_writes: The number of doublewrite operations that have been performed |
| innodb page size mysql.innodb.pages.size (long gauge) (bytes) |
Innodb_page_size: The compiled-in InnoDB page size (default 16KB) |
| innodb pages created mysql.innodb.pages.created (long counter) |
Innodb_pages_created: The number of pages created |
| innodb pages read mysql.innodb.pages.read (long counter) |
Innodb_pages_read: The number of pages read |
| innodb pages written mysql.innodb.pages.written (long counter) |
Innodb_pages_written: The number of pages written |
| innodb row lock current waits mysql.innodb.lock.waiting (long gauge) |
Innodb_row_lock_current_waits: The number of row locks currently being waited for |
| innodb row lock time mysql.innodb.lock.acquiring.time (long counter) (ms) |
Innodb_row_lock_time: The total time spent in acquiring row locks |
| innodb row lock time avg mysql.innodb.lock.acquiring.time.avg (double gauge) (ms) |
Innodb_row_lock_time_avg: The average time to acquire a row lock |
| innodb row lock time max mysql.innodb.lock.acquiring.time.max (long gauge) (ms) |
Innodb_row_lock_time_max: The maximum time to acquire a row lock |
| innodb row lock waits mysql.innodb.lock.waits (long counter) |
Innodb_row_lock_waits: The number of times a row lock had to be waited for |
| innodb rows deleted mysql.innodb.rows.deleted (long counter) |
Innodb_rows_deleted: The number of rows deleted from InnoDB tables |
| innodb rows inserted mysql.innodb.rows.inserted (long counter) |
Innodb_rows_inserted: The number of rows inserted into InnoDB tables |
| innodb rows read mysql.innodb.rows.read (long counter) |
Innodb_rows_read: The number of rows read from InnoDB tables |
| innodb rows updated mysql.innodb.rows.updated (long counter) |
Innodb_rows_updated: The number of rows updated in InnoDB tables |
| innodb log waits mysql.innodb.log.waits (long counter) |
Innodb_log_waits: The number of times that the log buffer was too small and a wait was required for it to be flushed before continuing |
| innodb log write requests mysql.innodb.log.write.requests (long counter) |
Innodb_log_write_requests: The number of log write requests |
| innodb log writes mysql.innodb.log.writes (long counter) |
Innodb_log_writes: The number of physical writes to the log file |
| innodb os log fsyncs mysql.innodb.log.fsyncs (long counter) |
Innodb_os_log_fsyncs: The number of fsync() writes done to the log file |
| innodb os log pending fsyncs mysql.innodb.log.fsyncs.pending (long gauge) |
Innodb_os_log_pending_fsyncs: The number of pending log file fsync() operations |
| innodb os log pending writes mysql.innodb.log.writes.pending (long gauge) |
Innodb_os_log_pending_writes: The number of pending log file writes |
| innodb os log written mysql.innodb.log.written (long counter) (bytes) |
Innodb_os_log_written: The number of bytes written to the log file |
| innodb additional memory pool mysql.innodb.mem.additional.size (long gauge) (bytes) |
innodb_additional_mem_pool_size: The size in bytes of a memory pool InnoDB uses to store data dictionary information and other internal data structures. The more tables you have in your application, the more memory you need to allocate here. |
| innodb autoextend increment mysql.innodb.autoextend.increment (long gauge) (MB) |
innodb_autoextend_increment: The increment size (in megabytes) for extending the size of an auto-extending system tablespace file when it becomes full. The default value is 8 |
| innodb concurrency tickets mysql.innodb.concurrency.tickets (long gauge) |
innodb_concurrency_tickets: Determines the number of threads that can enter InnoDB concurrently. A thread is placed in a queue when it tries to enter InnoDB if the number of threads has already reached the concurrency limit. When a thread is permitted to enter InnoDB, it is given a number of “ tickets” equal to the value of innodb_concurrency_tickets, and the thread can enter and leave InnoDB freely until it has used up its tickets |
| innodb io capacity mysql.innodb.io.capacity (long gauge) |
innodb_io_capacity: The innodb_io_capacity parameter sets an upper limit on the number of I/O operations performed per second by InnoDB background tasks, such as flushing pages from the buffer pool and merging data from the change buffer. |
| innodb lock wait timeout mysql.innodb.lock.waiting.timeout (long gauge) (sec) |
innodb_lock_wait_timeout: The length of time in seconds an InnoDB transaction waits for a row lock before giving up. The default value is 50 seconds. |
| innodb log buffer size mysql.innodb.log.buffer.size (long gauge) (bytes) |
innodb_log_buffer_size: The size in bytes of the buffer that InnoDB uses to write to the log files on disk. The default value is 8MB. A large log buffer enables large transactions to run without a need to write the log to disk before the transactions commit. Thus, if you have transactions that update, insert, or delete many rows, making the log buffer larger saves disk I/O |
| innodb log file size mysql.innodb.log.file.size (long gauge) (bytes) |
innodb_log_file_size: The size in bytes of each log file in a log group |
| innodb group log files mysql.innodb.log.group.files (long gauge) |
innodb_log_files_in_group: The number of log files in the log group. InnoDB writes to the files in a circular fashion. The default (and recommended) value is 2. |
| innodb max dirty pages % mysql.innodb.dirty.pages.pct.max (double gauge) (%) |
innodb_max_dirty_pages_pct: InnoDB tries to flush data from the buffer pool so that the percentage of dirty pages does not exceed this value. Specify an integer in the range from 0 to 99. The default value is 75. |
| innodb max purge lag mysql.innodb.purge.lag.max (long gauge) (microsec) |
innodb_max_purge_lag: Controls how to delay INSERT, UPDATE, and DELETE operations when purge operations are lagging (see Section 14.6, InnoDB Multi-Versioning). The unit value is microseconds. The default value is 0 (no delays). |
| innodb old blocks % mysql.innodb.blocks.old.pct (long gauge) (%) |
innodb_old_blocks_pct: Specifies the approximate percentage of the InnoDB buffer pool used for the old block sublist. The range of values is 5 to 95. The default value is 37 (that is, 3/8 of the pool). |
| innodb old blocks time mysql.innodb.blocks.old.time (long gauge) (ms) |
innodb_old_blocks_time: Specifies how long in milliseconds a block inserted into the old sublist must stay there after its first access before it can be moved to the new sublist |
| innodb open files mysql.innodb.files.open (long gauge) |
innodb_open_files: This configuration option is only relevant if you use multiple InnoDB tablespaces. It specifies the maximum number of .ibd files that MySQL can keep open at one time. The minimum value is 10. The default value is 300. |
| innodb purge batch size mysql.innodb.purge.batch.size (long gauge) |
innodb_purge_batch_size: Defines the number of undo log pages that purge parses and processes in one batch from the history list |
| innodb purge threads mysql.innodb.purge.threads (long gauge) |
innodb_purge_threads: The number of background threads devoted to the InnoDB purge operation. Currently, can only be 0 (the default) or 1. The default value of 0 signifies that the purge operation is performed as part of the master thread. |
| innodb read ahead threshold mysql.innodb.buffer.read.ahead.threshold (long gauge) |
innodb_read_ahead_threshold: Controls the sensitivity of linear read-ahead that InnoDB uses to prefetch pages into the buffer pool. The permissible range of values is 0 to 64. The default is 56: InnoDB must read at least 56 pages sequentially from an extent to initiate an asynchronous read for the following extent |
| innodb read io threads mysql.innodb.io.read.threads (long gauge) |
innodb_read_io_threads: The number of I/O threads for read operations in InnoDB. |
| key blocks not flushed mysql.myisam.key.blocks.unflushed (long gauge) |
Key_blocks_not_flushed: The number of key blocks in the key cache that have changed but have not yet been flushed to disk |
| key blocks unused mysql.myisam.key.blocks.unused (long gauge) |
Key_blocks_unused: The number of unused blocks in the key cache. You can use this value to determine how much of the key cache is in use |
| key blocks used mysql.myisam.key.blocks.used (long gauge) |
Key_blocks_used: The number of used blocks in the key cache. This value is a high-water mark that indicates the maximum number of blocks that have ever been in use at one time |
| key read requests mysql.myisam.key.read.reaquests (long counter) |
Key_read_requests: The number of requests to read a key block from the cache |
| key reads mysql.myisam.key.read.blocks (long counter) |
Key_reads: The number of physical reads of a key block from disk. If Key_reads is large, then your key_buffer_size value is probably too small |
| key write requests mysql.myisam.key.write.requests (long counter) |
Key_write_requests: The number of requests to write a key block to the cache |
| key writes mysql.myisam.key.write.blocks (long counter) |
Key_writes: The number of physical writes of a key block to disk |
| key cache age threshold mysql.myisam.key.cache.age.threshold (long gauge) |
key_cache_age_threshold: This value controls the demotion of buffers from the hot sublist of a key cache to the warm sublist. Lower values cause demotion to happen more quickly |
| key cache block size mysql.myisam.key.cache.block.size (long gauge) (bytes) |
key_cache_block_size: The size in bytes of blocks in the key cache |
| key cache division limit % mysql.myisam.key.cache.division.limit (long gauge) (%) |
key_cache_division_limit: The division point between the hot and warm sublists of the key cache buffer list. The value is the percentage of the buffer list to use for the warm sublist. Permissible values range from 1 to 100. The default value is 100 |
| key buffer size mysql.myisam.key.buffer (long gauge) |
key_buffer_size: Index blocks for MyISAM tables are buffered and are shared by all threads. key_buffer_size is the size of the buffer used for index blocks. The key buffer is also known as the key cache. The value of this variable indicates the amount of memory requested. Internally, the server allocates as much memory as possible up to this amount, but the actual allocation might be less. |
| queries in cache mysql.cache.queries.cached (long gauge) |
Qcache_queries_in_cache: The number of queries registered in the query cache |
| free blocks mysql.cache.blocks.free (long gauge) |
Qcache_free_blocks: The number of free memory blocks in the query cache |
| free cache memory mysql.cache.bytes.free (long gauge) (bytes) |
Qcache_free_memory: The amount of free memory for the query cache |
| hits mysql.cache.queries.hits (long counter) |
Qcache_hits: The number of query cache hits |
| inserts mysql.cache.queries.inserts (long counter) |
Qcache_inserts: The number of queries added to the query cache |
| lowmem prunes mysql.cache.queries.prunes.lowmem (long counter) |
Qcache_lowmem_prunes: The number of queries that were deleted from the query cache because of low memory |
| queries not cached mysql.cache.queries.noncached (long counter) |
Qcache_not_cached: The number of noncached queries (not cacheable, or not cached due to the query_cache_type setting) |
| total blocks mysql.cache.blocks (long gauge) |
Qcache_total_blocks: The total number of blocks in the query cache |
| query cache size mysql.cache.bytes (long gauge) (bytes) |
query_cache_size: The amount of memory allocated for caching query results. The default value is 0, which disables the query cache |
| cache limit mysql.cache.limit (long gauge) (bytes) |
query_cache_limit: Do not cache results that are larger than this number of bytes. The default value is 1MB |
| min cache blocks size mysql.cache.min.res.unit (long gauge) (bytes) |
query_cache_min_res_unit: The minimum size (in bytes) for blocks allocated by the query cache. The default value is 4096 (4KB) |
| seconds behind master mysql.repl.slave.behind.seconds (long gauge) (sec) |
Seconds_Behind_Master: This field is an indication of how “late” the slave is. In essence, this field measures the time difference in seconds between the slave SQL thread and the slave I/O thread. If the network connection between master and slave is fast, the slave I/O thread is very close to the master, so this field is a good approximation of how late the slave SQL thread is compared to the master. If the network is slow, this is not a good approximation |
| slave heartbeat period mysql.repl.slave.heartbeats.period (double gauge) (sec) |
Slave_heartbeat_period: Shows the replication heartbeat interval on a replication slave |
| slave open temp tables mysql.repl.slave.tables.temp.open (long gauge) |
Slave_open_temp_tables: The number of temporary tables that the slave SQL thread currently has open. If the value is greater than zero, it is not safe to shut down the slave |
| slave received heartbeats mysql.repl.slave.heartbeats.received (long counter) |
Slave_received_heartbeats: This counter increments with each replication heartbeat received by a replication slave since the last time that the slave was restarted or reset, or a CHANGE MASTER TO statement was issued |
| slave retried transactions mysql.repl.slave.transactions.retired (long counter) |
Slave_retried_transactions: The total number of times since startup that the replication slave SQL thread has retried transactions |
| aborted clients mysql.connections.aborted (long counter) |
Aborted_clients: The number of connections that were aborted because the client died without closing the connection properly |
| aborted connects mysql.connections.failed (long counter) |
Aborted_connects: The number of failed attempts to connect to the MySQL server |
| max used connections mysql.connections.concurrent.max (long gauge) |
Max_used_connections: The maximum number of connections that have been in use simultaneously since the server started |
| bytes received mysql.traffic.rx.bytes (long counter) (bytes) |
Bytes_received: The number of bytes received from all clients |
| bytes sent mysql.traffic.tx.bytes (long counter) (bytes) |
Bytes_sent: The number of bytes sent to all clients |
| created tmp disk tables mysql.tables.tmp.disk (long counter) |
Created_tmp_disk_tables: The number of internal on-disk temporary tables created by the server while executing statements. If an internal temporary table is created initially as an in-memory table but becomes too large, MySQL automatically converts it to an on-disk table |
| created tmp files mysql.files.tmp.created (long counter) |
Created_tmp_files: How many temporary files mysqld has created |
| created tmp tables mysql.tables.tmp (long counter) |
Created_tmp_tables: The number of internal temporary tables created by the server while executing statements |
| open files mysql.files.open (long gauge) |
Open_files: The number of files that are open. This count includes regular files opened by the server |
| open streams mysql.files.streams (long gauge) |
Open_streams: The number of streams that are open (used mainly for logging) |
| open table definitions mysql.tables.definition.open (long gauge) |
Open_table_definitions: The number of cached .frm files |
| open tables mysql.tables.open (long gauge) |
Open_tables: The number of tables that are open |
| opened files mysql.files.my_open (long counter) |
Opened_files: The number of files that have been opened with my_open() |
| opened table definitions mysql.tables.definition.opened (long counter) |
Opened_table_definitions: The number of .frm files that have been cached |
| opened tables mysql.tables.opened (long counter) |
Opened_tables: The number of tables that have been opened. If Opened_tables is big, your table_open_cache value is probably too small |
| table locks immediate mysql.tables.locks.immediate (long counter) |
Table_locks_immediate: The number of times that a request for a table lock could be granted immediately |
| table locks waited mysql.tables.locks.waited (long counter) |
Table_locks_waited: The number of times that a request for a table lock could not be granted immediately and a wait was needed. If this is high and you have performance problems, you should first optimize your queries, and then either split your table or tables or use replication |
| delayed errors mysql.queries.insert.delayed.errors (long counter) |
Delayed_errors: The number of rows written with INSERT DELAYED for which some error occurred (probably duplicate key) |
| delayed insert threads mysql.queries.insert.delayed.threads (long gauge) |
Delayed_insert_threads: The number of INSERT DELAYED handler threads in use |
| delayed writes mysql.queries.insert.delayed.writes (long counter) |
Delayed_writes: The number of INSERT DELAYED rows written |
| not flushed delayed rows mysql.queries.insert.delayed.queued (long gauge) |
Not_flushed_delayed_rows: The number of rows waiting to be written in INSERT DELAYED queues |
| uptime mysql.uptime (long gauge) (sec) |
Uptime: The number of seconds that the server has been up |
| uptime since flush mysql.uptime.sinceflush (long gauge) (sec) |
Uptime_since_flush_status: The number of seconds since the most recent FLUSH STATUS statement |
| flush commands mysql.tables.flushes (long counter) |
Flush_commands: The number of times the server flushes tables, whether because a user executed a FLUSH TABLES statement or due to internal server operation |
| prepared stmt count mysql.queries.prepared.stmts (long gauge) |
Prepared_stmt_count: The current number of prepared statements. (The maximum number of statements is given by the max_prepared_stmt_count system variable) |
| queries mysql.queries (long counter) |
Queries: The number of statements executed by the server. This variable includes statements executed within stored programs, unlike the Questions variable. It does not count COM_PING or COM_STATISTICS commands. This variable was added in MySQL 5.0.76 |
| questions mysql.queries.client (long counter) |
Questions: The number of statements executed by the server. As of MySQL 5.0.72, this includes only statements sent to the server by clients and no longer includes statements executed within stored programs, unlike the Queries variable. This variable does not count COM_PING, COM_STATISTICS, COM_STMT_PREPARE, COM_STMT_CLOSE, or COM_STMT_RESET commands |
| slow launch threads mysql.threads.slowlaunch (long counter) |
Slow_launch_threads: The number of threads that have taken more than slow_launch_time seconds to create |
| slow queries mysql.queries.slow (long counter) |
Slow_queries: The number of queries that have taken more than long_query_time seconds. This counter increments regardless of whether the slow query log is enabled |
| long query time mysql.queries.slow.latency (double gauge) (sec) |
long_query_time: If a query takes longer than this many seconds, the server increments the Slow_queries status variable. If you are using the --log-slow-queries option, the query is logged to the slow query log file. This value is measured in real time, not CPU time, so a query that is under the threshold on a lightly loaded system might be above the threshold on a heavily loaded one |
| max connections mysql.connections.allowed (long gauge) |
max_connections: The maximum permitted number of simultaneous client connections |
| max user connections mysql.connections.user.max (long gauge) |
max_user_connections: The maximum number of simultaneous connections permitted to any given MySQL user account |
| max prepared stmt count mysql.queries.prepared.stmts.max (long gauge) |
max_prepared_stmt_count: This variable limits the total number of prepared statements in the server. (The sum of the number of prepared statements across all sessions) |
| select full join mysql.queries.select.join.full (long counter) |
Select_full_join: The number of joins that perform table scans because they do not use indexes. If this value is not 0, you should carefully check the indexes of your tables |
| select full range join mysql.queries.select.join.range.full (long counter) |
Select_full_range_join: The number of joins that used a range search on a reference table |
| select range mysql.queries.select.join.range (long counter) |
Select_range: The number of joins that used ranges on the first table. This is normally not a critical issue even if the value is quite large |
| select range check mysql.queries.select.join.check (long counter) |
Select_range_check: The number of joins without keys that check for key usage after each row. If this is not 0, you should carefully check the indexes of your tables |
| select scan mysql.queries.select.join.scan (long counter) |
Select_scan: The number of joins that did a full scan of the first table |
| sort merge passes mysql.queries.sort.mergepasses (long counter) |
Sort_merge_passes: The number of merge passes that the sort algorithm has had to do. If this value is large, you should consider increasing the value of the sort_buffer_size system variable |
| sort range mysql.queries.sort.range (long counter) |
Sort_range: The number of sorts that were done using ranges |
| sort rows mysql.queries.sort.rows (long counter) |
Sort_rows: The number of sorted rows |
| sort scan mysql.queries.sort.scan (long counter) |
Sort_scan: The number of sorts that were done by scanning the table |
| max length for sort data mysql.queries.sort.config.maxlength (long gauge) (bytes) |
max_length_for_sort_data: The cutoff on the size of index values that determines which filesort algorithm to use |
| max sort length mysql.queries.sort.config.sortlength (long gauge) (bytes) |
max_sort_length: The number of bytes to use when sorting data values. Only the first max_sort_length bytes of each value are used; the rest are ignored |
| sort buffer size mysql.queries.sort.config.buffer (long gauge) (bytes) |
sort_buffer_size: Each session that needs to do a sort allocates a buffer of this size. sort_buffer_size is not specific to any storage engine and applies in a general manner for optimization. If you see many Sort_merge_passes per second, you can consider increasing the sort_buffer_size value to speed up ORDER BY or GROUP BY operations that cannot be improved with query optimization or improved indexing |
| table definition cache mysql.tables.definition.cache (long gauge) |
table_definition_cache: The number of table definitions (from .frm files) that can be stored in the definition cache. If you use a large number of tables, you can create a large table definition cache to speed up opening of tables. This variable was added in MySQL 5.1.3 |
| table open cache mysql.tables.cache (long gauge) |
table_open_cache: The number of open tables for all threads. Increasing this value increases the number of file descriptors that mysqld requires. You can check whether you need to increase the table cache by checking the Opened_tables status variable |
| threads cached mysql.threads.cached (long gauge) |
Threads_cached: The number of threads in the thread cache |
| threads connected mysql.threads.connected (long gauge) |
Threads_connected: The number of currently open connections |
| threads created mysql.threads.created (long counter) |
Threads_created: The number of threads created to handle connections. If Threads_created is big, you may want to increase the thread_cache_size value |
| threads running mysql.threads.running (long gauge) |
Threads_running: The number of threads that are not sleeping |
| thread cache size mysql.threads.cached.allowed (long gauge) |
thread_cache_size: How many threads the server should cache for reuse |
| thread stack mysql.threads.stack.size (long gauge) (bytes) |
thread_stack: The stack size for each thread |
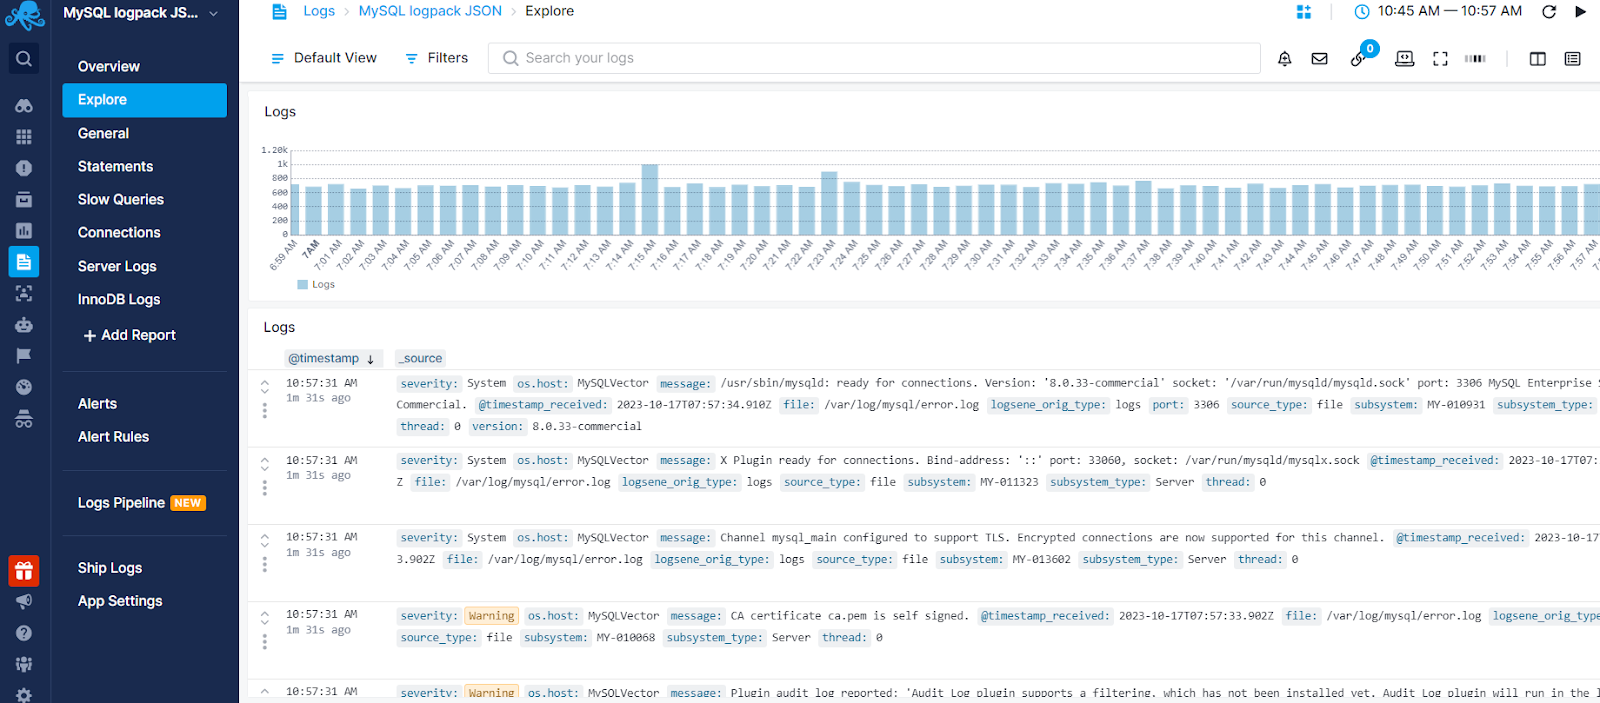
Logs
Once data is in, you can explore it via the built-in reports:
Moreover, the pre-configured anomaly alert rules will notify you about:
- High number of slow queries and queries that are taking more than a certain threshold
- High InnoDB and Server error rates
- Insufficient privileges and failed login attempts to identify security threats
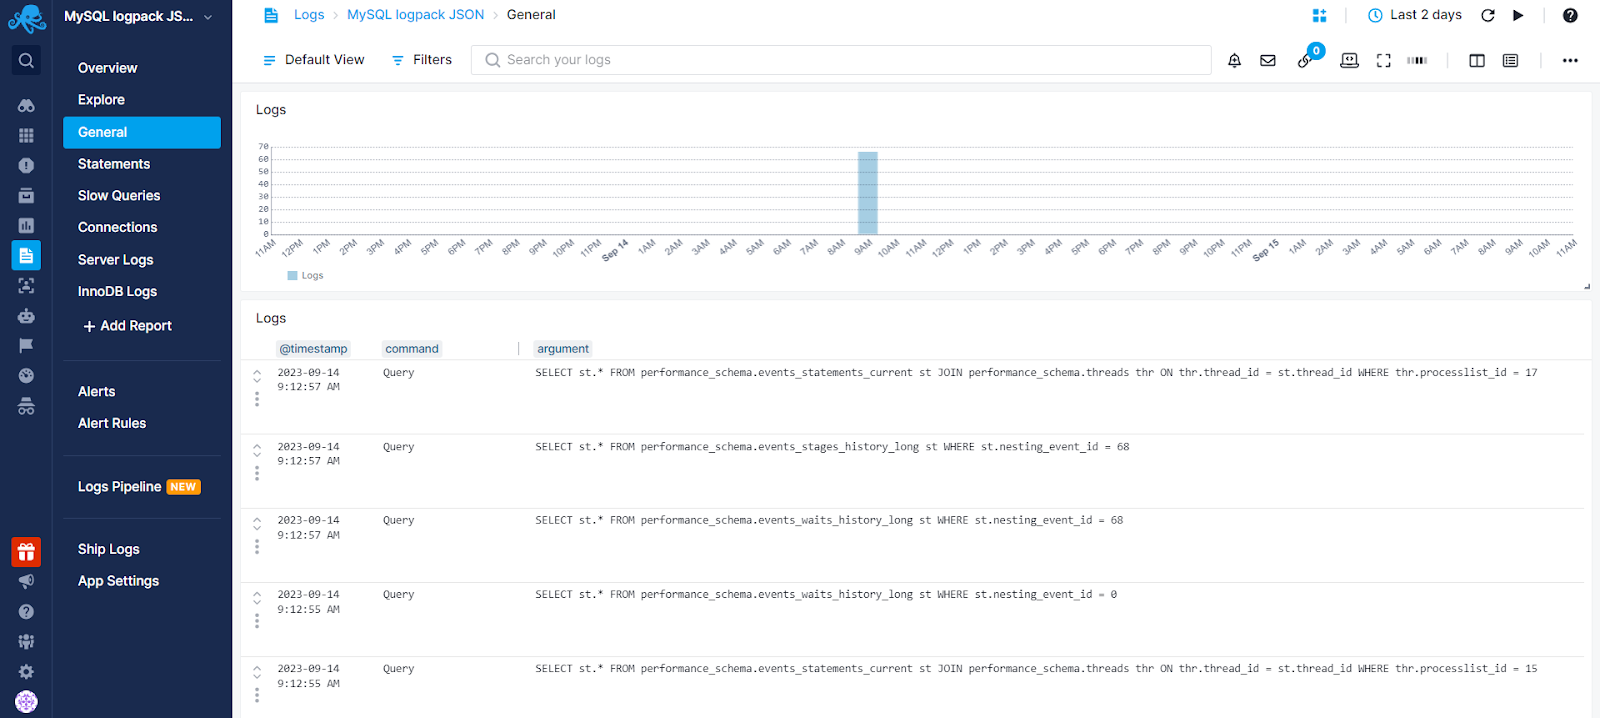
General Logs Report
General logs display connect and disconnect events, as well as SQL statement events from clients. If you suspect an error in a client, you can precisely determine what the client sent to the MySQL instance by examining the general query log.
To enable general logging, execute the following command (for example, from the MySQL command line):
SET GLOBAL general_log = 'ON';
See The General Query Log for more details.
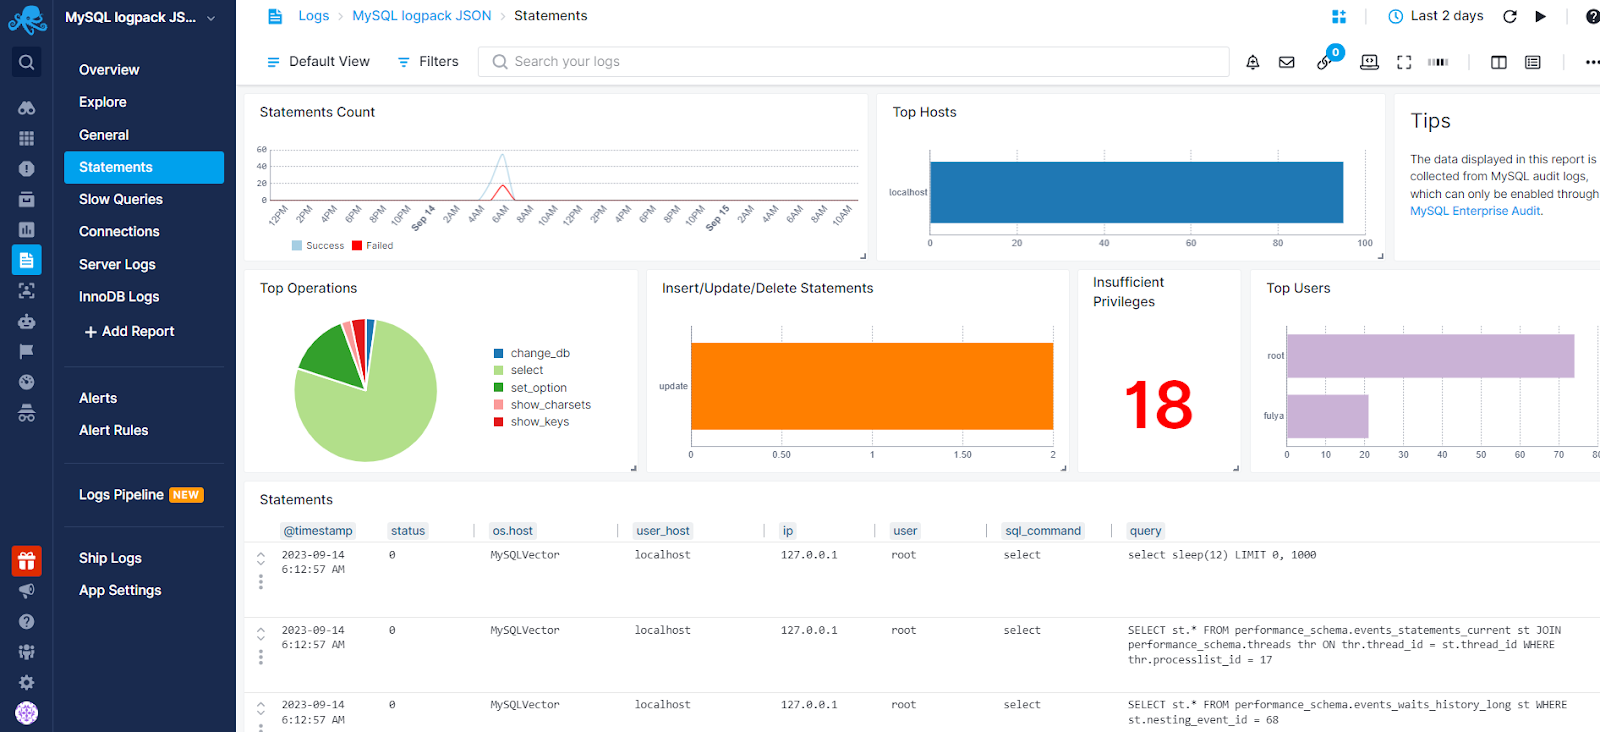
Statements Report
The statement report contains data from audit logs, which can be collected using MySQL Enterprise Audit. This report includes information on the top database operations, users, hosts, insufficient privilege errors, and detailed statement events.
Sematext Agent accepts log files in JSON format. See Audit Logs Format for more details.
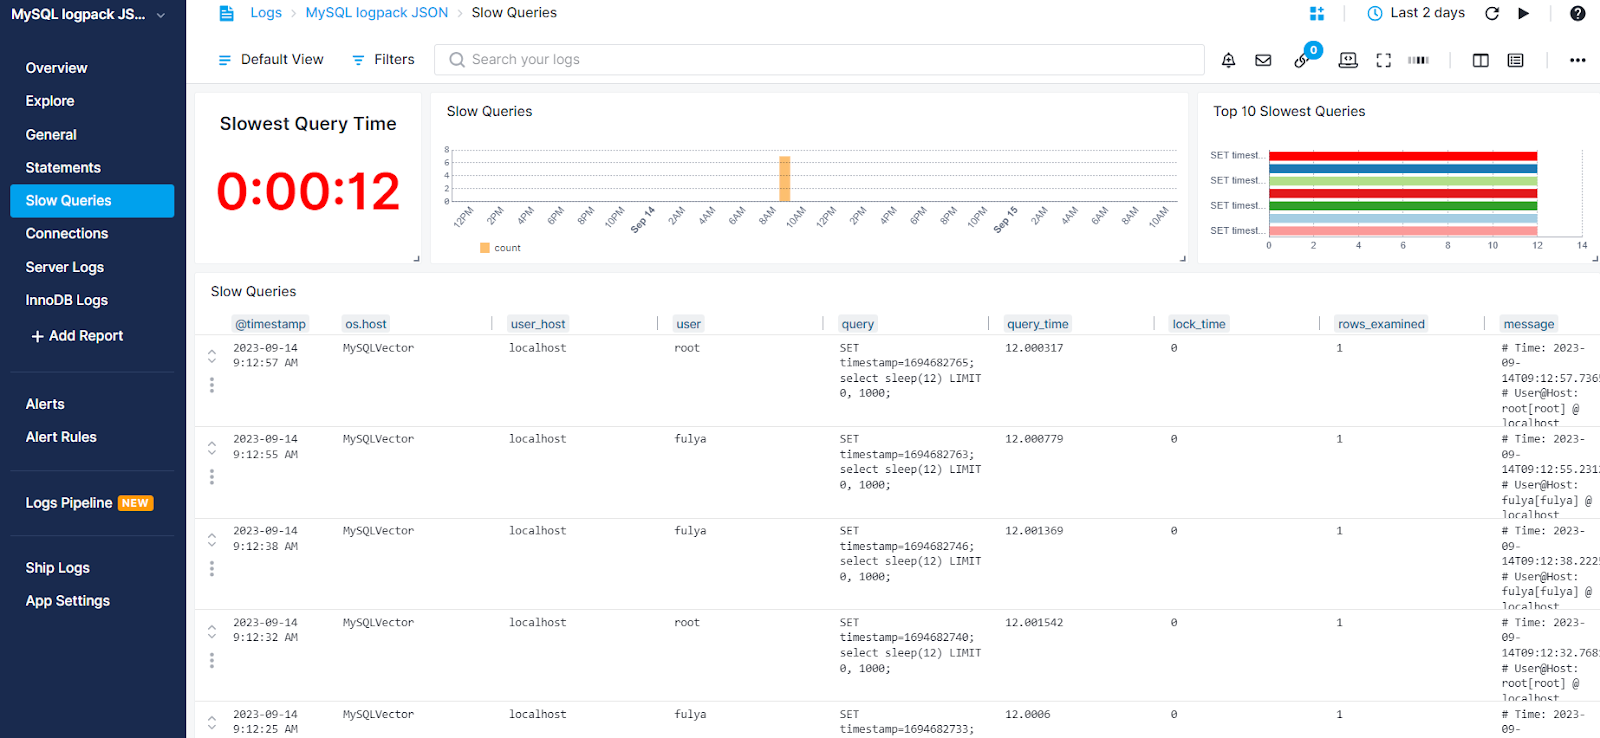
Slow Queries Report
The slow queries report shows detailed information about slow queries that could impact your database performance and overall server performance.
To enable slow query logs, execute the following command(for example, from the MySQL command line):
SET GLOBAL general_log = 'ON';
See The Slow Query Log for more details.
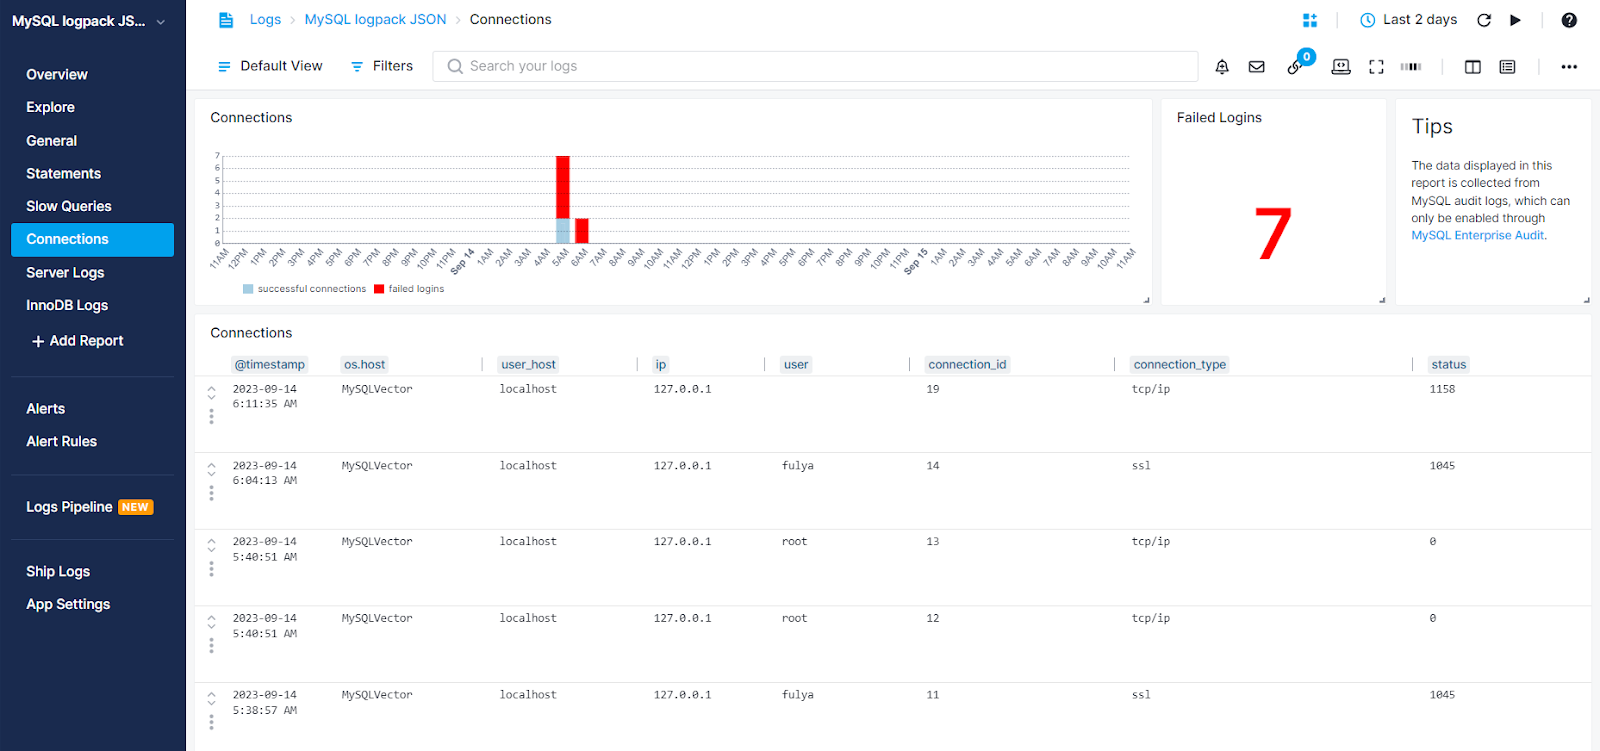
Connections Report
Connections report displays each connection made to MySQL servers, providing user, IP address, connection type, and status information. Additionally, it highlights failed login attempts, allowing you to identify potential security threats. Please note that connection logs can only be collected when using MySQL Enterprise Audit.
Sematext Agent accepts log files in JSON format. See Audit Logs Format for more details.
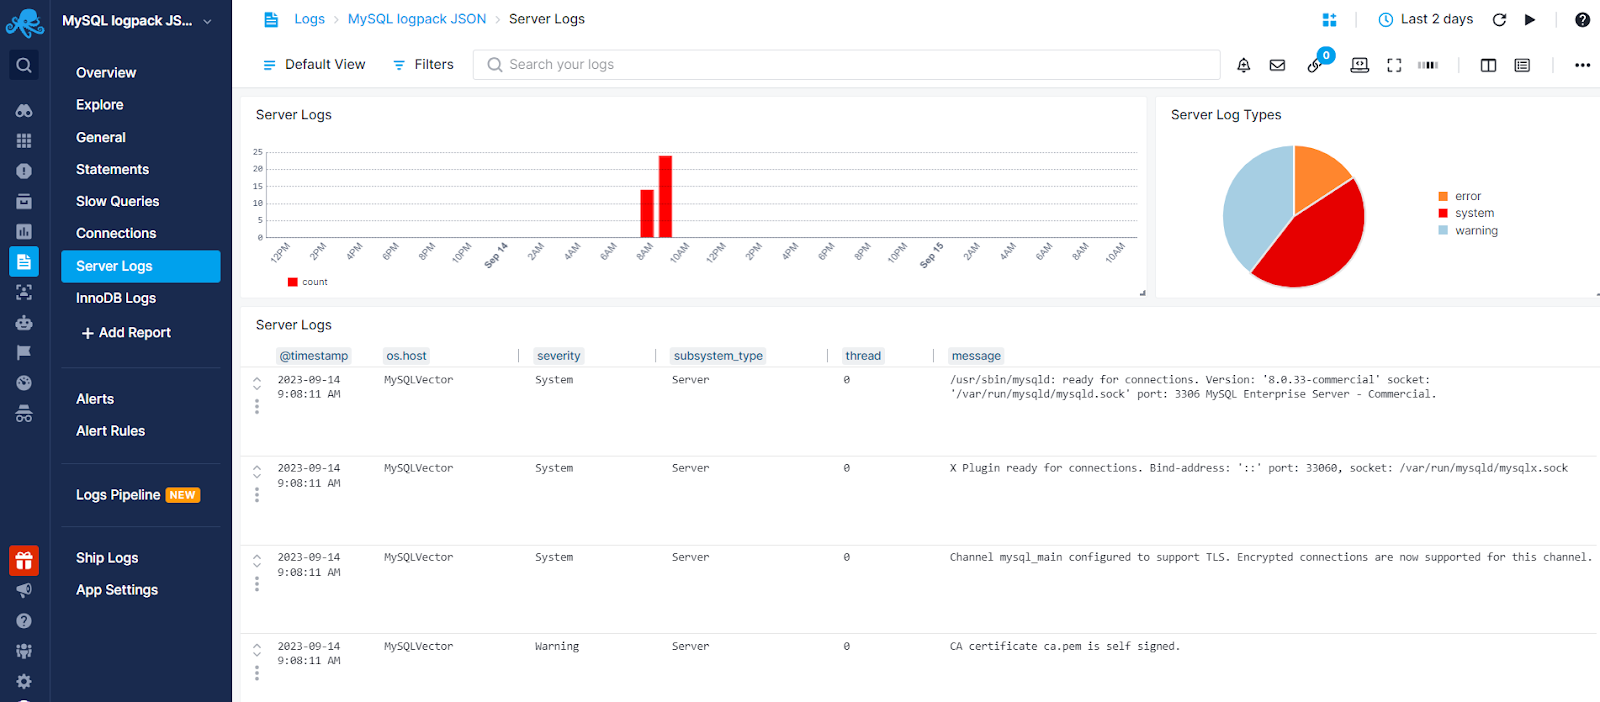
Server Logs Report
Server Logs report helps you detect and troubleshoot critical errors to ensure uninterrupted and optimal system operations.
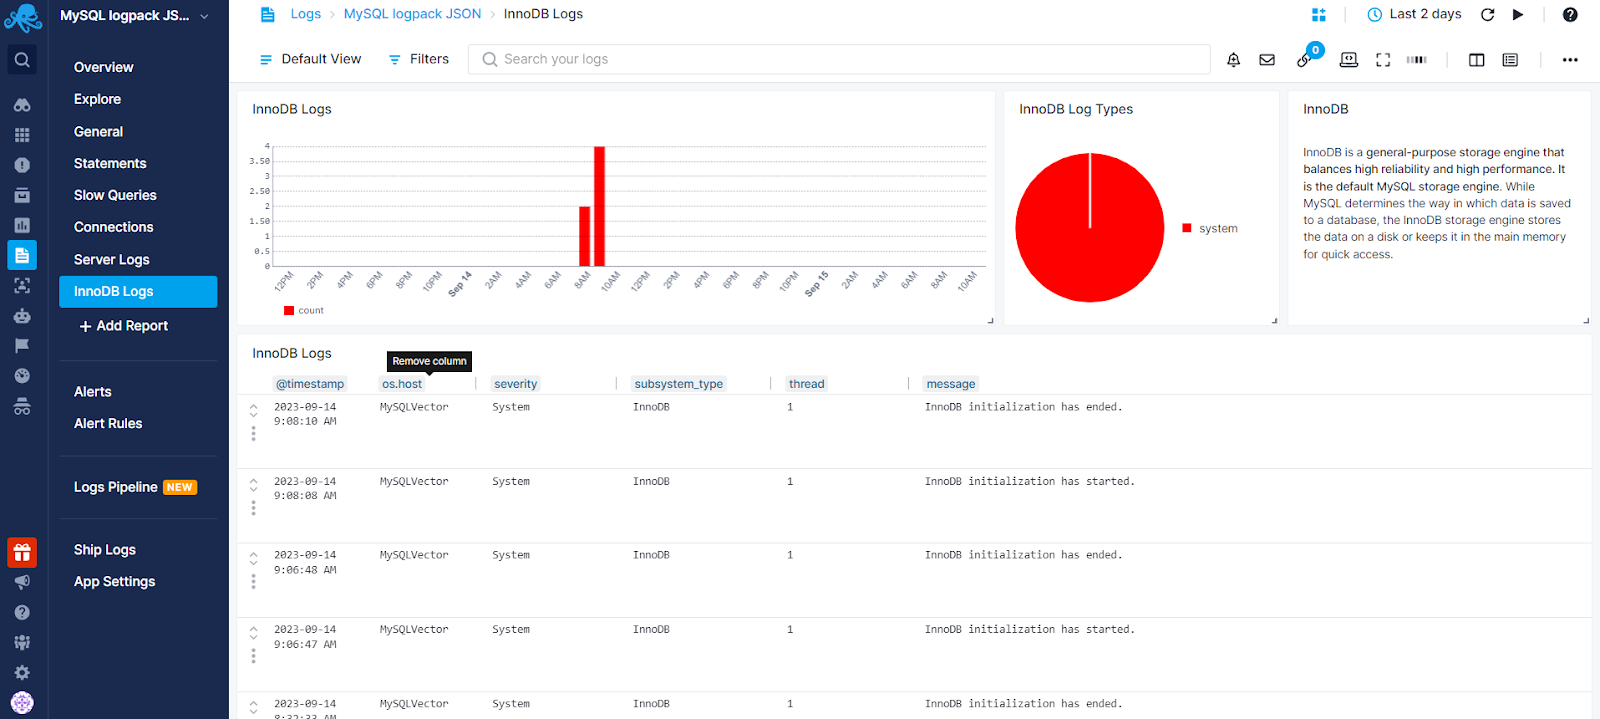
InnoDB Logs Report
InnoDB is a general-purpose storage engine that balances high reliability and high performance. It is the default MySQL storage engine. While MySQL determines the way in which data is saved to a database, the InnoDB storage engine stores the data on a disk or keeps it in the main memory for quick access. InnoDB storage engine logs give you insights into your storage engine's behavior to ensure optimal usage of resources.
Troubleshooting
If you have trouble sending logs, try out the latest version of Sematext Agent. Also, make sure Sematext Agent is configured to send logs to your MySQL Logs App. Lastly, check the Log Agents panel for any errors, and refer to our Sematext Logs FAQ for useful tips.
If you are having issues with Sematext Monitoring, i.e. not seeing MySQL metrics, see How do I create the diagnostics package.
For more troubleshooting information please look at Troubleshooting section.