Solr / SolrCloud
Solr is an open-source search platform used for building and managing powerful search and data retrieval capabilities in applications. The Sematext Agent collects Solr metrics and logs, transmits them to Sematext Cloud; installing the agent takes less than 5 minutes and require no changes in Solr source code or your application source code.
Install Sematext Agent
This lightweight, open-source Monitoring Agent collects Solr performance metrics and sends them to Sematext. It comes packaged with a Golang-based agent responsible for Operating System level metrics like network, disk I/O, and more. The Solr Monitoring Agent can be installed with RPM/DEB package manager on any host running Linux or in a containerized environment using sematext/sematext-agent.
The Sematext Solr Monitoring Agent can be run in two different modes - in-process and standalone. The in-process one is run as a Java agent, it is simpler to initially set up, but will require restarting your Solr node when you will want to upgrade your monitoring Agent, i.e. to get new features. The benefit of the standalone agent mode is that it runs as a separate process and doesn't require a Solr restart when it is installed or upgraded.
- Create an Solr Logs or Monitoring App. This will let you install the agent and control access to your monitoring and logs data.
- Install the Sematext Agent on each host running your Solr/SolrCloud nodes to have the full visibility over the metrics from each host. The full installation instructions can be found in the setup instructions displayed in the UI.
The last step to install Sematext Agent is by running a command like this:
sudo bash /opt/spm/bin/setup-sematext  \
    --monitoring-token <your-monitoring-token-goes-here>   \
    --app-type solrcloud  \
    --agent-type javaagent  \
    --infra-token <your-infra-token-goes-here>
The command above will set up your SolrCloud Monitoring Agent in the in-process mode. To have it running in the standalone mode, run the command below instead of the one above:
sudo bash /opt/spm/bin/setup-sematext  \
    --monitoring-token <your-monitoring-token-goes-here>   \
    --app-type solr  \
    --agent-type standalone  \
    --infra-token <your-infra-token-goes-here>  \
    --jmx-params '-Dspm.remote.jmx.url=localhost:3000'
Keep in mind that your need to provide the Monitoring token and Infra token. They are both provided in the installation instructions for your SolrCloud App.
- Adjust the
solr.in.shfile and add the following section:
SOLR_OPTS="$SOLR_OPTS -Dcom.sun.management.jmxremote
-javaagent:/opt/spm/spm-monitor/lib/spm-monitor-generic.jar=<your-monitoring-token-goes-here>::default"
Or if you would like to run the Solr Monitoring Agent in the standalone mode add the following section to the solr.in.sh file:
SOLR_OPTS="$SOLR_OPTS -Dcom.sun.management.jmxremote -Dcom.sun.management.jmxremote.port=3000 -Dcom.sun.management.jmxremote.ssl=false -Dcom.sun.management.jmxremote.authenticate=false"
Make sure that tag <jmx /> is enabled in your solrconfig.xml file.
You need to restart your Solr node after the changes above.
- After installing the agent, the Discovery tab shows all the Solr services identified on the host and you will start receiving metrics or logs from Solr services.
- If you've created an Solr Monitoring App and want to collect Solr logs as well, or vice versa, click on the Create Logs App button from the left menu panel. This will navigate you to the 'Create Logs App' (or Monitoring App) page, where you'll find all the discovered log sources from Solr services and manage log and metric shipping effortlessly.
Having both Solr Logs and Monitoring Apps lets you correlate performance metrics and logs, and accelerate troubleshooting using Split Screen for faster resolution. For example, your metrics might indicate a sudden spike in query latency or a rise in memory consumption. By correlating this with the logs, you might discover that during this period of high latency, there were specific queries generating errors or that certain indexing tasks were failing due to insufficient resources.
To explore logs and services across multiple hosts, navigate to Fleet & Discovery > Discovery > Services (or Sematext Cloud Europe). From there, you can create additional Apps or stream data to existing ones without requiring any additional installations.
Collected Metrics
The Sematext Solr monitoring agent collects the following metrics.
Operating System
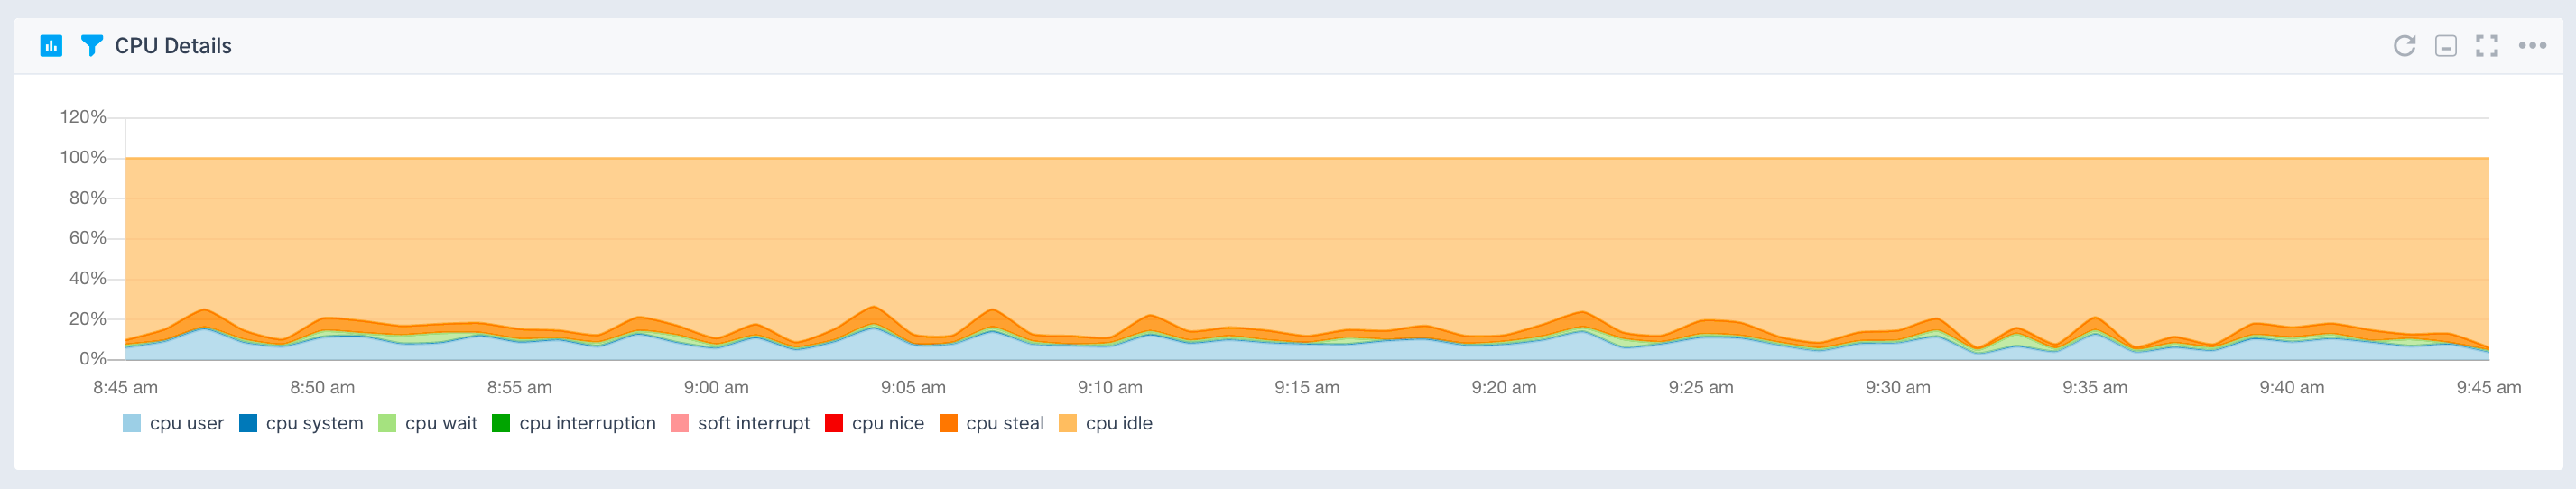
- CPU usage
- CPU load
- Memory usage
- Swap usage
- Disk space used
- I/O Reads and Writes
- Network traffic
Java Virtual Machine
- Garbage collectors time and count
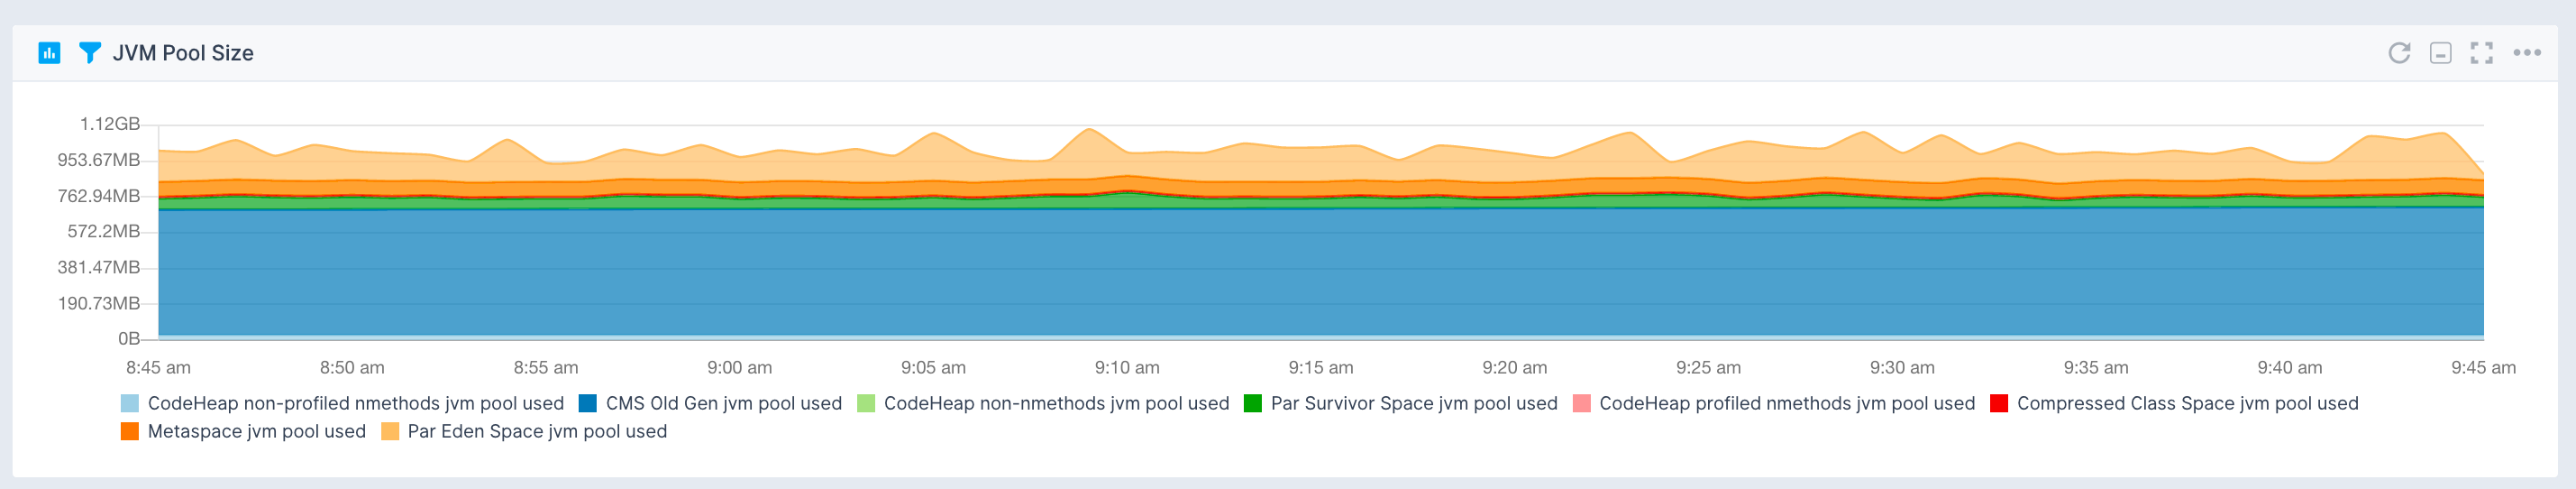
- JVM pool size and utilization
- Threads and daemon threads
- Files opened by the JVM
Solr
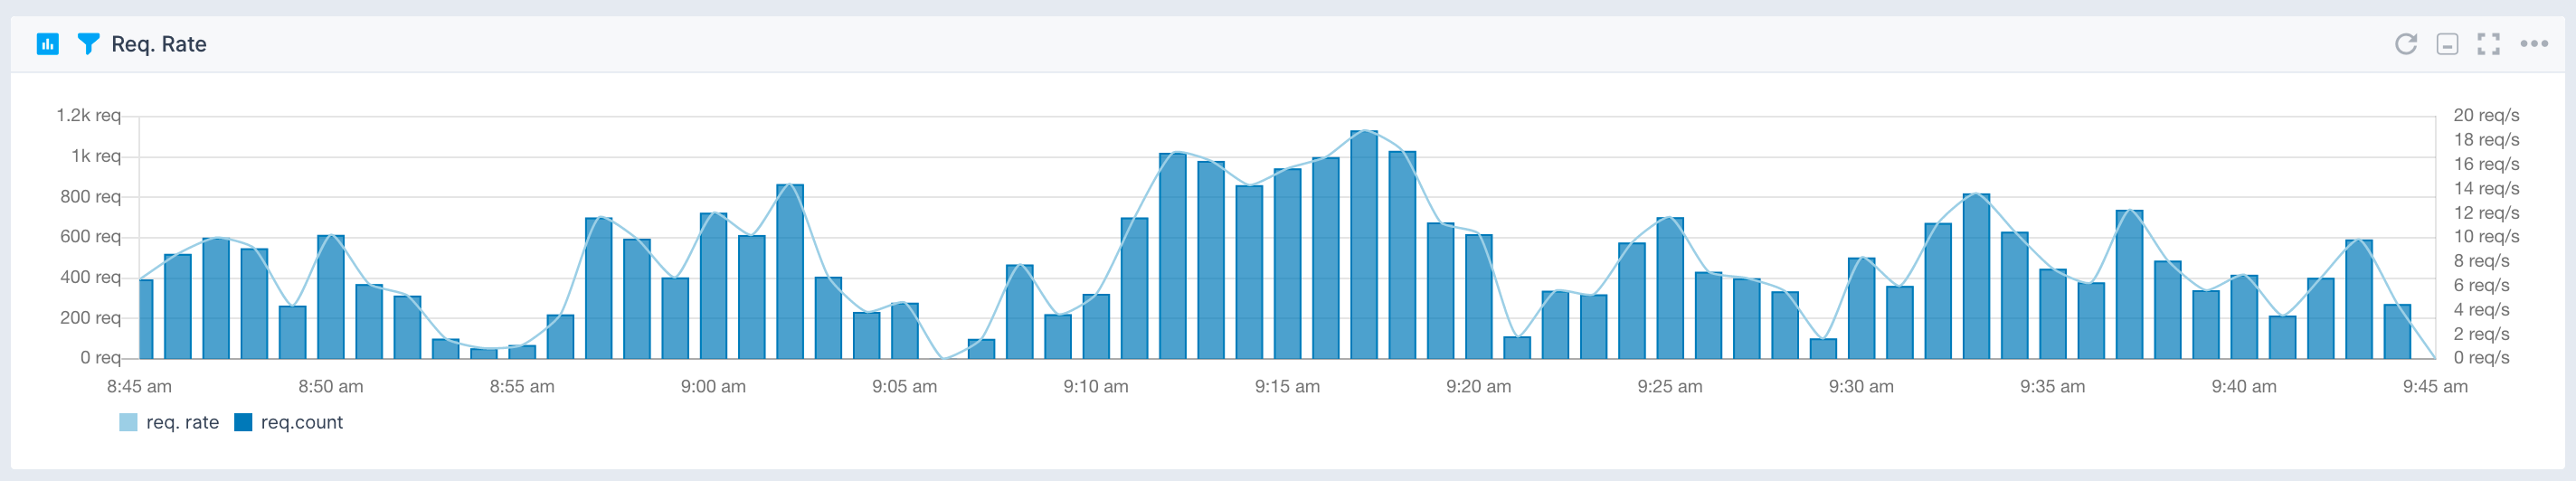
- Requests rate and latency
- Solr index stats and file system stats
- Added and pending documents
- Deletes by id and queries
- Filter cache statistics
- Document cache statistics
- Query result cache statistics
- Per segment filter cache statistics
- Commit events
- Warmup times
Solr Default Alerts
As soon as you create an Elasticsearch App, you will receive a set of default alert rules. These pre-configured rules will notify you of important events that may require your attention, as shown below.
Warmup time > 5m
This alert rule continuously monitors the warmup time of a Solr cache, identifying instances where the warmup time exceeds 5 minutes. When such instances are detected, it triggers a warning (WARN priority). The minimum delay between consecutive alerts triggered by this alert rule is set to 10 minutes.
Suppose a Solr cache is configured to warm up before serving requests, and the typical warmup time is around 3 minutes. However, due to increased data volume or inefficient warmup processes, the warmup time suddenly increases to 7 minutes. When this happens, the alert rule checks for warmup time anomalies over the last 5 minutes. Upon detecting the warmup time anomaly, the alert rule triggers a warning.
Actions to take
- Review the warmup process of the Solr cache for any bottlenecks or configuration issues contributing to the extended warmup time
- Optimize the warmup process by
- Adjusting the autoWarmCount parameter for relevant caches
- Verifying the frequency of soft commits (either autoSoftCommit or from the application) to check if they happening too often
- Optimizing queries used during warmup or adjusting cache configuration settings to reduce warmup time. This may involve tuning the newSearcher queries
You can create additional alerts on any metric.
Metrics
| Metric Name Key (Type) (Unit) |
Description |
|---|---|
| cache lookups solr.cache.lookups (long counter) |
lookups count |
| cache hits solr.cache.hits (long counter) |
hits count |
| cache size solr.cache.size (long gauge) |
cache size (count of elements) |
| cache evictions solr.cache.evicted (long counter) |
count of evictions |
| warmup time solr.warmup.time (long counter) (ms) |
warmup time |
| cache memory used solr.cache.size.bytes (long gauge) (bytes) |
cache size in bytes |
| cache max size solr.cache.size.max (long gauge) |
cache max size |
| autowarm count or % solr.cache.autowarm.count (long gauge) |
cache autowarm count or % |
| request time solr.requests.time (long counter) (ms) |
request time |
| req.count solr.requests (long counter) (req) |
request count |
| avg. request latency solr.requests.latency.avg (double gauge) |
avg. request latency |
| request error count solr.requests.error.count (long counter) |
request error count |
| request timeout count solr.requests.timeout.count (long counter) |
request timeout count |
| index max doc solr.index.docs.max (long gauge) (docs) |
max doc in the index |
| index num docs solr.index.docs (long gauge) (docs) |
number of docs in the index |
| index segments solr.index.segments (long gauge) |
index segments count |
| index num of files solr.index.files (long gauge) |
number of files in solr index |
| index size on the disk solr.index.files.size (long gauge) (bytes) |
size of solr index on the disk |
| commits solr.indexing.commits (long counter) |
total count of commits |
| optimizes solr.indexing.optimizes (long counter) |
count of optimizes |
| rollbacks solr.indexing.rollbacks (long counter) |
count of rollbacks |
| expunge deletes solr.indexing.deletes.expunge (long counter) |
count of expunge deletes |
| index docs added solr.indexing.docs.added (long counter) (docs) |
added docs |
| deletes by id solr.indexing.deletes.id (long counter) |
deletes by id |
| deletes by query solr.indexing.deletes.query (long counter) |
deletes by query |
| update errors solr.indexing.errors (long counter) |
count of update errors |
| autocommits solr.indexing.commits.auto (long counter) |
count of auto commits |
| soft autocommits solr.indexing.commits.soft (long counter) |
count of soft auto commits |
| index docs pending solr.indexing.docs.pending (long gauge) (docs) |
count of pending docs |
| autocommit max time solr.indexing.commits.auto.time.max (long gauge) (ms) |
autocommit max time |
Logs
Once data is in, you can explore it via the built-in reports:
Be sure to check out the Solr Monitoring integration as well, to get a complete view on Solr. For example, if you see logs of a node restarting, metrics let you see the impact on the rest of the cluster in terms of CPU, GC, and other metrics. Including query time metrics, even if you don't collect logs from [all] queries.
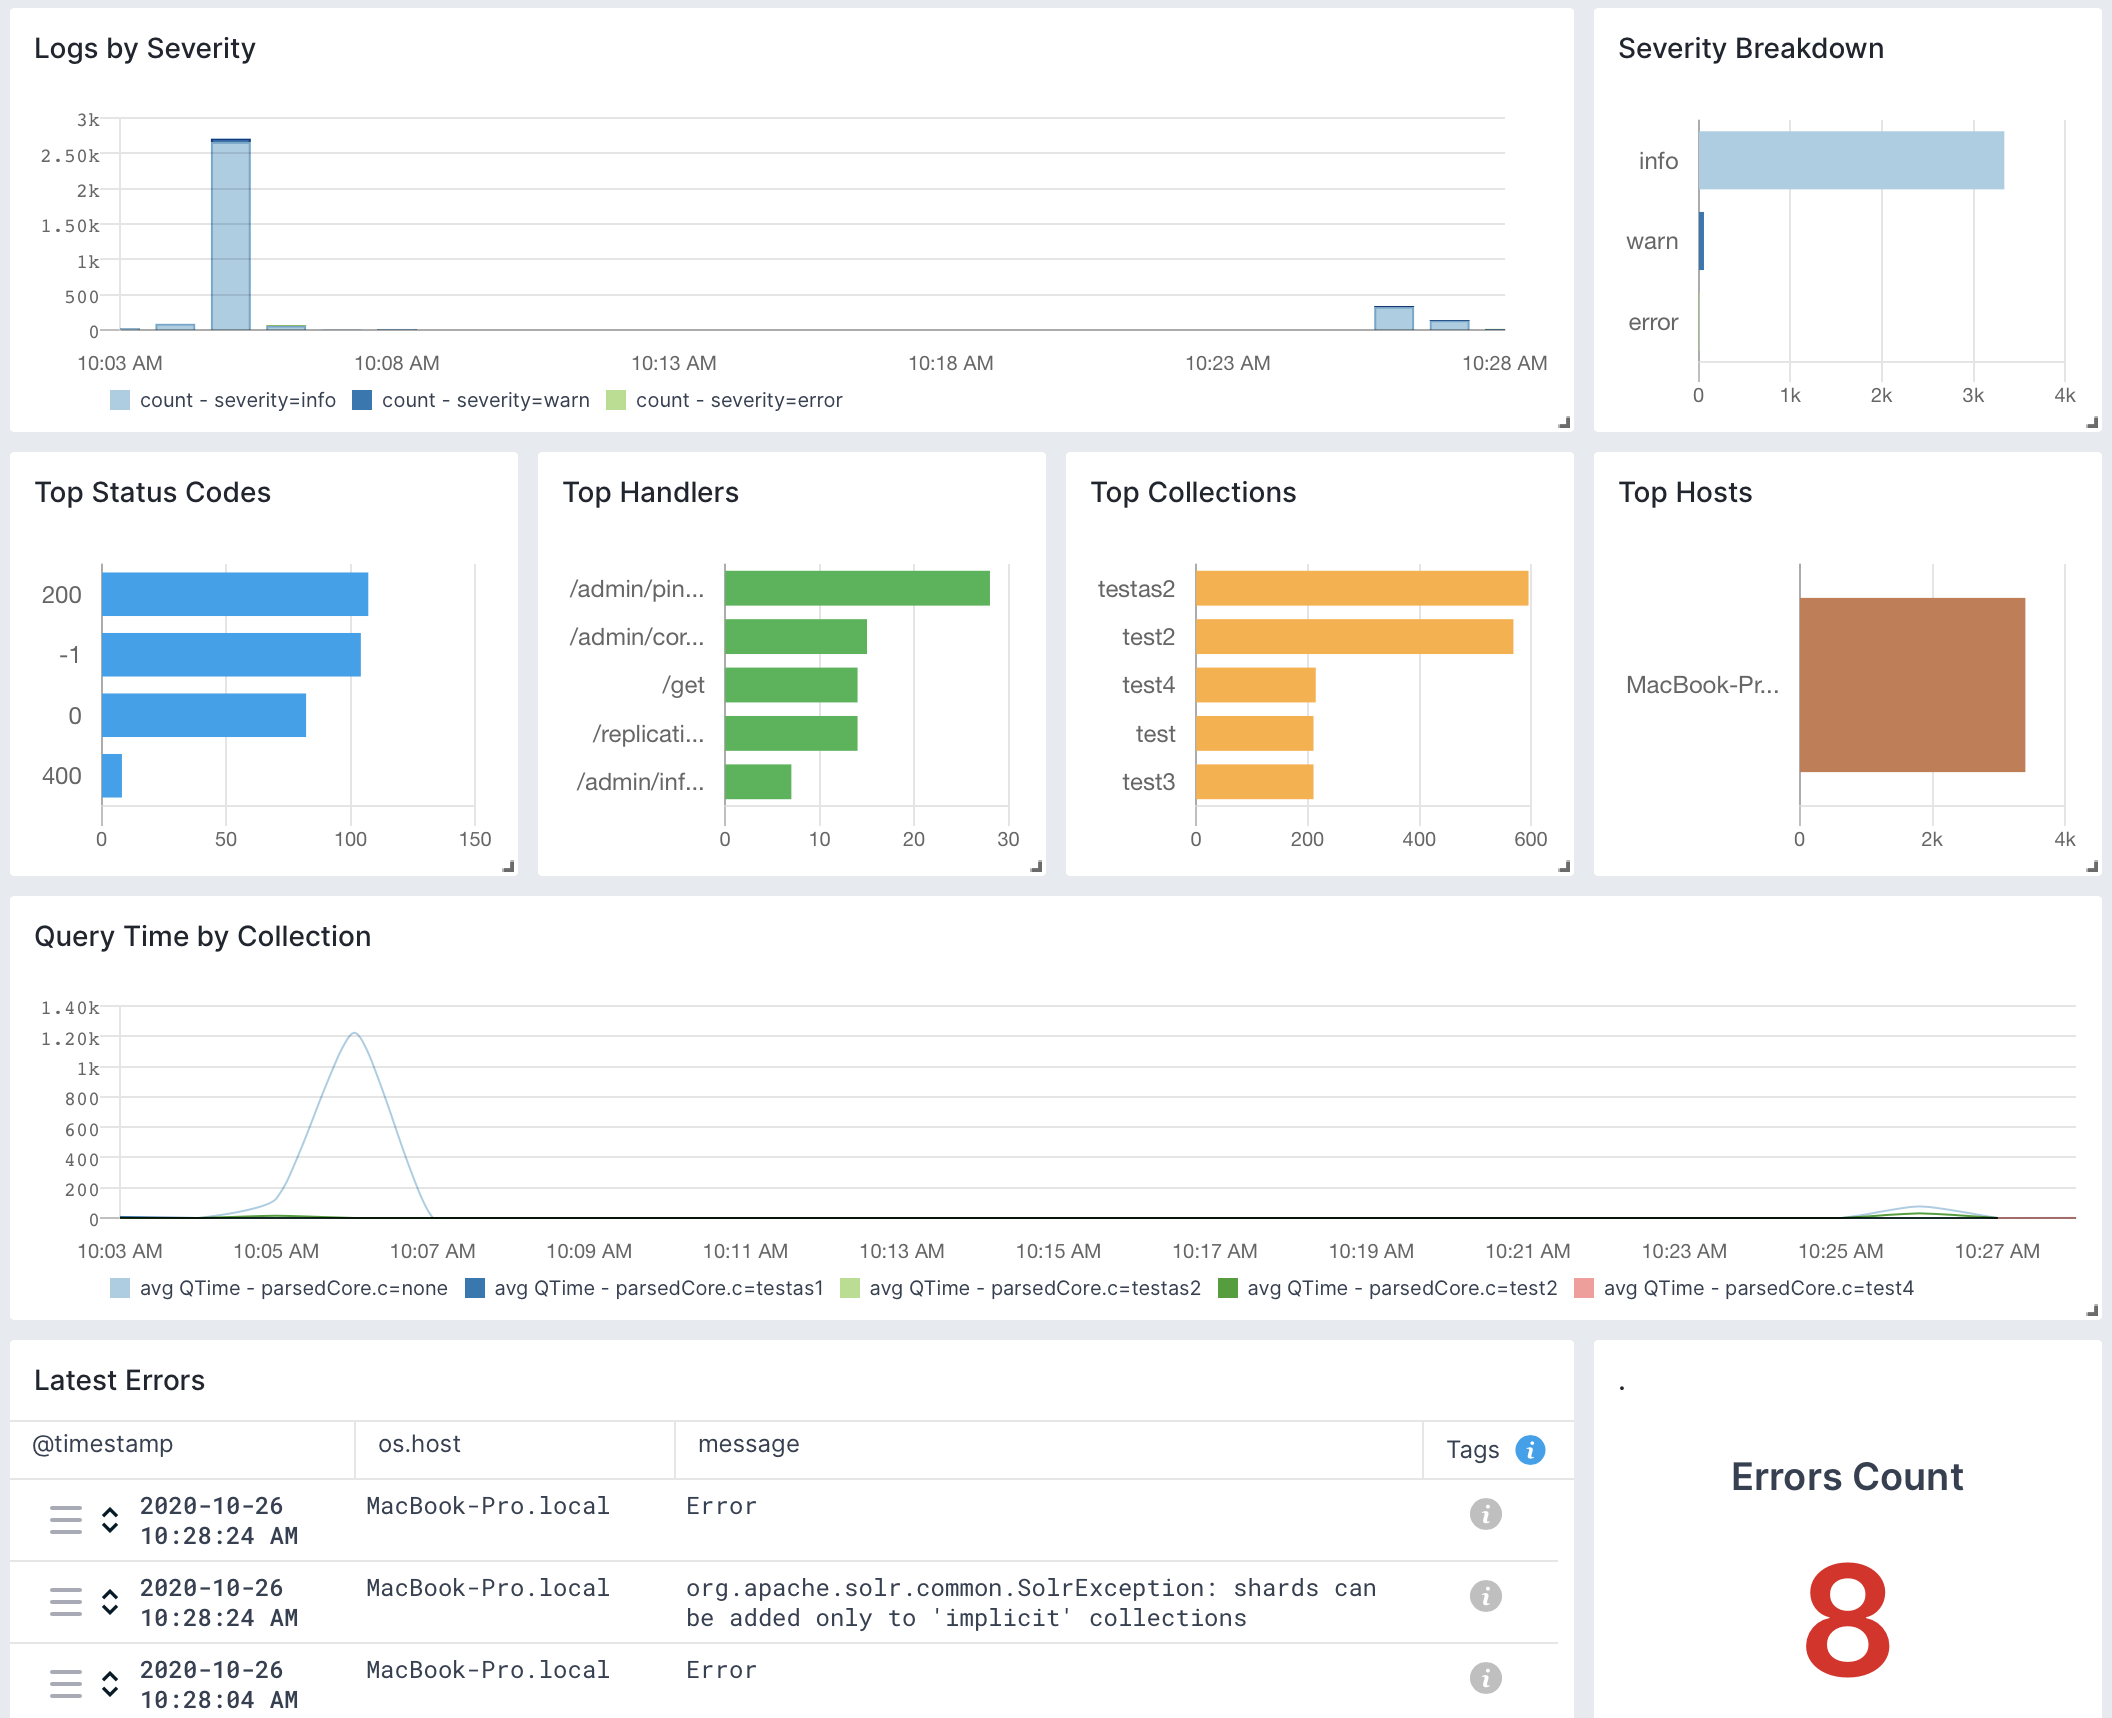
Exploring logs
Once data is in, you can explore it using the built-in reports or create your own. For example, you can use the Queries report to see a breakdown of your queries and "zoom in" to the ones you're interested in:
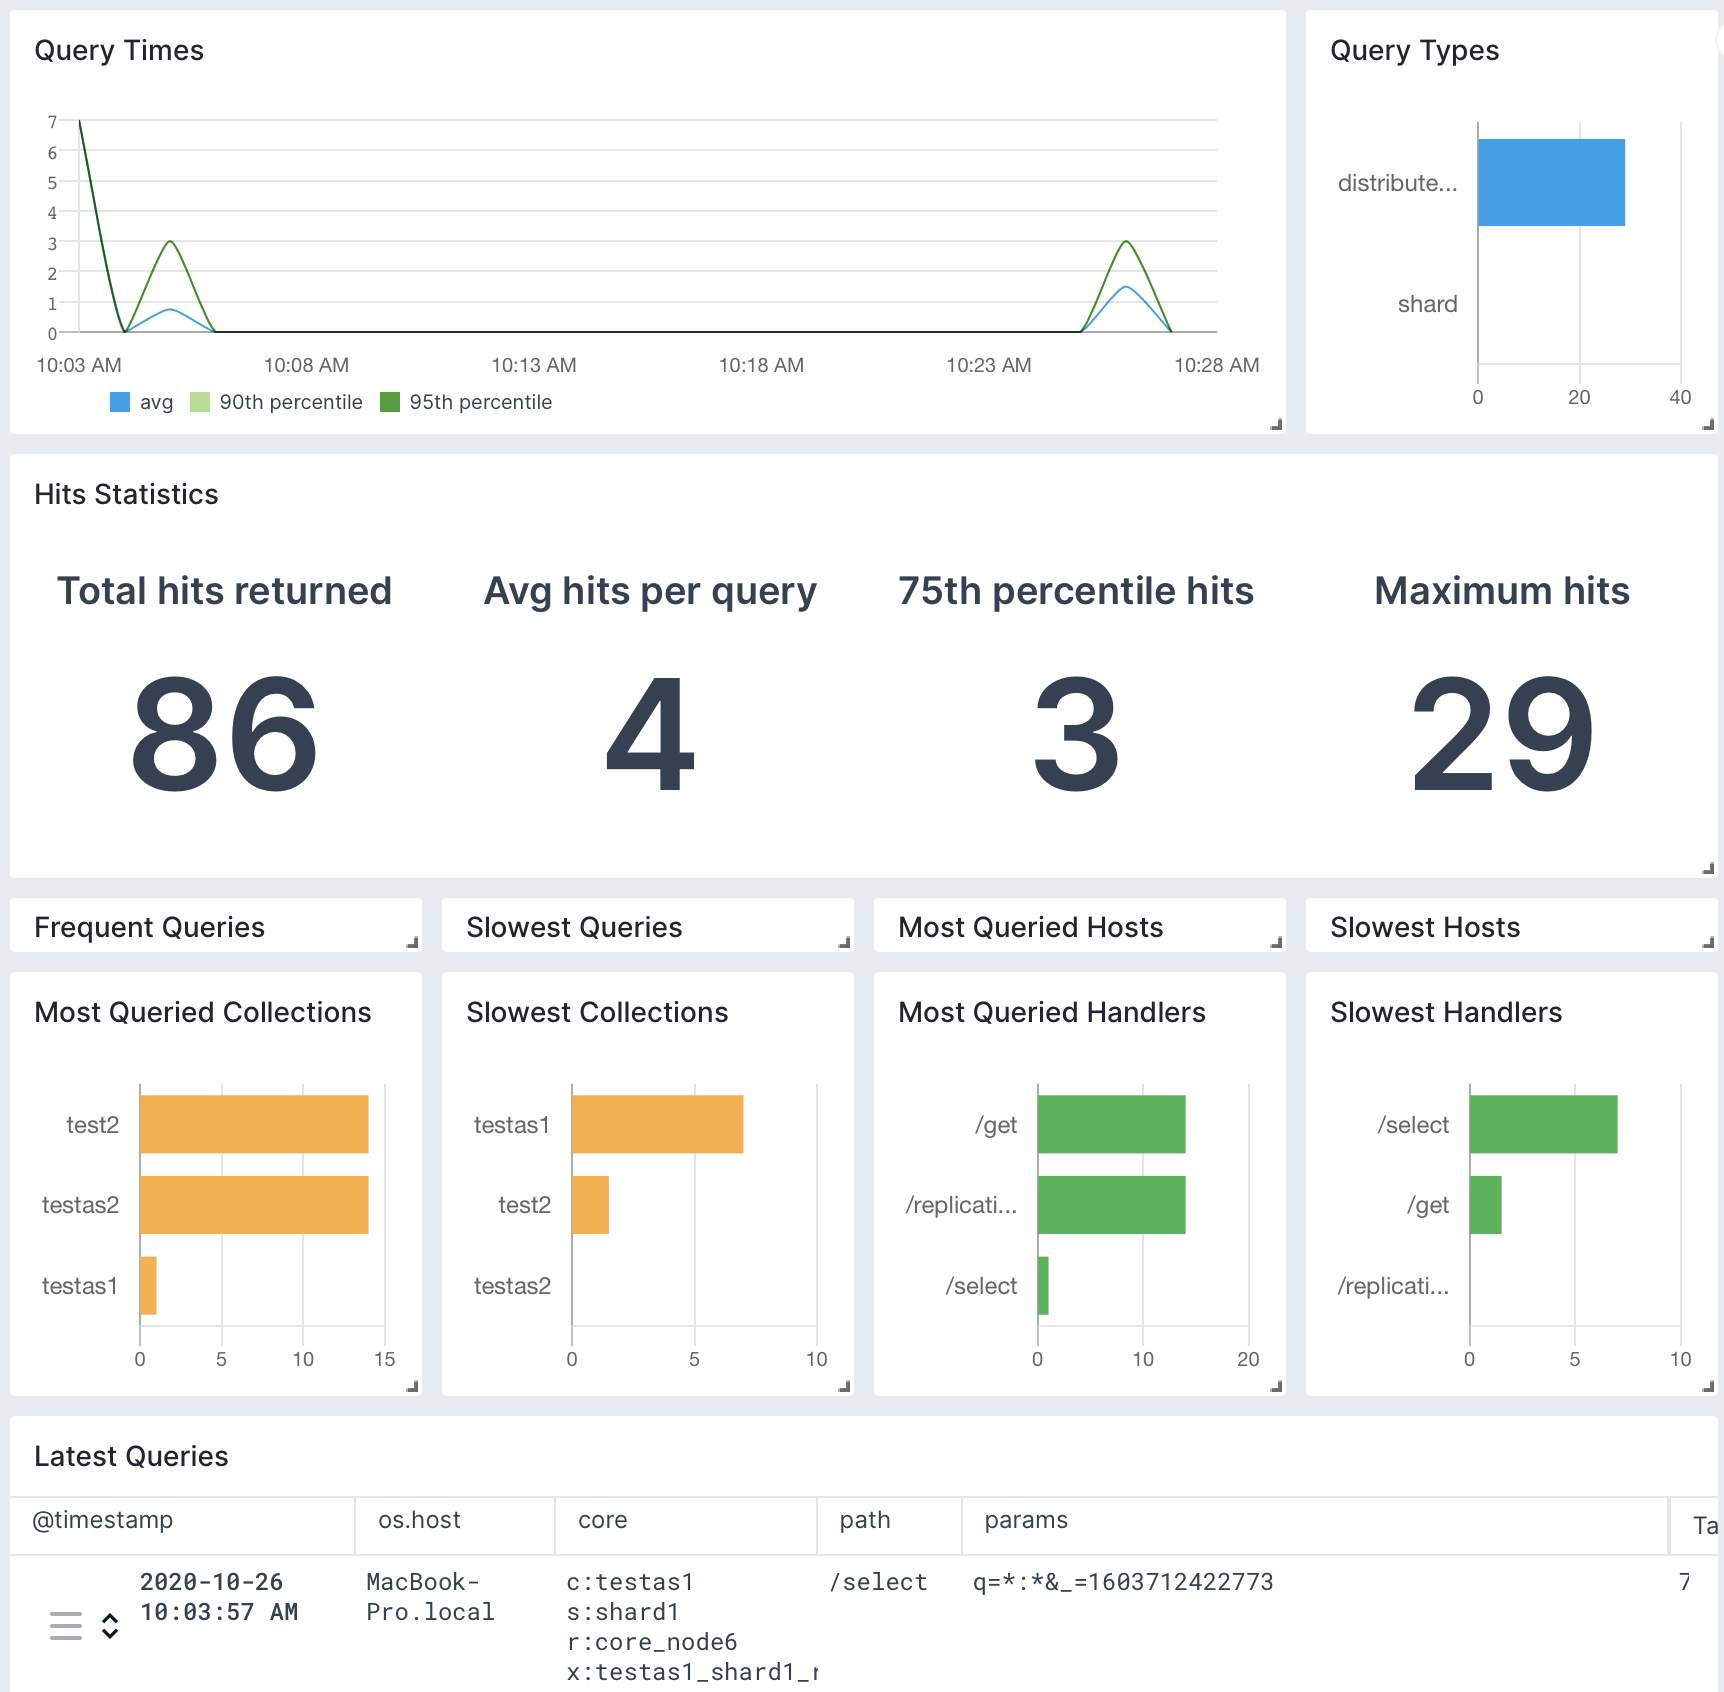
Other built-in reports include:
- Errors: breakdown of what's wrong: which nodes/classes/collections/etc generate errors
- Zookeeper: logs produced by Solr's Zookeeper client and other Zookeeper-related classes and threads. Look here for insights on SolrCloud's stability. For the Zookeeper ensemble itself, check out our Zookeeper monitoring integration
- Overseer: logs produced by SolrCloud's Overseer thread and other Overseer activities (e.g. shard leader election)
- Start & Stop: startup-related and shutdown-related logs. Look here if a node went down unexpectedly or doesn't show up in the cluster when started
Correlating Metrics & Logs
Be sure to check out the Solr Logs integration as well, to get a complete view on Solr: what kind of errors or warnings are happening, how fast is each request, when Solr was restarted and so on.
You can also correlate logs with metrics using Split Screen. For example, if you have a slow query in the logs, you can bring your Solr Monitoring App on the same screen and dig deeper in four steps:
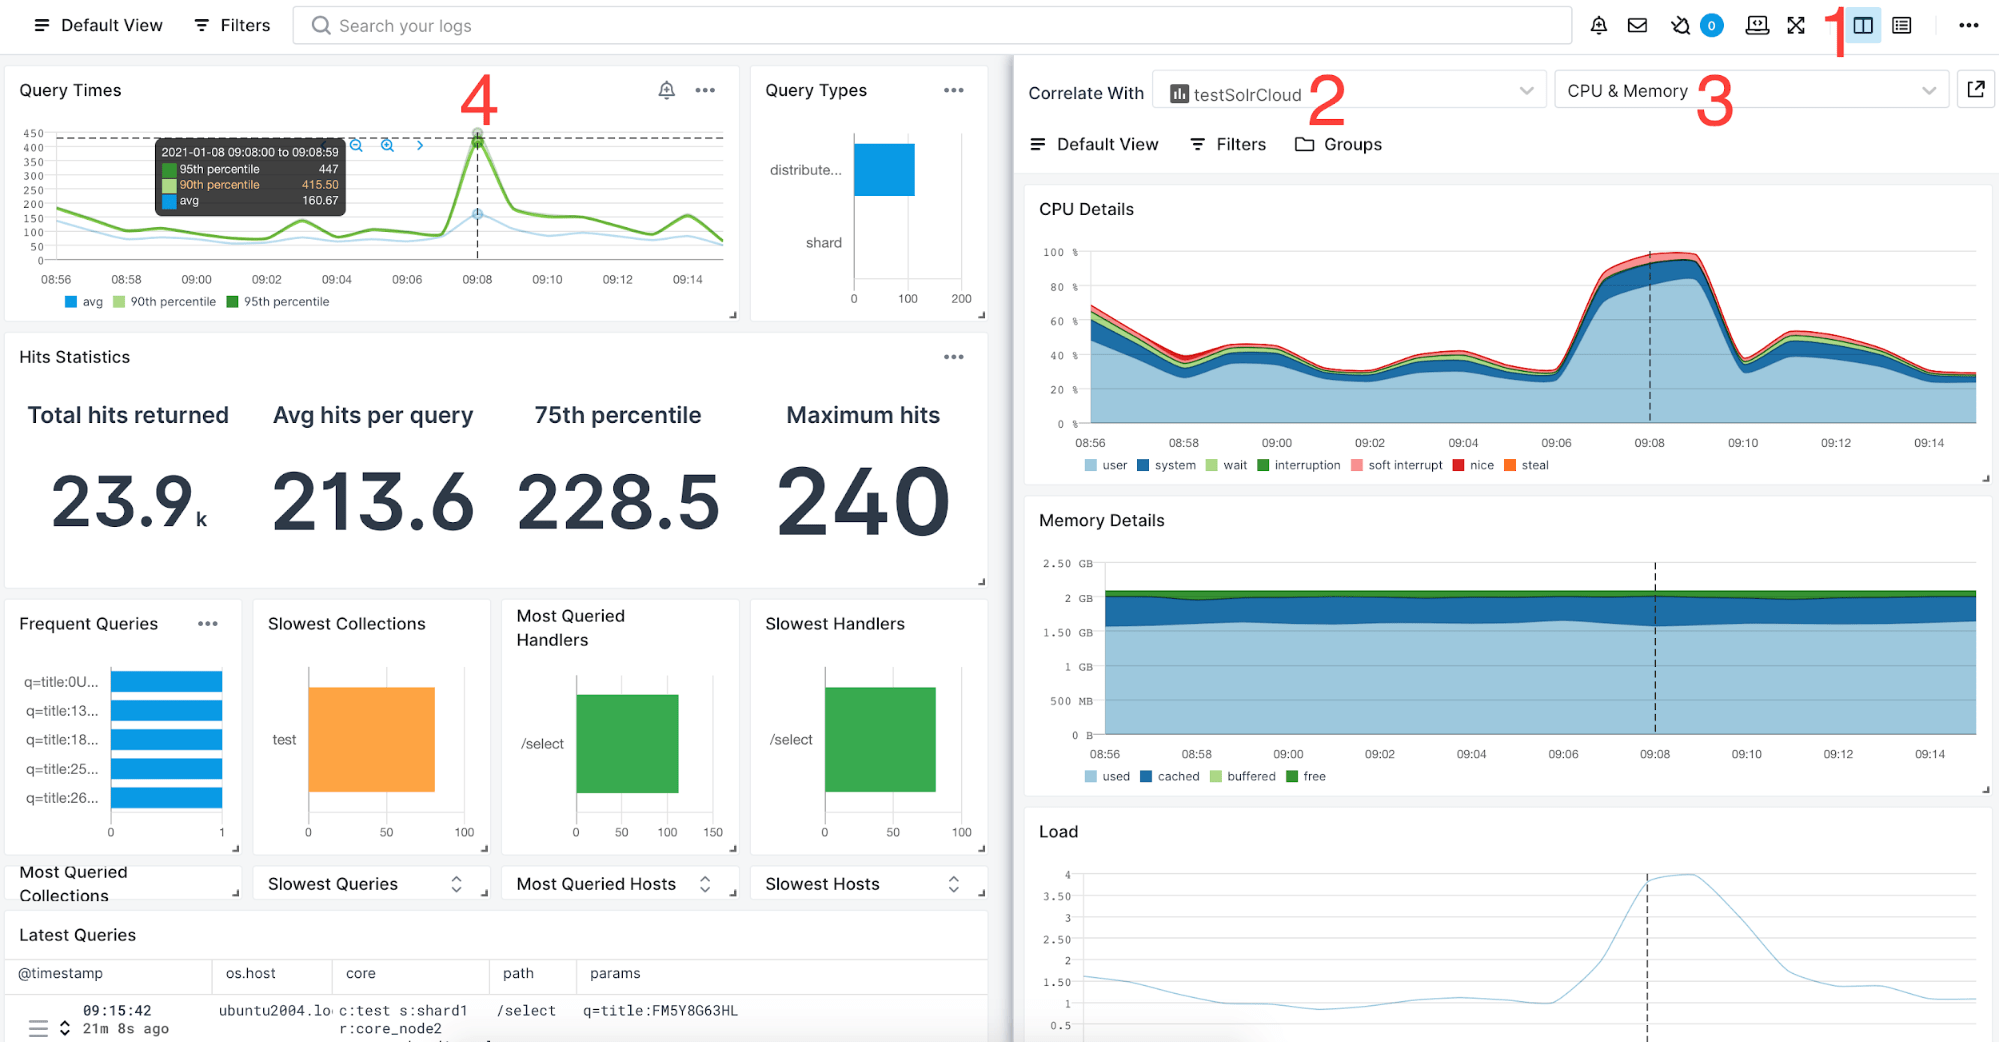
- Click the Split Screen button to bring a new App to your screen.
- Select your Solr Monitoring App.
- Select the report/dashboard you're interested in, such as the CPU and Memory report.
- Hover the mouse over the latency spike and you'll see the vertical bar showing the same time on all charts from both sides of your screen.
A full example of Solr metrics and logs correlation can be found in this article.
Integration
- Agent: https://github.com/sematext/sematext-agent-java
- Tutorial: https://sematext.com/blog/solr-monitoring-made-easy-with-sematext/
- Instructions: https://apps.sematext.com/ui/howto/Solr/overview
Troubleshooting
If you are having trouble sending logs, try out the latest version of the Sematext Agent. Additionally, make sure to check out the Log Agents panel for any errors, and refer to our Sematext Logs FAQ for useful tips.
If you are having issues with Sematext Monitoring, i.e. not seeing Solr metrics, see How do I create the diagnostics package.
For more troubleshooting information please look at Troubleshooting section.
FAQ
How do I enable JMX in Solr?
Add or uncomment the <jmx/> directive in solrconfig.xml and
restart Solr. Seehttps://wiki.apache.org/solr/SolrJmxfor more
info.
I don't see any data on Solr and JVM reports, what is the problem?
You should probably enable JMX in your Solr.Add or uncomment
the<jmx />directive insolrconfig.xmland restart Solr.
Seehttps://wiki.apache.org/solr/SolrJmxfor more info.
I don't see any data only in Solr Components or Errors reports, what should I do?
Most likely you are using the standalone variant of App Agent. In that case, App Agent can't collect metrics which are available only when running in-process. If so, switch to in-process (javaagent) version of App Agent.
Why don't I see Solr index file size metric?
App Agent runs as 'spmmon' user. Make sure this user has appropriate access permissions on Solr's index directories. If you cannot give 'spmmon' user the read permissions you can switch to the in-process (javaagent) version of the App Agent.