Element Timing
Experience uses the Element Timing API to annotate critical elements on your website/webapp. Knowing the rendering time of the key elements on a page is not enough to fully capture user satisfaction, but it is crucial to know how long it takes for them to be displayed on the screen.
Getting Started
To include timing data for your web page elements you must annotate them with the elementtiming property and give them a name.
The provided name will be associated with the element timing when viewed in Experience. You can have as many elementtiming attributes as you want, but keep in mind that this should be added to the crucial elements on your site, the ones which reflect the key elements your users should see, so that you can see how fast they actually get them rendered.
For example, if you would like to know how long it takes for the featured image on a web page to get displayed you could have your <img> tag annotated as follows:
It would result in the name taking the value of the elementtiming attribute:

Supported Page Elements
The Element Timing API is currently supported only by Google Chrome and works on the following page elements:
<img>elements<image>elements inside an<svg>tag- The poster images of the
<video>elements - Elements with
background-imageproperty - Text nodes
Element Timing Overview
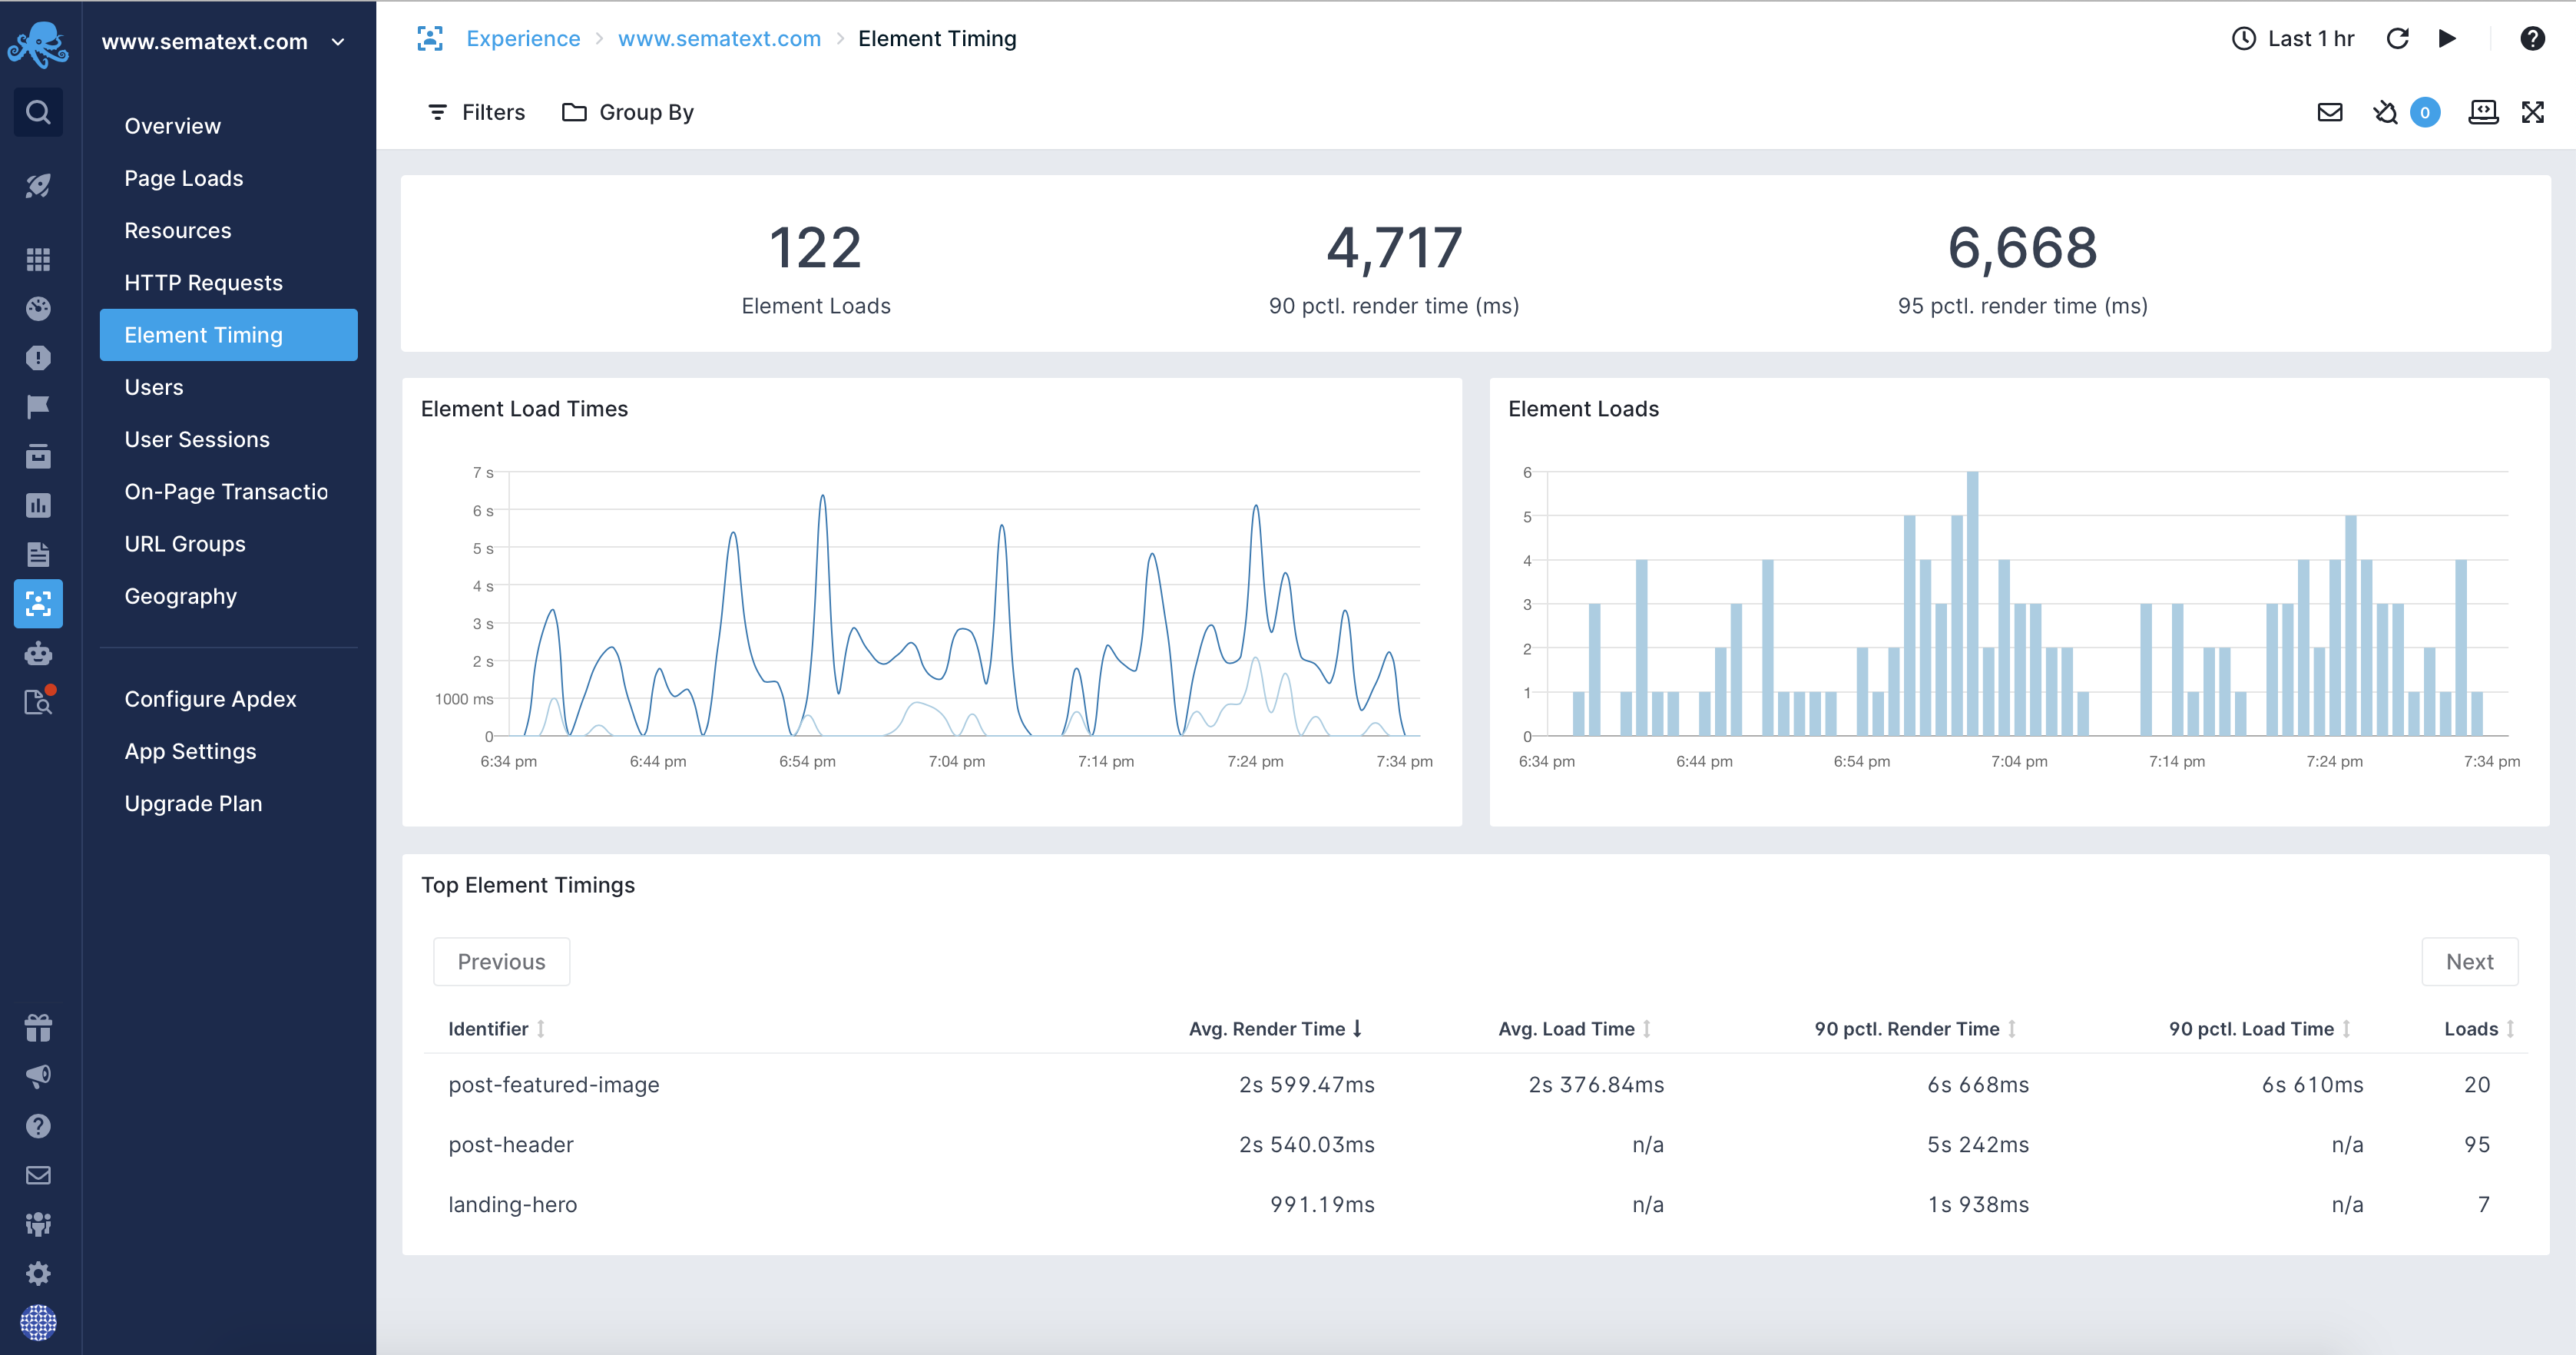
When accessing the Element Timing from the left menu of your Experience App you will see numerous metrics related to the annotated elements of your web application:
- Total number of annotated element loads.
- 90th percentile of annotated elements render time in milliseconds.
- 95th percentile of annotated elements load time in milliseconds.
- A histogram of load and render time of annotated elements.
- A histogram of the number of elements loads.
- A table with the top elements loads that include name of the elements, average render and load time, 90th percentile of render and load time and the number of loads for each element.

Element Timing Details
Accessing the details of an annotated web page element is as simple as choosing the element of interest from the Top Element Timings table in the Element Timing Overview.
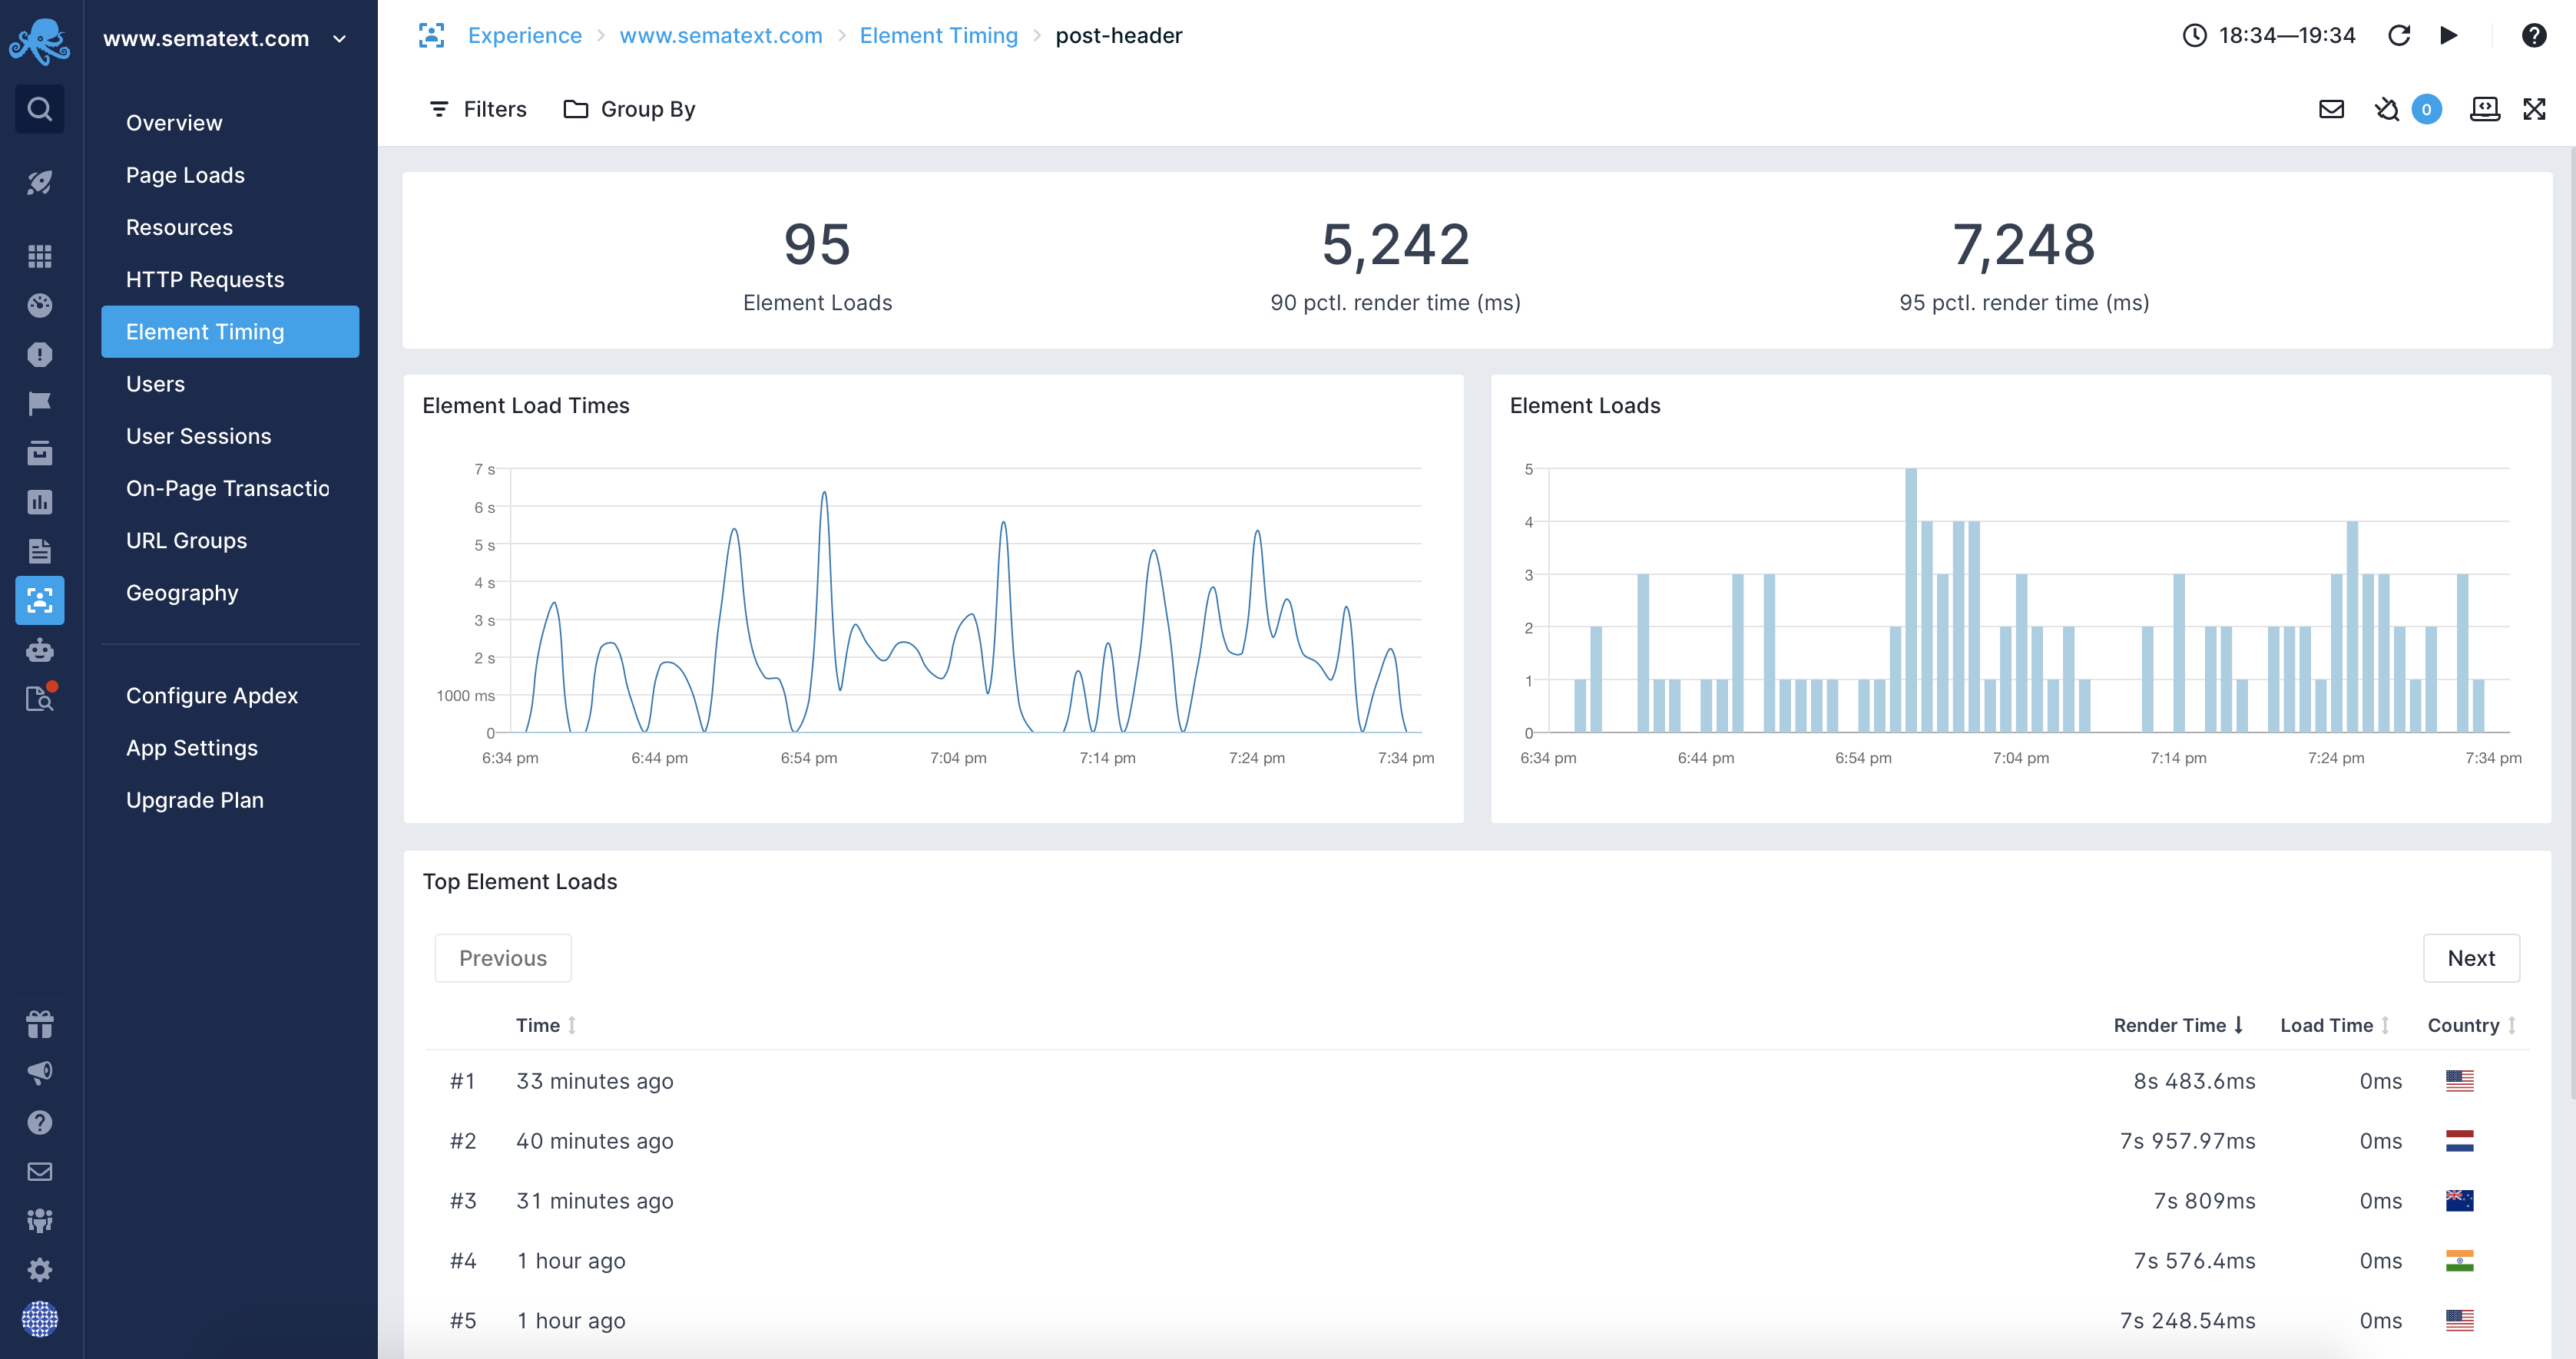
The Element Timing Overview includes timing information for each type of annotated web page element:
- Number of loads for a single annotated element.
- 90th percentile of annotated element render time in milliseconds.
- 95th percentile of annotated element render time in milliseconds.
- A histogram of load and render time of annotated element.
- A histogram of the number of element loads.
- A table with the top element loads that include the information when the element load occured, the render time, the load time and the country from which the load was requested. The load occurance information is clickable and takes you to the page load associated with the given element load.
