Tracing Overview
The Tracing Overview provides a summary of your distributed traces, showing service performance, error rates, and trace volume for the selected time period. This report helps you understand how your application is performing and identify issues that need attention.
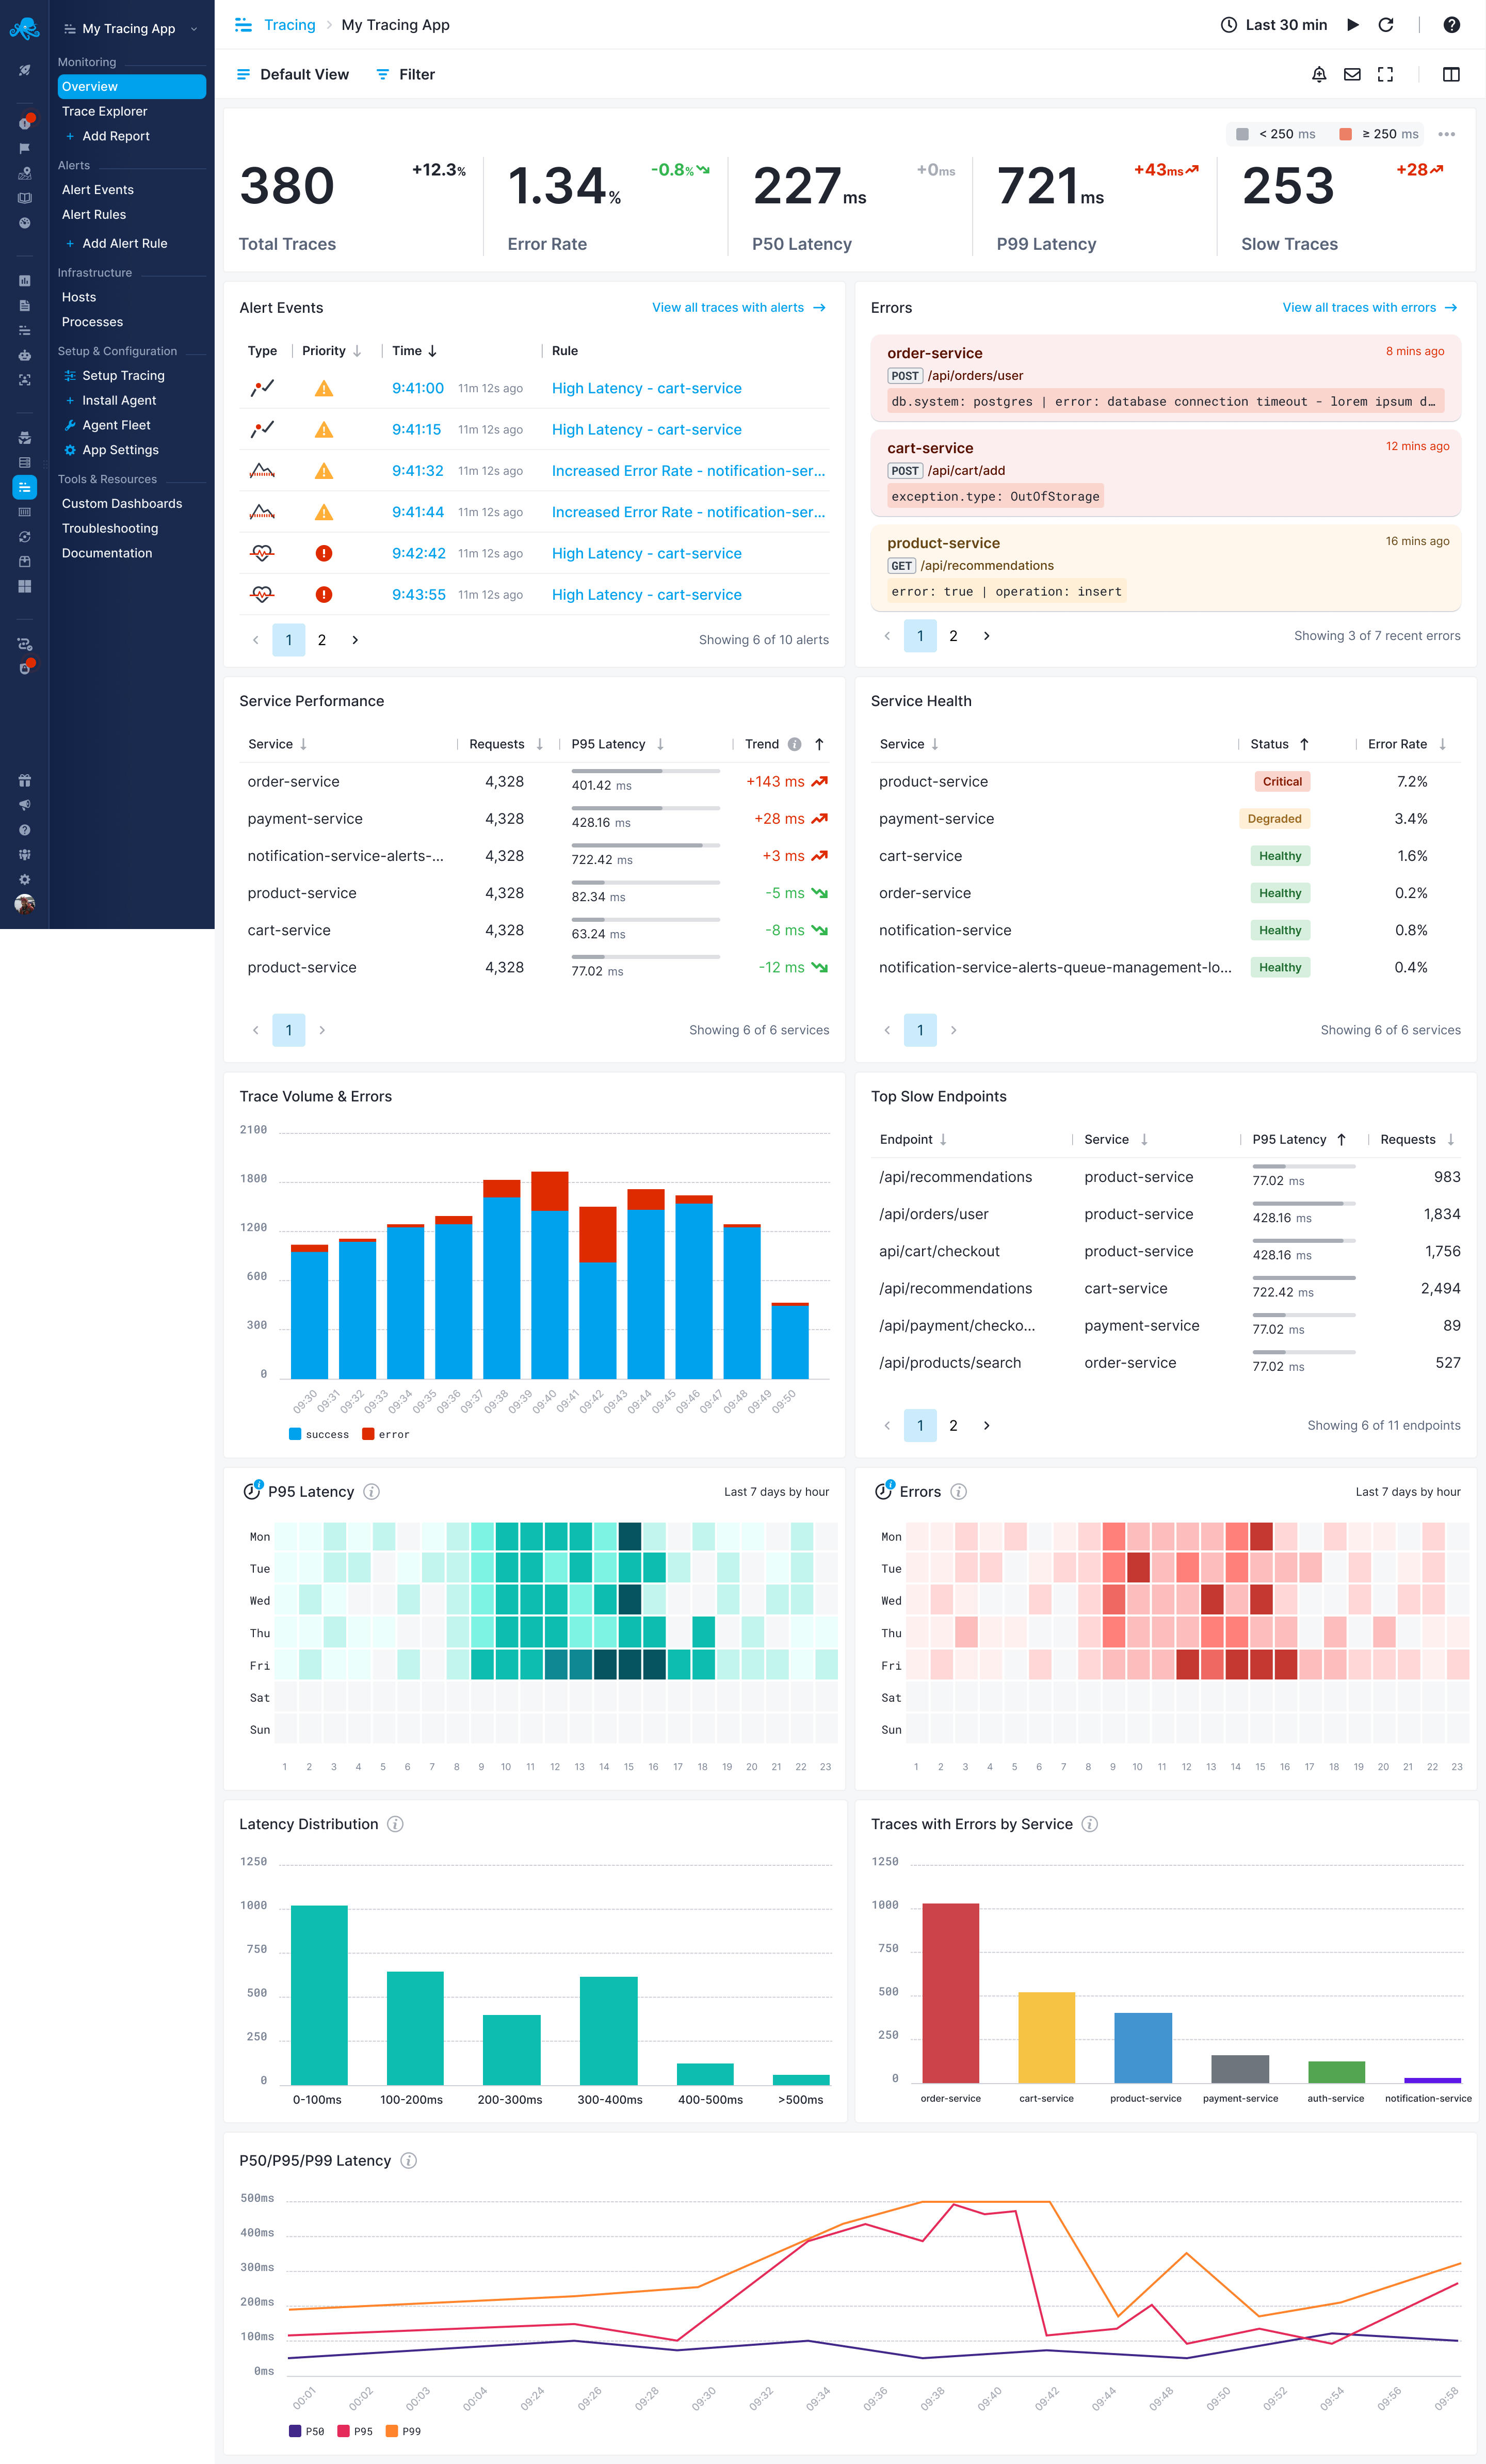
Key Metrics
Trace Volume
- Total Traces: Number of traces received in the selected time period
- Traces per Minute: Average trace ingestion rate
- Visual Timeline: Histogram showing trace distribution over time
Error Analysis
- Error Rate: Percentage of traces containing errors
- Total Errors: Count of traces with errors
- Error Types: Breakdown of different error categories
Performance Metrics
- Average Latency: Mean response time across all traces
- P50 Latency: 50th percentile response time (median)
- P95 Latency: 95th percentile response time
- P99 Latency: 99th percentile response time
Service Health
- Active Services: Number of services sending traces
- Service Status: Health indicator for each service
- Throughput per Service: Request volume for each service
Service List
The report shows each service with:
- Service Name: As configured in your OpenTelemetry SDK
- Request Count: Total number of traces for this service
- Error Rate: Percentage of traces with errors
- Average Latency: Mean response time
- P95 Latency: 95th percentile response time
- Status Indicator: Green (healthy), yellow (warning), red (error)
Clicking on a service name takes you to the Traces Explorer with results filtered for that service.
Timeline Visualizations
Trace Volume Over Time
Shows trace volume distribution across the selected time range with peak detection for unusual traffic spikes.
Latency Trends
Line graph showing P50, P95, and P99 latency trends over time with visual indicators for performance zones.
Error Rate Trends
Shows error rate changes over time, highlighting periods of elevated error rates.
Understanding the Data
Latency Percentiles
- P50 (Median): Half of your requests are faster than this value
- P95: 95% of requests are faster than this value (good for SLA monitoring)
- P99: 99% of requests are faster than this value (captures worst-case performance)
Error Classification
- HTTP Errors: 4xx and 5xx status codes
- Exception Errors: Unhandled exceptions in application code
- Timeout Errors: Requests that exceeded configured timeouts
- Dependency Errors: Errors from external services or databases
Service Health Indicators
- Green: Service operating normally, low error rate, acceptable latency
- Yellow: Service showing warning signs (elevated latency or moderate error rate)
- Red: Service experiencing issues (high error rate or severe latency problems)
Common Use Cases
Performance Monitoring
Track application response times across all services and identify performance degradation before it affects users.
Error Tracking
Monitor error rates across all services and identify which services are most error-prone.
Capacity Planning
Analyze traffic patterns to predict capacity needs and monitor service load distribution.
Deployment Impact Analysis
Compare performance before and after deployments and monitor error rates during releases.
Next Steps
- Search and analyze traces
- Visualize service dependencies
- Set up performance alerts
- View detailed trace analysis