Sematext Experience Integrations
The Sematext Experience integrations cover all types of websites and all major SPA frameworks.
Supported Frameworks & Platforms

Angular
Full support for single-page applications built with the Angular framework.

React
Full support for single-page applications built with the React library.

Vue.js
Full support for single-page applications built with Vue.js.

Ember
Full support for single-page applications built with the Ember framework.

Static Websites
Full support for all types of static websites.

Server-side Rendering
Full support for all types of SSR websites and applications.

Vercel
RUM metrics for all websites hosted on Vercel.

Next.js
Support for websites built using the Next.js React framework.

Google Tag Manager
Integrate Experience using Google Tag Manager.

WordPress
Add Experience to a WordPress site.

Micro Frontend
Add Experience to micro frontend based web applications.
All of the integrations require adding and configuring the Experience script. However, single-page applications require one more configuration step to register route changes.
Angular
The Angular SPA integration supports both Angular.js and Angular 2+.
Angular 2+
If your webapp uses the newer Angular you should add a call to routeChange whenever the route changes in your webapp. This can be done in your top-level component where Router is defined by adding the ngOnInit function and subscribing to the Router events as shown in the following example.
If you use TypeScript, you need to declare the global function:
Add this to your code.
import { Component, OnInit } from '@angular/core';
import { Router, NavigationStart } from '@angular/router';

@Component({ selector: 'app', templateUrl: 'app.component.html' })

export class AppComponent implements OnInit {
  constructor(private router: Router) {}

  ngOnInit() {
    this.router.events.subscribe(event => {
      if (event instanceof NavigationStart) {
        window['strum']('routeChange', event.url);
      }
    });
  }
}
Angular.js
If your webapp uses Angular.js 1.x you should add a call to routeChange whenever the route changes in your webapp. To do this you'll need to adjust your client side view inside Angular.js:
$scope.$on('$routeChangeStart', function () {
  window['strum']('routeChange', window.location.href);
});
React
The React integration ties into React Router and tracks calls to routeChange. You should add a call to routeChange whenever the route changes in your webapp. This can be done in your top-level component where Router is defined.
If you use TypeScript, you need to declare the global function:
Add this to your code.
import React from 'react';
import { createBrowserHistory as createHistory } from 'history';

const history = createHistory();

history.listen((location, action) => {
  if (action !== 'REPLACE') {
    window['strum']('routeChange', window.location.href);
  }
})

export default function App() {
  return (
    <Router history={history}>
      ...
    </Router>
  );
}
Vue.js
The Vue.js integration works by watching for calls to the routeChange function where you have the router-view defined.
If you use TypeScript, you need to declare the global function:
Add this to your code.
<template>
  <div id="app">
    <router-view/>
  </div>
</template>
<script>
  export default {
    name: 'app',
    watch: {
      $route() {
        strum('routeChange', document.location.href);
      }
    }
  }
</script>
Ember
The Ember integrations uses the reopen function to configure a function to trigger every time your application changes routes. This event is called didTransition.
If you use TypeScript, you need to declare the global function:
Add this to your code.
import EmberRouter from '@ember/routing/router';
import { on } from '@ember/object/evented';

EmberRouter.reopen({
  doInformAboutRouteChange: on('didTransition', function() {
    // eslint-disable-next-line
    window['strum']('routeChange', window.location.href);
  }),
});

export default Router;
Static websites
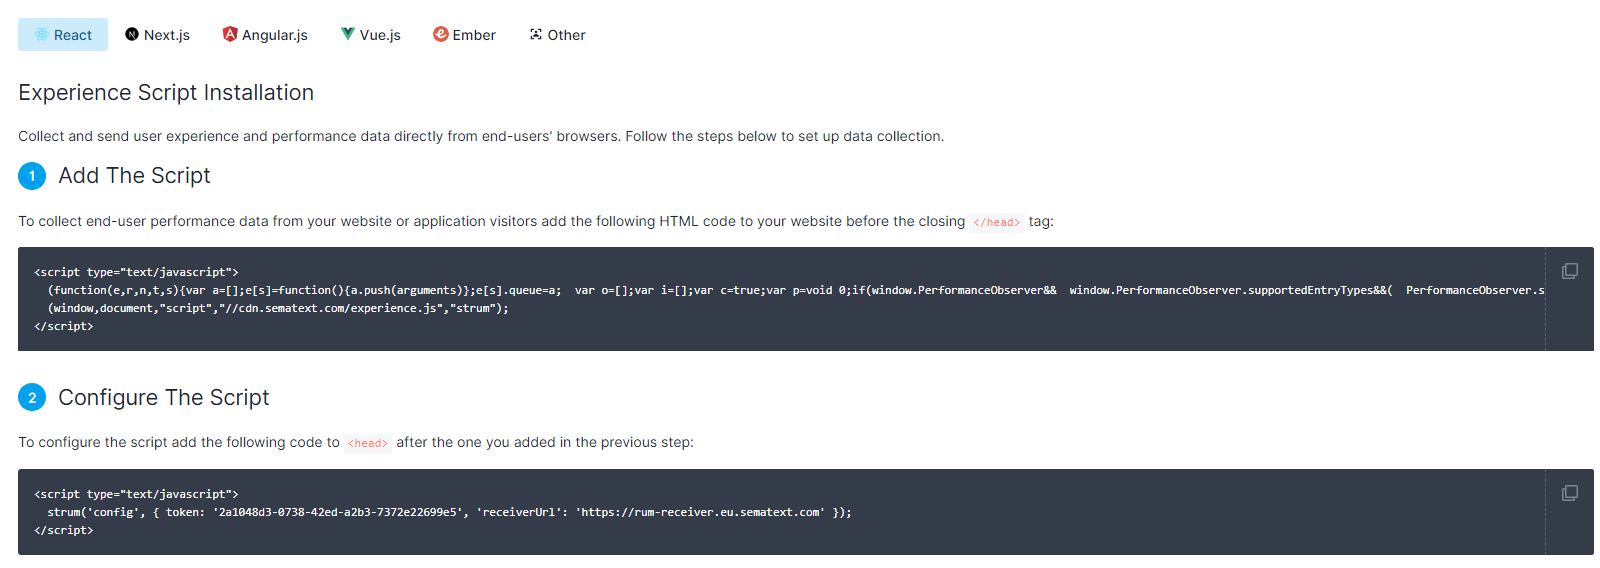
Static websites don't require any additional configuration, just add the Experience script to the <head> of your site and you're ready to go!
Server-side rendered websites
Server-side rendered websites don't require any additional configuration either. Add the Experience script to the <head> of your site and you're ready to go!
Vercel
Head over to the Vercel marketplace and add the Sematext Experience integration to get started. Next, add the Experience Script to your front-end app or website and you're good to go!
Next.js
Adding Experience to Next.js web sites is slightly different since there is no index.html file that you can easily edit to include the script in the <head> tags.
Instead, you should use the <Head> Next.js component on all pages where Experience should be added. When you create an Experience App select Next.js on the instructions screen to get the exact code snippet that you should add to the <Head> component.
Google Tag Manager
Integrating Experience using Google Tag Manager is as simple as copy and pasting the code.
Create a New Tag in GTM and give this a name such as Sematext RUM Script. Under Tag Configuration choose Custom HTML and paste in the script from the first step of the Experience installation instructions. Under Triggering select All Pages.
Create a second New Tag in GTM, giving this a name such as Sematext RUM Config. Under Tag Configuration choose Custom HTML and paste in the script from the second step of the Experience installation instructions. Under Triggering select All Pages.
You should now be ready to go.
WordPress
Adding Experience to a WordPress site is done by using an external 3rd-party plugin. Please make sure the Insert Headers and Footers plugin is installed and activated before continuing with the next steps.
In the WordPress Admin panel, go to Settings >> Insert Headers and Footers. In the Scripts in Header box, paste both the scripts found in the first and second steps of the Experience installation instructions.
Save the changes and you should be good to go.
If you are running WordPress be sure to check out the video below - it's chock-full of WordPress-specific performance tips.
Micro Frontend
You can monitor your micro frontend based web applications from a single Experience App. After you create an Experience App, the script installation page will be displayed.

Follow the instructions from the first two steps and add the scripts to each of your individual applications' index.html file just before the <head> section ends.
The next step involves adding history tracking to your main component where the routing of your application happens.
Open the file where you have the route object and add import { createBrowserHistory as createHistory } from 'history'; as the last line of the import section.
Then create the history object and listener just before the MainLayout function.
const history = createHistory();
history.listen((location, action) => {
 if (action !== 'REPLACE') {
   window['strum']('routeChange', window.location.href);
 }
})
MainLayout function.
An example of a MainLayout.jsx file can be seen below.
import React from "react";
import { BrowserRouter as Router, Route, Switch } from "react-router-dom";
import "remixicon/fonts/remixicon.css";
import "./index.scss";
import Header from "home/Header";
import Footer from "home/Footer";
import PDPContent from "pdp/PDPContent";
import HomeContent from "home/HomeContent";
import CartContent from "cart/CartContent";
import { createBrowserHistory as createHistory } from 'history';
const history = createHistory();
history.listen((location, action) => {
if (action !== 'REPLACE') {
window['strum']('routeChange', window.location.href);
}
})
export default function MainLayout() {
 return (
   <Router history={history}>
<div className="text-3xl mx-auto max-w-6xl">
<Header />
<div className="my-10">
<Switch>
<Route exact path="/" component={HomeContent} />
<Route path="/product/:id" component={PDPContent} />
<Route path="/cart" component={CartContent} />
</Switch>
</div>
<Footer />
</div>
</Router>
);
}