Traces Explorer
The Traces Explorer lets you browse through your distributed traces to find specific requests, investigate issues, and analyze application behavior. You can filter traces by various criteria and drill down into individual trace details.
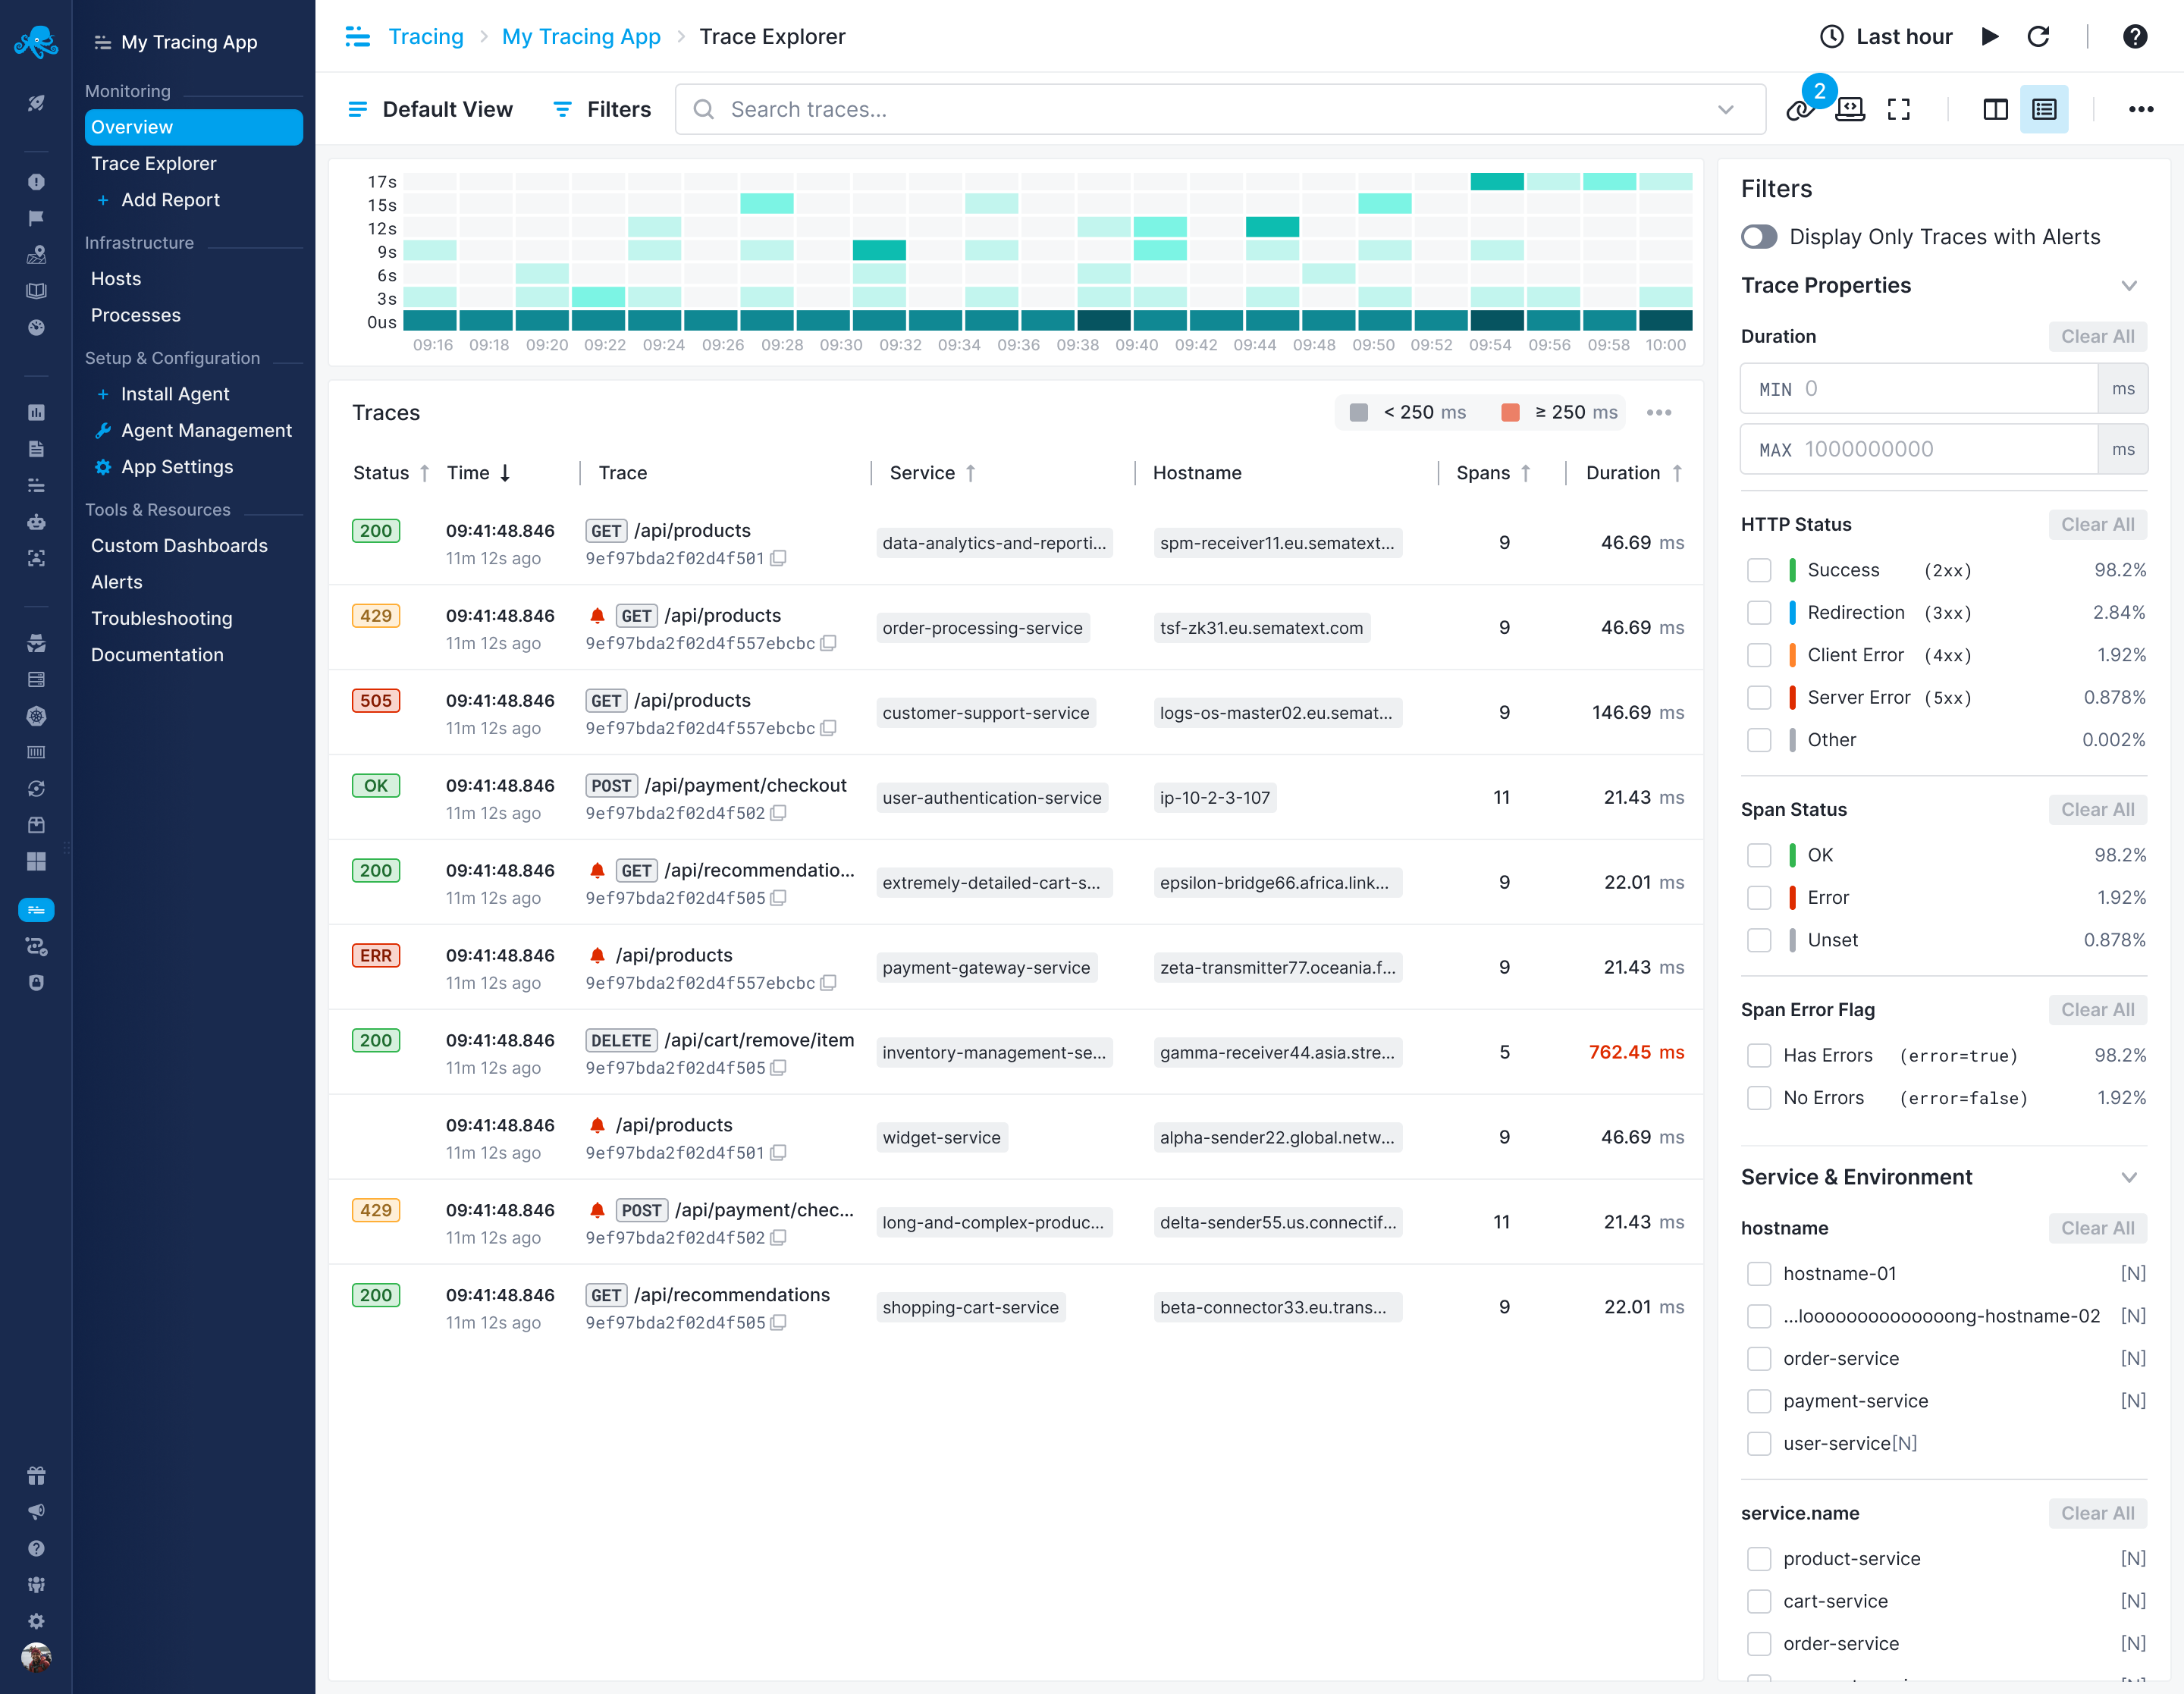
Filters Panel
The filters panel on the right provides several categories to narrow down your trace search:
Trace Properties
Expandable section for filtering by trace-level attributes.
Duration
Set minimum and maximum duration in milliseconds:
- MIN: Show only traces longer than this threshold
- MAX: Show only traces shorter than this threshold
Response Status
Filter by HTTP response status categories:
- Success (2xx): Successful responses
- Redirect (3xx): Redirect responses
- Client Error (4xx): Client-side errors
- Server Error (5xx): Server-side errors
- Other: Non-standard response codes
Each option shows the percentage of traces in that category.
Span Status
Filter by span completion status:
- Ok: Successfully completed spans
- Error: Spans that encountered errors
- Unset: Spans without explicit status
Each option shows the percentage of traces with that status.
Span Error Flag
Filter based on error flags:
- Has Errors: Traces containing spans with errors
- No Errors: Traces with no error spans
Shows the percentage for each category.
Service & Environment
Expandable section to filter by:
- Specific services in your application
- Environment attributes
Database & Messaging
Expandable section to filter by:
- Database operations
- Messaging system interactions
Other Attribute
Expandable section for filtering by custom attributes you've added to your spans.
Trace List
The main area displays traces matching your filter criteria:
Trace Table
Each row shows:
- Status: Visual indicator (Unset shown as gray box)
- Time: Timestamp when the trace occurred
- Trace: Operation name (e.g., "orders receive", "order-consumed")
- Service: Which service handled the request (e.g., "fraud-detection", "accounting")
- Hostname: The host that processed the request
- Spans: Number of spans in the trace
- Duration: How long the trace took (e.g., "27.24 ms", "11379.64 ms")
Visual Elements
- Timeline Chart: At the top, shows trace distribution over time as a histogram
- Duration Indicator: Orange dot showing average duration (e.g., "≈ 2200 ms")
- Status Badges: "Unset" status shown as gray badges in the Status column
Viewing Trace Details
Click on any trace row to open the detailed trace view, which shows:
- Full waterfall visualization of all spans
- Timing information for each operation
- Service interactions
- Error details if present
Using Filters
Applying Filters
- Select filter options in the right panel
- Click "Apply" to update the trace list
- Multiple filters can be combined
Clearing Filters
- Use "Clear" button to reset individual filter sections
- Applied filters show checkboxes next to active options
Filter Values
When expanding filter sections like "Service & Environment", you can:
- Search for specific values using the filter input
- Select multiple values with checkboxes
- See the count or percentage for each option
Common Use Cases
Finding Slow Requests
- Set a MIN duration value (e.g., 1000 ms) to show only slow traces
- Review which operations appear most frequently
- Click on traces to see the detailed timing breakdown
Investigating Errors
- In Response Status, select "Server Error (5xx)" or "Client Error (4xx)"
- Or in Span Status, select "Error"
- Or in Span Error Flag, select "Has Errors"
- Review which services and operations are failing
Service-Specific Analysis
- Expand "Service & Environment"
- Select specific services (e.g., "accounting", "fraud-detection")
- Review traces for those services
- Check duration patterns and error rates
Database Performance
- Expand "Database & Messaging"
- Filter for database-related operations
- Check duration to identify slow queries
- Look for patterns in database access
Timeline Navigation
The histogram at the top shows:
- Trace volume distribution over time
- Darker bars indicate higher trace volume
- Time labels showing the selected time range
- Click and drag to zoom into specific periods
Tips for Effective Use
Performance Analysis
- Use MIN duration to find your slowest requests
- Compare similar operations across different time periods
- Look for patterns in trace volume on the timeline
Error Investigation
- Combine multiple error filters for precise analysis
- Check both Response Status and Span Status for complete error picture
- Look at error percentages to understand error rates
Efficient Filtering
- Start with broad filters and progressively narrow down
- Use percentages shown next to each filter to understand data distribution
- Clear filters between different investigations to avoid confusion
Next Steps
- View detailed trace analysis
- Visualize service dependencies
- Set up alerts for trace conditions
- Return to Tracing Overview