Trace Details
When you click on a trace in the Traces Explorer, you enter the detailed trace view that shows the complete execution flow of that request through your system.
Trace Overview
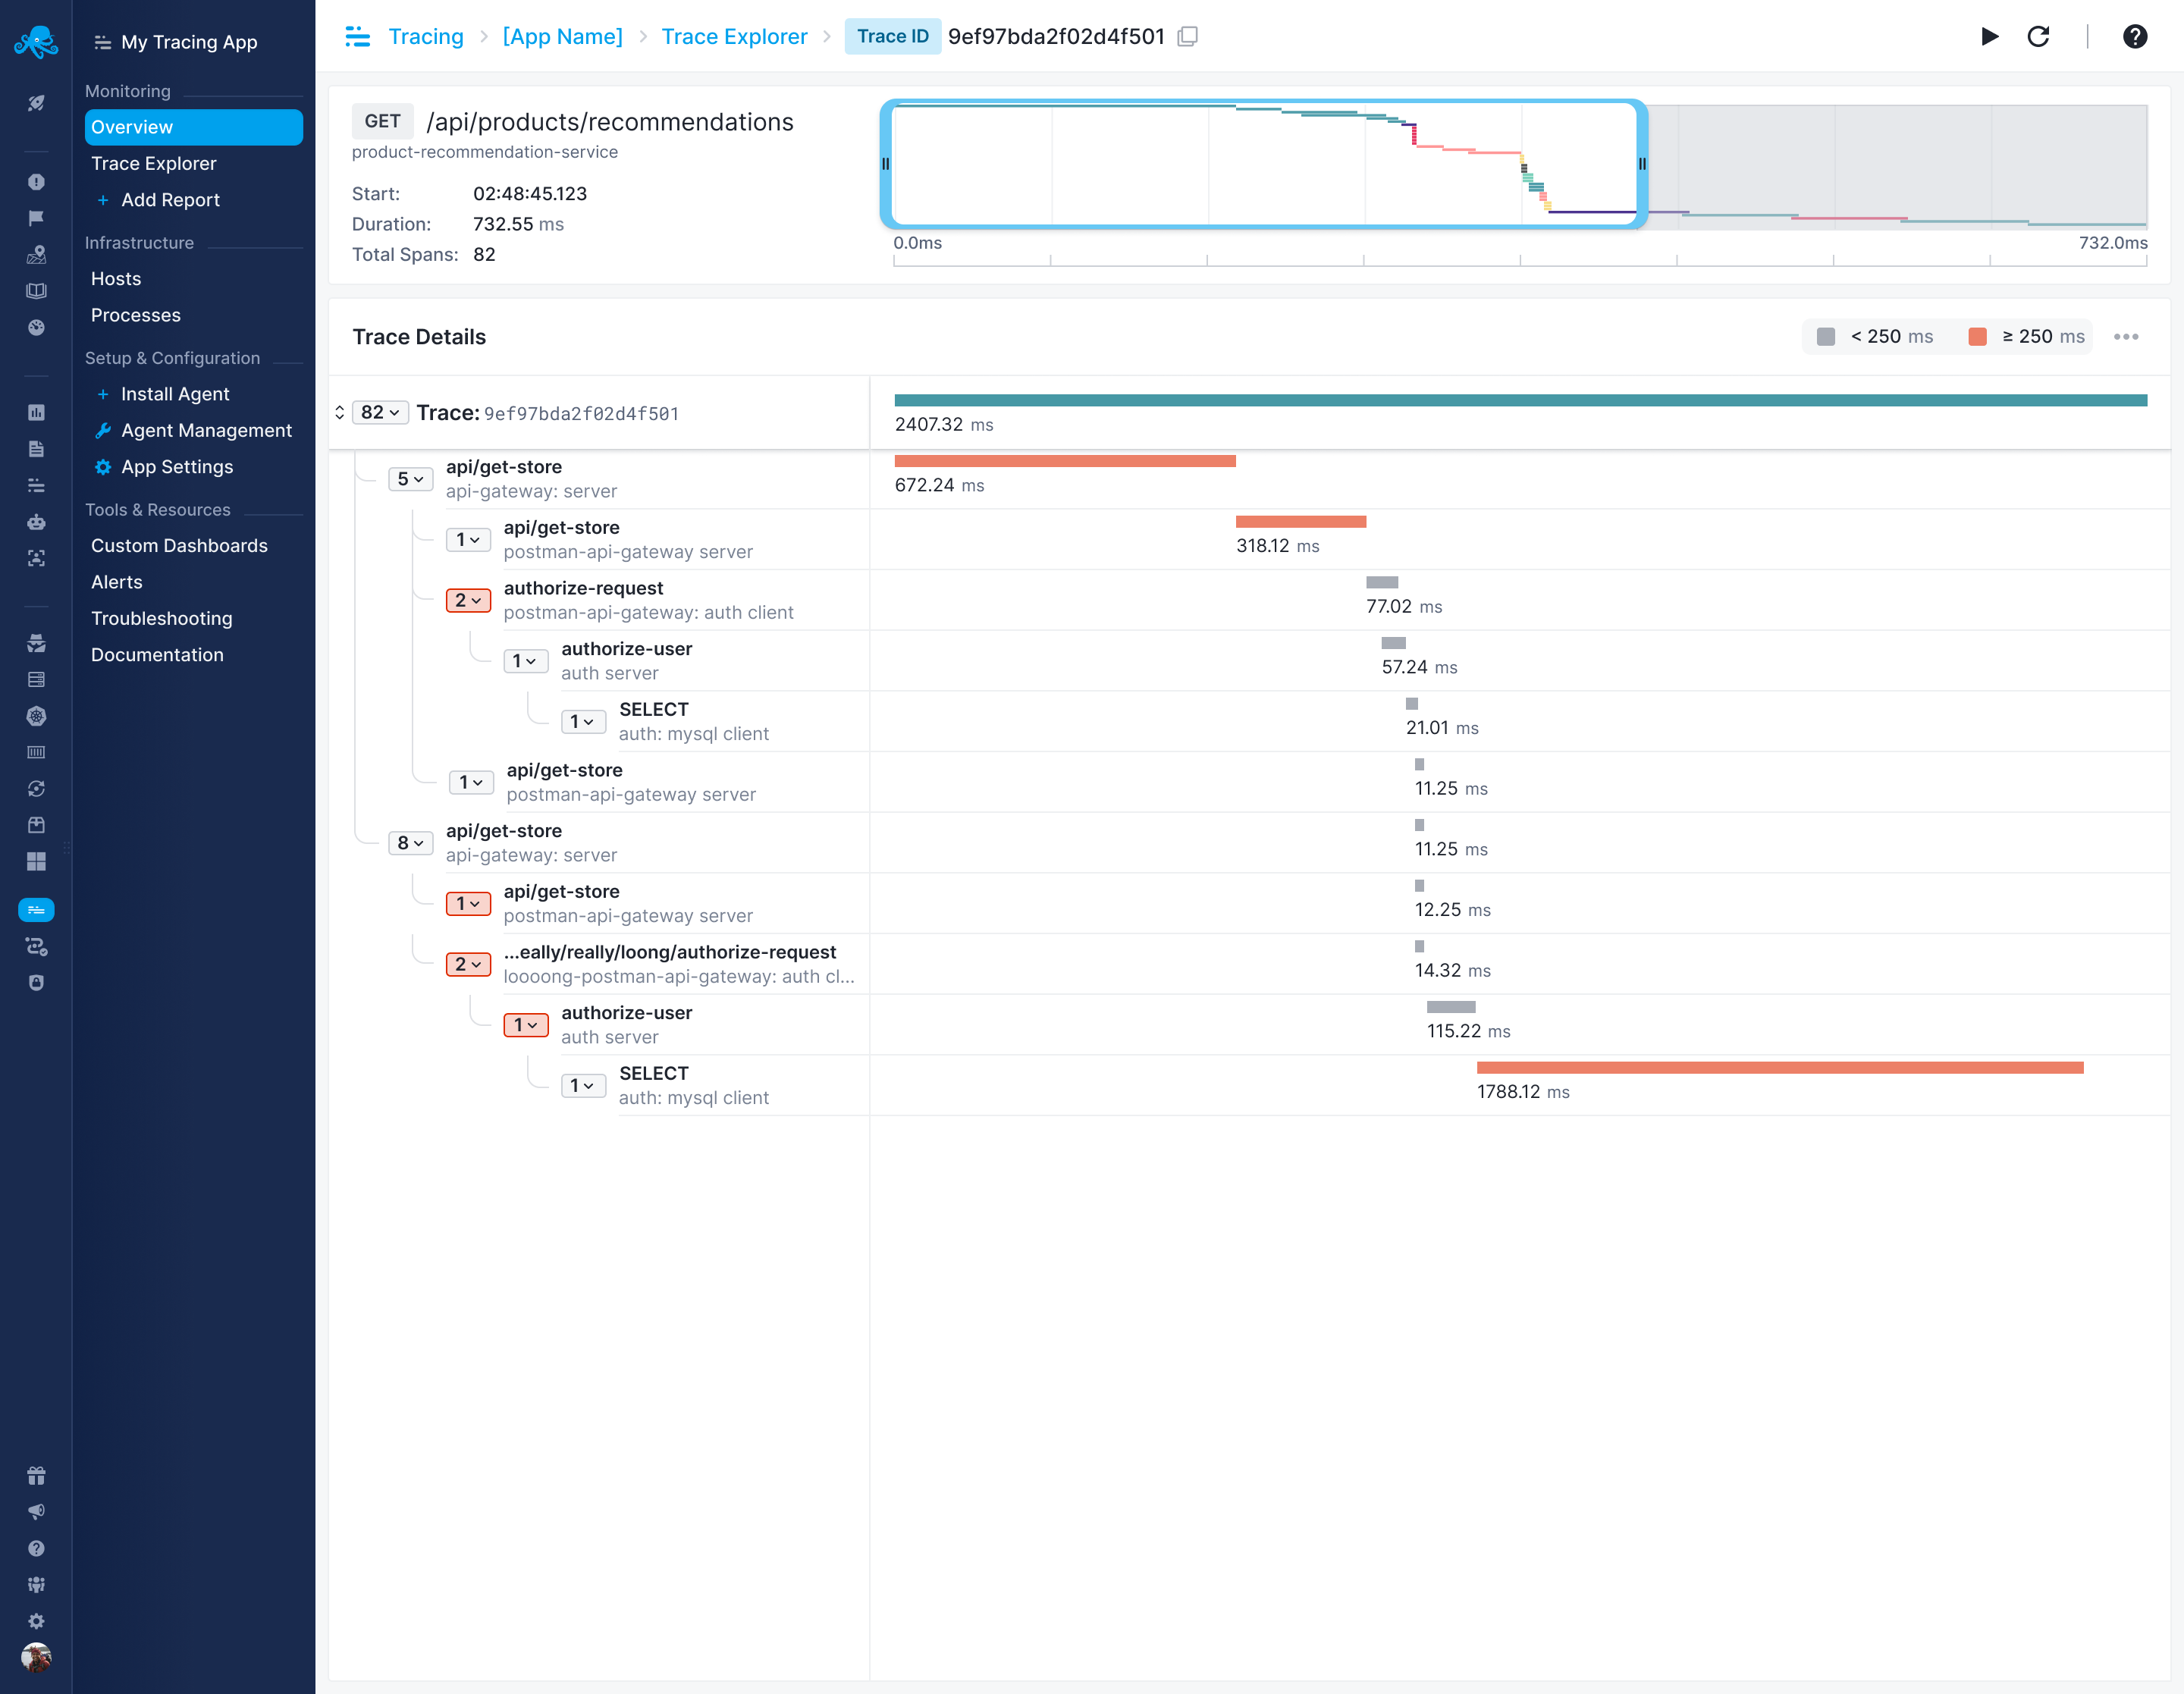
At the top of the trace details page, you'll see:
Trace Information
- Operation Name: The main operation (e.g., "order-consumed")
- Service: Which service handled the root span (e.g., "accounting")
- Start Time: When the trace began (e.g., "2025-09-02 3:44 PM")
- Duration: Total execution time (e.g., "37090.46 ms")
- Total Spans: Number of spans in the trace
Trace ID
The unique trace identifier is shown in the breadcrumb (e.g., 4c5793716f430b033f07b9322adc) with a copy button for easy sharing.
Waterfall Visualization
The main area displays a waterfall chart showing the execution flow:
Span Hierarchy
- Indentation: Shows parent-child relationships between spans
- Service Labels: Each span shows its service name
- Operation Names: The specific operation performed
- Duration Bars: Visual representation of each span's duration relative to the total trace time
Visual Indicators
- Red Circle: Indicates spans with errors
- Gray Text: Service names appear in gray below operation names
- Timeline: Shows relative timing of each span with a scale at the top (e.g., "0.0ms" to "37090.46ms")
Span Details Panel
Clicking on any span in the waterfall opens a detailed panel with multiple tabs:
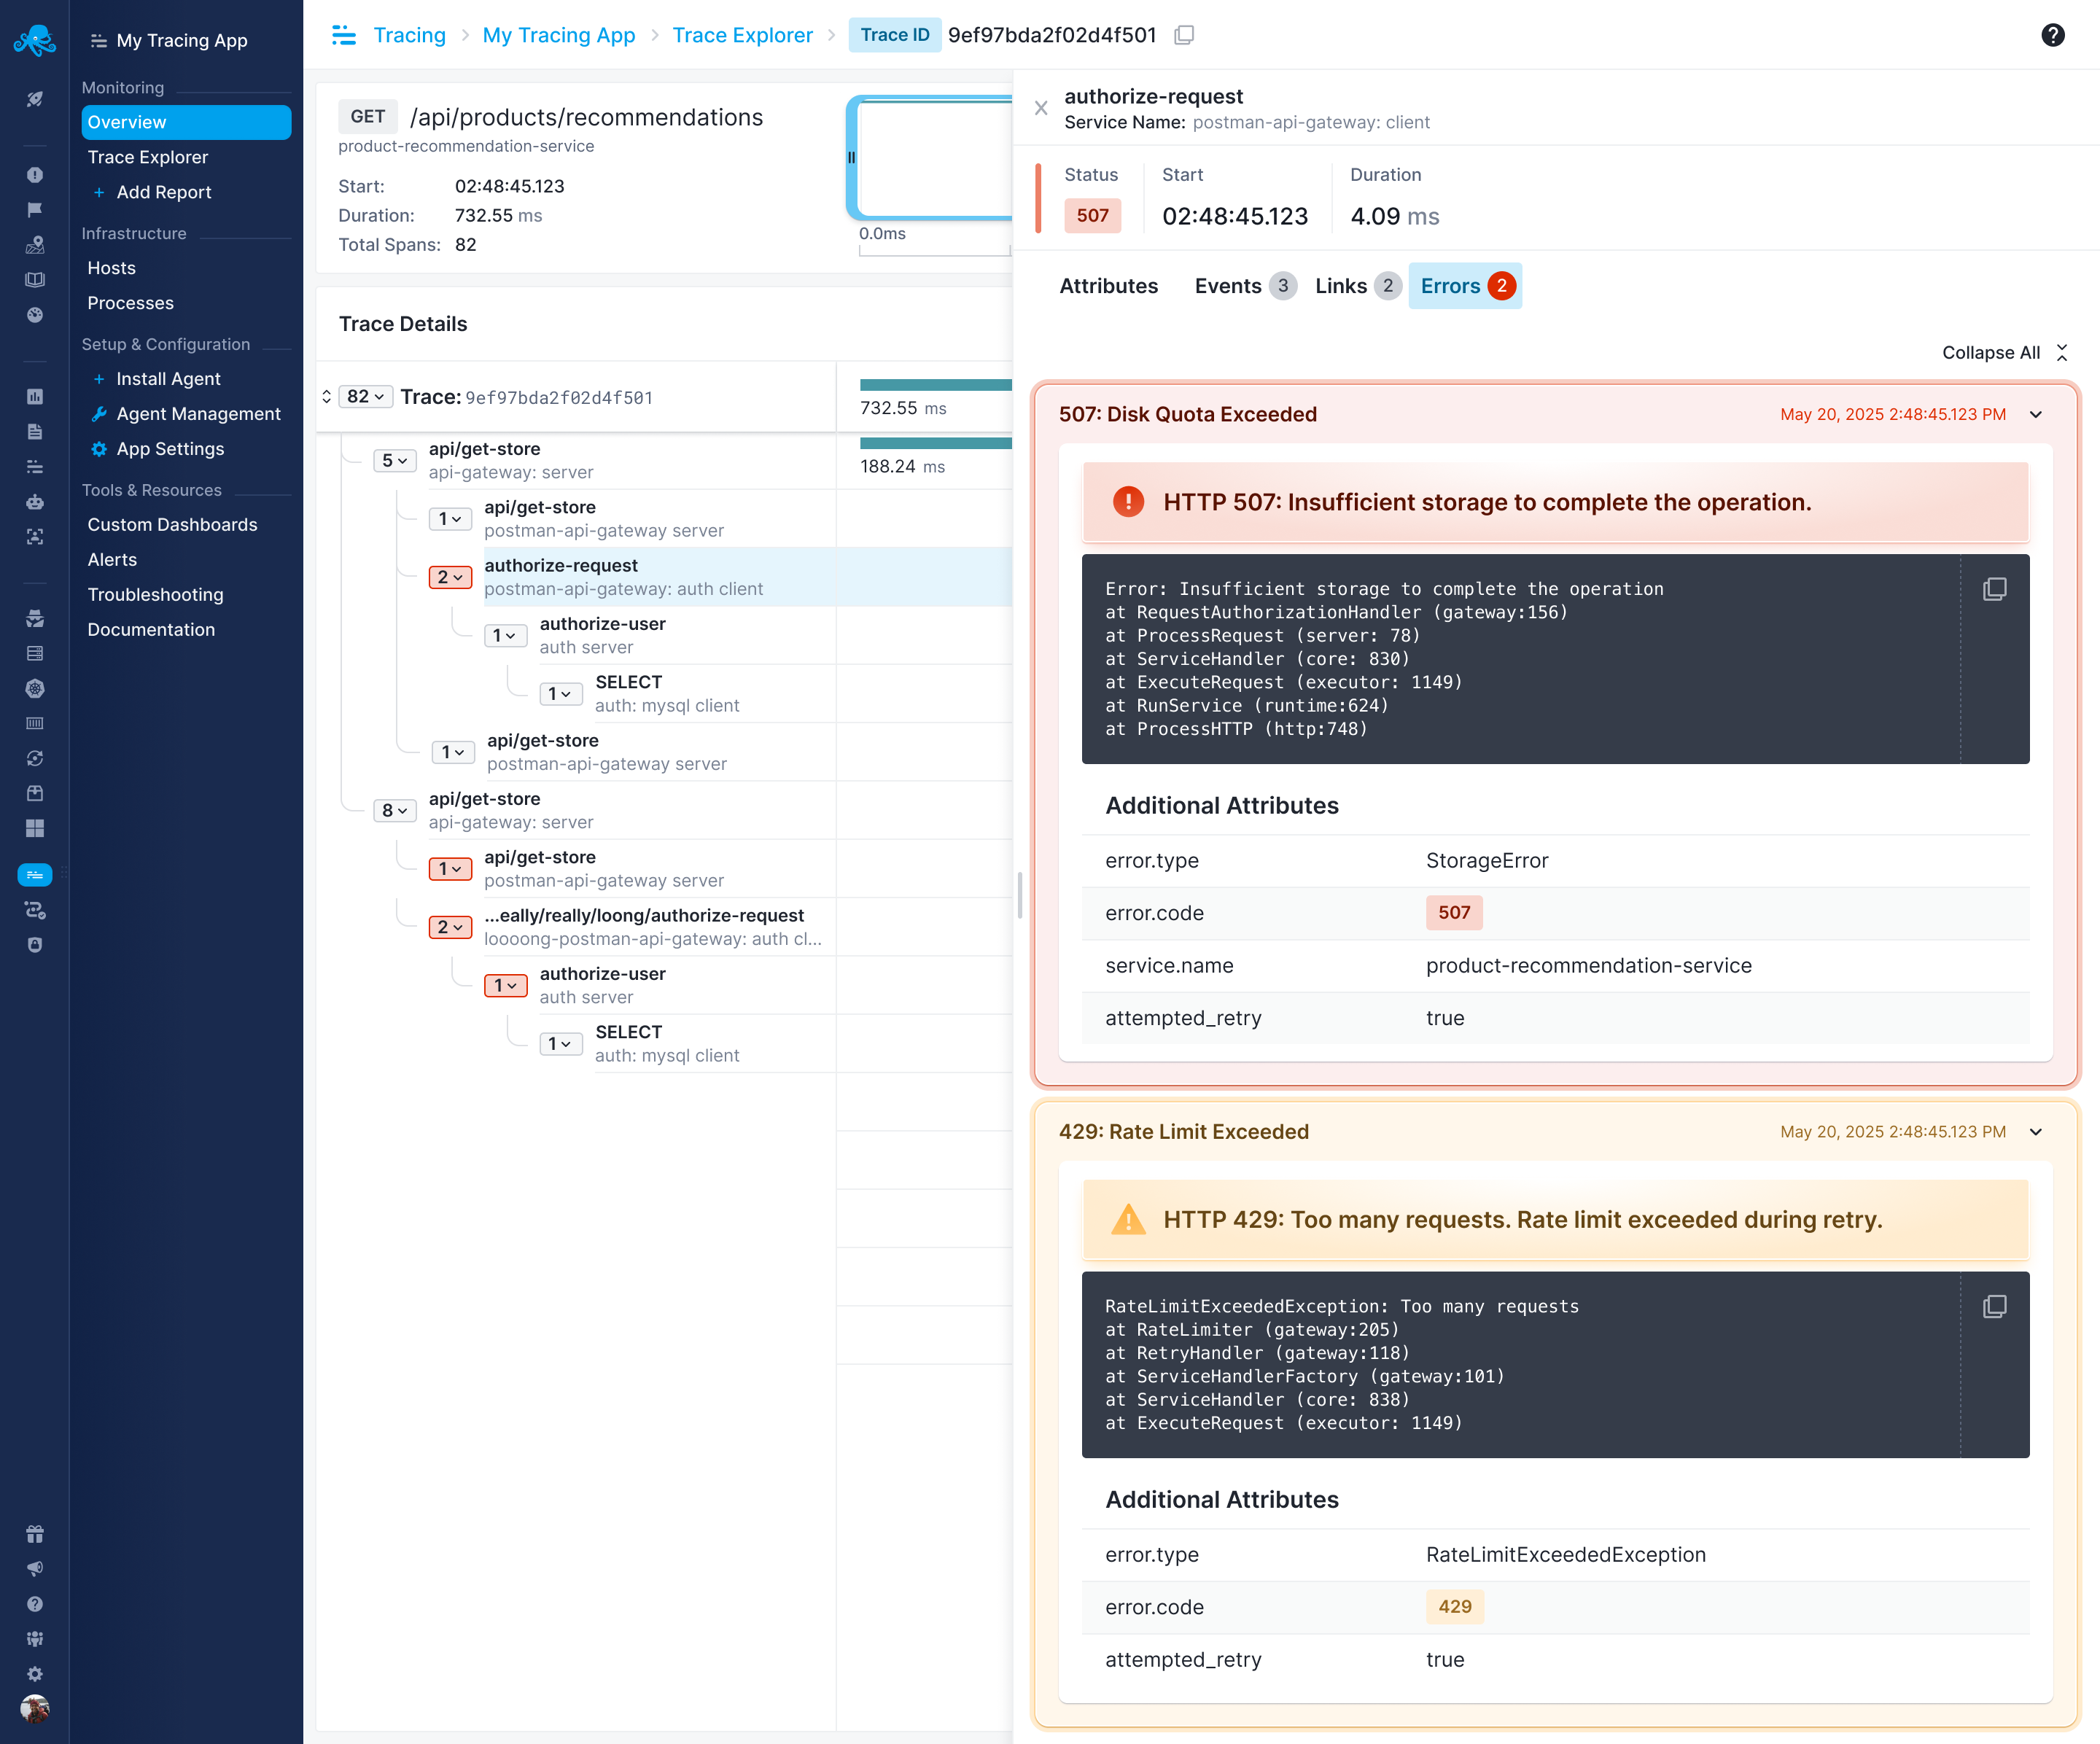
Span Header
Shows key information about the selected span:
- Status: Error or OK
- Service Name: Which service executed this span
- Start Time: When the span began
- Duration: How long the span took
- Dropped Entities: Number of dropped entities (if any)
Attributes Tab
Displays span attributes organized by category:
Environment
- os.name: Operating system name (e.g., "Debian GNU/Linux")
- os.type: Operating system type (e.g., "linux")
- os.version: OS version number
- os.build_id: Build identifier
- os.description: Detailed OS description
- os.host: Hostname where the span executed
Service
- service.namespace: Service namespace (e.g., "opentelemetry-demo")
- service.version: Service version number
- service.name: Service name
Database
Database-related attributes if the span involves database operations:
- db.name: Database name (e.g., "otel")
- db.statement: SQL query with sensitive values replaced by
?placeholders - db.operation: Operation type (SELECT, INSERT, UPDATE, DELETE)
- db.system: Database system (postgresql, mysql, mongodb, redis, etc.)
- db.user: Database username (if not filtered for security)
- net.peer.name: Database server hostname
- net.peer.port: Database server port
Note on SQL queries: For security, OpenTelemetry replaces actual parameter values with placeholders. You'll see query structure but not the actual data values. For example:
- Query executed:
SELECT * FROM orders WHERE user_id = 12345 AND status = 'pending' - Shown in trace:
SELECT * FROM orders WHERE user_id = ? AND status = ?
Events Tab
Shows events that occurred during span execution:
Exception Events
When an error occurs, displays:
- Event Name: "exception"
- Timestamp: When the exception occurred
- exception.message: The error message
- exception.type: Type of exception (e.g., "Npgsql.PostgresException")
- exception.stacktrace: Full stack trace
- exception.escaped: Whether the exception was handled
Errors Tab
For spans with errors, provides detailed error information:
Error Summary
- Error Message: Brief description of the error
- Error Type: Classification of the error
Stack Trace
Full stack trace showing:
- File locations
- Line numbers
- Method calls
- Exception details
Additional Attributes
- exception.type: Specific exception class
- exception.escaped: Whether the exception propagated
Navigating Trace Details
Collapsing Sections
- Use "Collapse all" button to collapse expanded attribute sections
- Individual sections can be expanded/collapsed with arrow icons
Copying Information
- Trace ID can be copied from the breadcrumb
- Individual attribute values can be selected and copied
Returning to Explorer
- Use the breadcrumb navigation to return to Trace Explorer
- Browser back button also returns to the previous view
Understanding Span Relationships
Parent-Child Hierarchy
- Root span appears at the top
- Child spans are indented under their parents
- Sibling spans appear at the same indentation level
Cross-Service Calls
- Different services are clearly labeled
- Shows how requests flow between services
- Helps identify service dependencies
Timing Analysis
- Visual timeline shows concurrent vs sequential execution
- Gaps in the timeline may indicate network latency or waiting time
- Overlapping bars show parallel execution
Common Analysis Tasks
Error Investigation
- Look for red error indicators in the waterfall
- Click on the error span
- Check the Errors tab for stack trace
- Review Events tab for exception details
- Examine Attributes for context
Performance Analysis
- Identify the longest duration spans in the waterfall
- Check if long spans are sequential or have gaps
- Look for repeated operations that could be optimized
-
Examine database query spans for slow queries:
- Check
db.statementattribute for query structure - Look for N+1 query patterns (multiple similar queries)
- Identify queries without proper indexing (high duration SELECTs)
- Watch for connection pool exhaustion (connection acquisition delays)
- Check
Service Communication
- Follow the indentation to understand service calls
- Check which services are called most frequently
- Identify circular dependencies or unnecessary calls
- Analyze cross-service latency
Best Practices
Effective Debugging
- Start with the error spans and work backwards
- Check parent spans for context when investigating errors
- Use attributes to understand the request parameters
- Review the full stack trace for root cause analysis
Performance Optimization
- Focus on the longest spans first
- Look for patterns in slow operations
- Check for sequential operations that could be parallelized
- Identify repeated database queries or API calls
- Review
db.statementattributes to understand query complexity - Look for N+1 patterns in database operations
Understanding Context
- Review service attributes to understand the environment
- Check timestamps to correlate with other events
- Use the trace ID to find related logs
- Examine custom attributes for business context
Next Steps
- Return to Traces Explorer
- Visualize service dependencies
- Set up alerts for errors
- View Tracing Overview