Alerts Guide
Receiving Alerts when your software is misbehaving or underperforming is crucial for every developer. Good alerting practices include:
- Alert Rules that detect Anomalies and notify when key performance indicators spike or drop
- Criteria that trigger Alerts for monitored resources
- Thresholds defined for Alerts when selected metrics reach certain severity levels
- Notification channels through which the responsible team will be notified about the incident
Sematext Alerts help you address underlying issues before they affect user experience. There are three types of Alerts.
- Threshold - Alerts that are based on classic thresholds. They are triggered when something crosses a pre-defined threshold.
- Heartbeat - Alerts triggered when something you are monitoring, like your servers, containers, or your applications, stops sending data to Sematext Cloud.
- Anomaly - Alerts based on statistical anomaly detection. They are triggered when values suddenly change and deviate from the baseline.
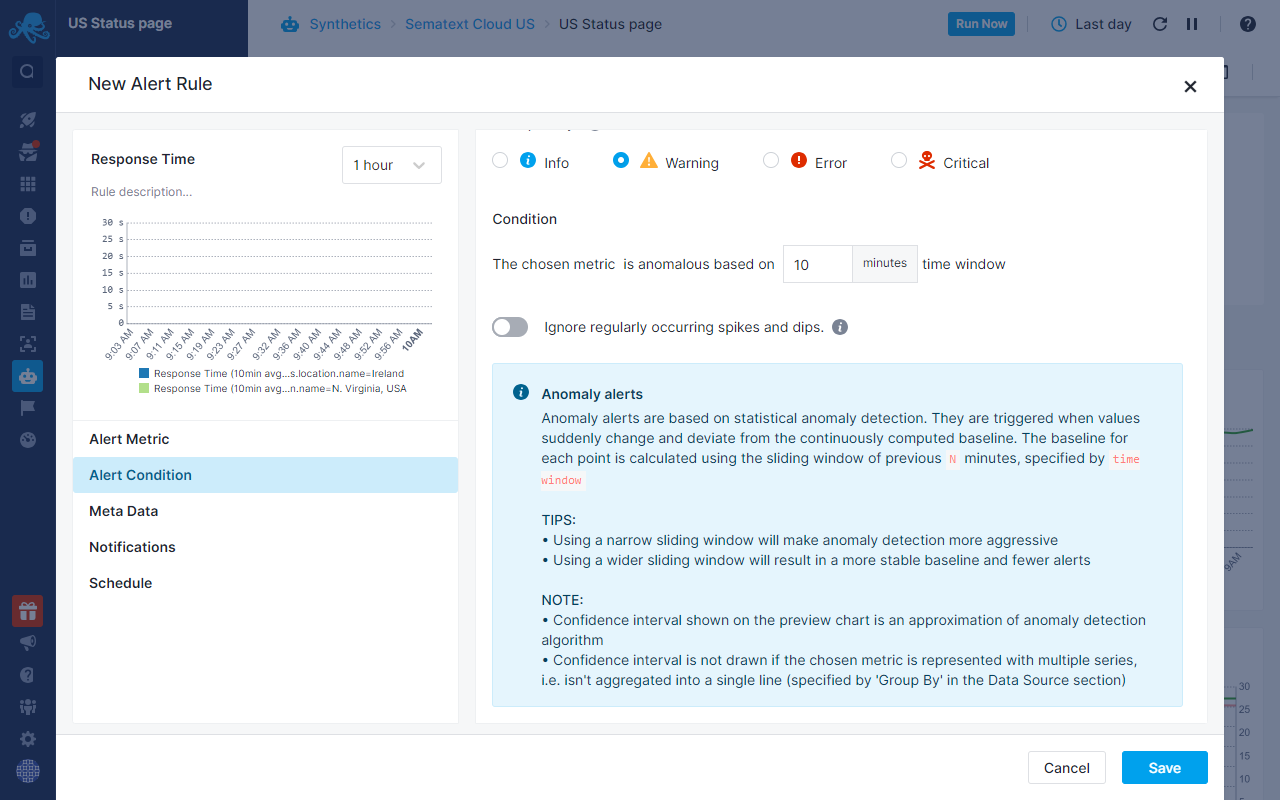
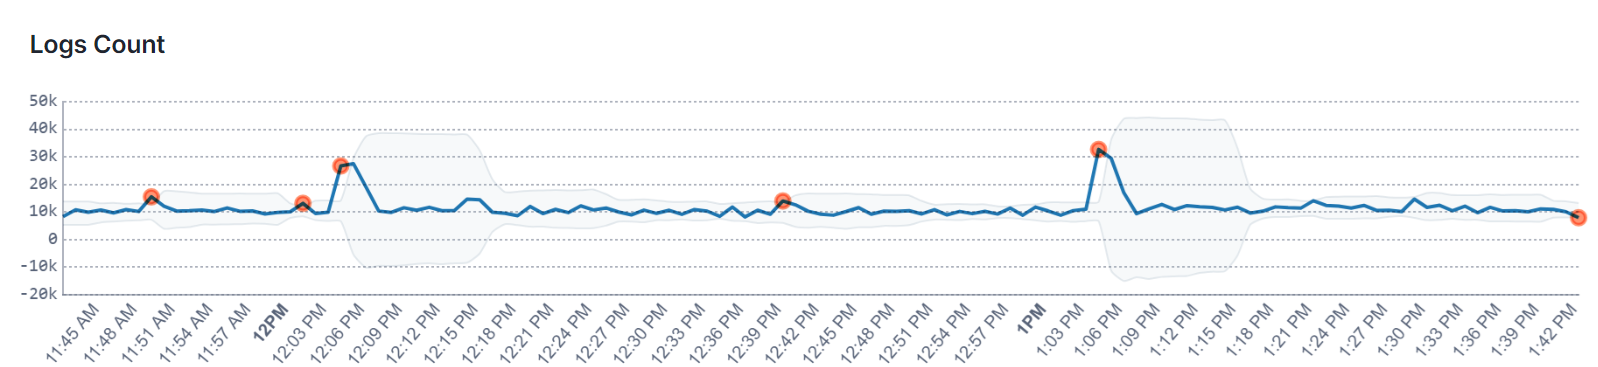
When an anomaly alert is triggered, you'll be able to observe spikes and dips within the alert details flyout upon clicking on the alert event. The chart also features a confidence band that illustrates the range of certainty around the expected values.
Threshold and Anomaly Alerts can be triggered for Monitoring, Logs, Synthetics and Experience Apps, while Heartbeat Alerts are only available for Monitoring Apps.
Sematext lets you manage Alert Rules across your whole stack. You can use various notification channels to get alerted when critical issues occur so you can take action and resolve them. Our Alerts easily integrate with notification and chat software.
Default Alerts
For Logs, Monitoring, or Synthetics, as soon as an App is created, you will see several app-specific Alerts Rules created for you by default.
Default Alerts for an Infrastructure App:
Default Alerts for a Monitoring App:
- Metric Alert for Disk Usage
- Heartbeat Alert if the Agent stops sending data to the Monitoring App
- Metric Anomaly Alert for misbehaving Nodes
Default Alerts for a Logs App:
- Anomaly Alerts for Error and Warning search queries
For Logs or Monitoring, there are also default alerts for integrations which are designed based on crucial metrics and logs essential for monitoring and taking action within that specific service type.
In this example which is an Elasticsearch Monitoring App, the Java usage threshold and Elasticsearch Node Anomalies are integration-specific default Alerts.
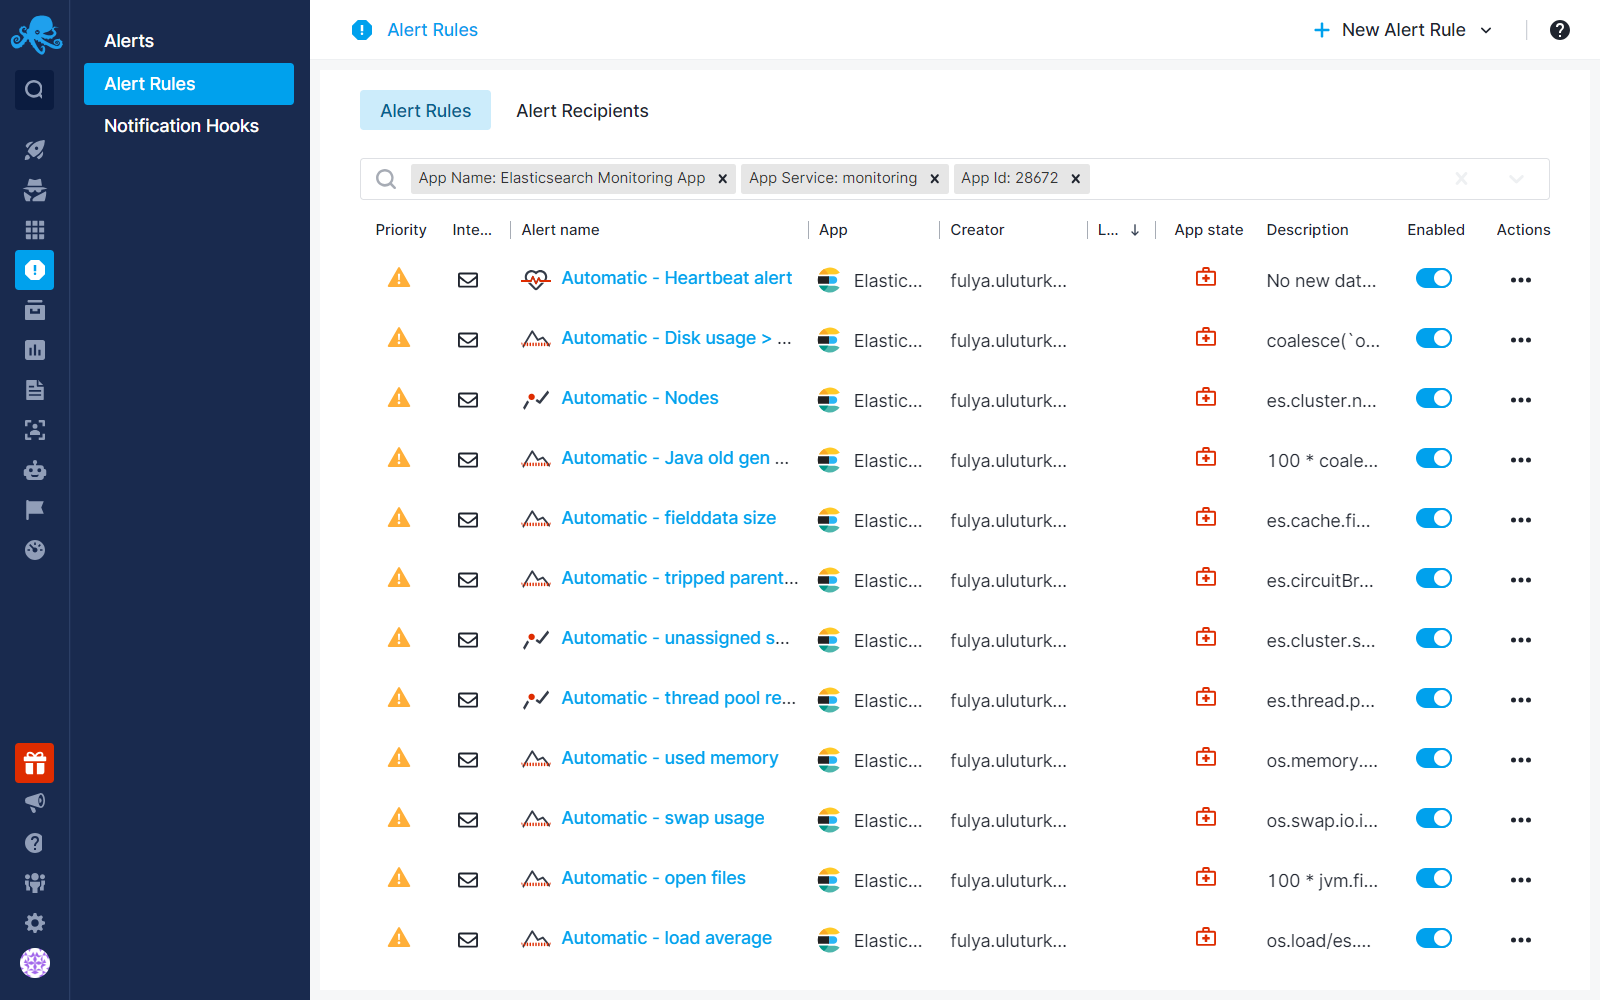
You can view all the default and custom Alerts on the Alert Rules page. This is where you can toggle, edit or delete any existing Alerts.

You can also have your preferred AI agent review your alerts and how frequently they trigger via the Sematext Cloud MCP Server.
More detailed instructions are provided in Alerts Rules Overview.