Overview
While Synthetics monitors detect website and API performance and availability issues, pinpointing backend issues that caused or are related to a failed monitor can be challenging. By leveraging Sematext all-in-one-platform capabilities you can identify the root cause of backend issues that caused your Synthetic monitor to fail. To do that you’ll want to connect your Monitoring and Logs Apps with your Synthetics Apps, as described below.
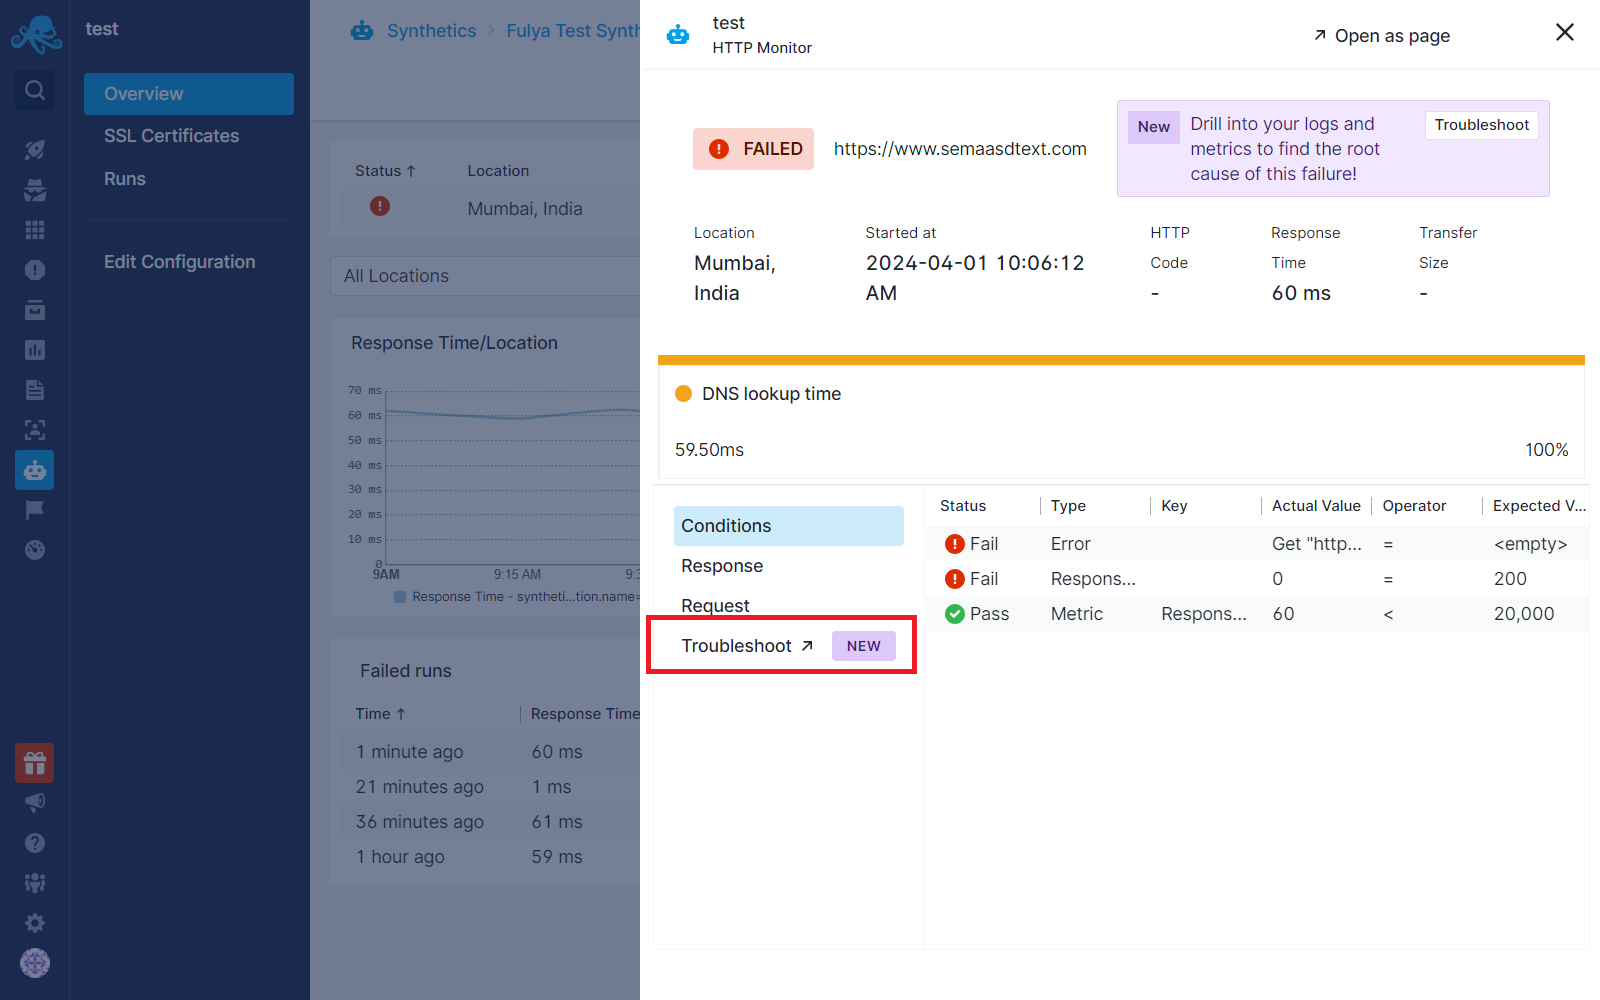
When a Synthetics monitor run fails, a Troubleshoot tab, shown below, is introduced under the failed runs flyout. This tab provides options to troubleshoot backend issues by correlating with metrics and logs.
Correlating with Metrics
Whenever a Synthetic monitor checks an endpoint, it triggers the execution of something that handles that endpoint. This might be an application, a serverless function, or something else. Digging into their performance metrics around the time when a monitor failed can provide clues about the failure. Perhaps the application or the underlying infrastructure were overloaded at the time. Maybe some process was using 100% of the CPU. Maybe the underlying database had too many open connections. These are the sorts of things that you will be able to correlate with the failed monitor run when you make use of this new functionality.
Correlating with Logs
Similarly, examining error messages or warnings in logs related to the endpoint around the time of failure can offer valuable insights. Logs may reveal issues such as misconfigurations, server resource limitations, application errors, connectivity problems, etc.
Setting up Troubleshooting
During monitor runs, we attempt to detect the type of service that is hosting the endpoint being monitored, such as Nginx or Apache.
If the Service is Known by Sematext:
Sematext integrates with popular web servers such as Nginx, Apache, and more, providing out-of-the-box dashboards and alert rules tailored to each service type. If you don’t have any Monitoring or Logs Apps in your account for the supported service, we will recommend creating one in the troubleshoot tab, as shown below. This will lead you to the Monitoring or Logs App creation. There you can install the Sematext Agent based on the environment you choose and start shipping metrics and logs from that service.
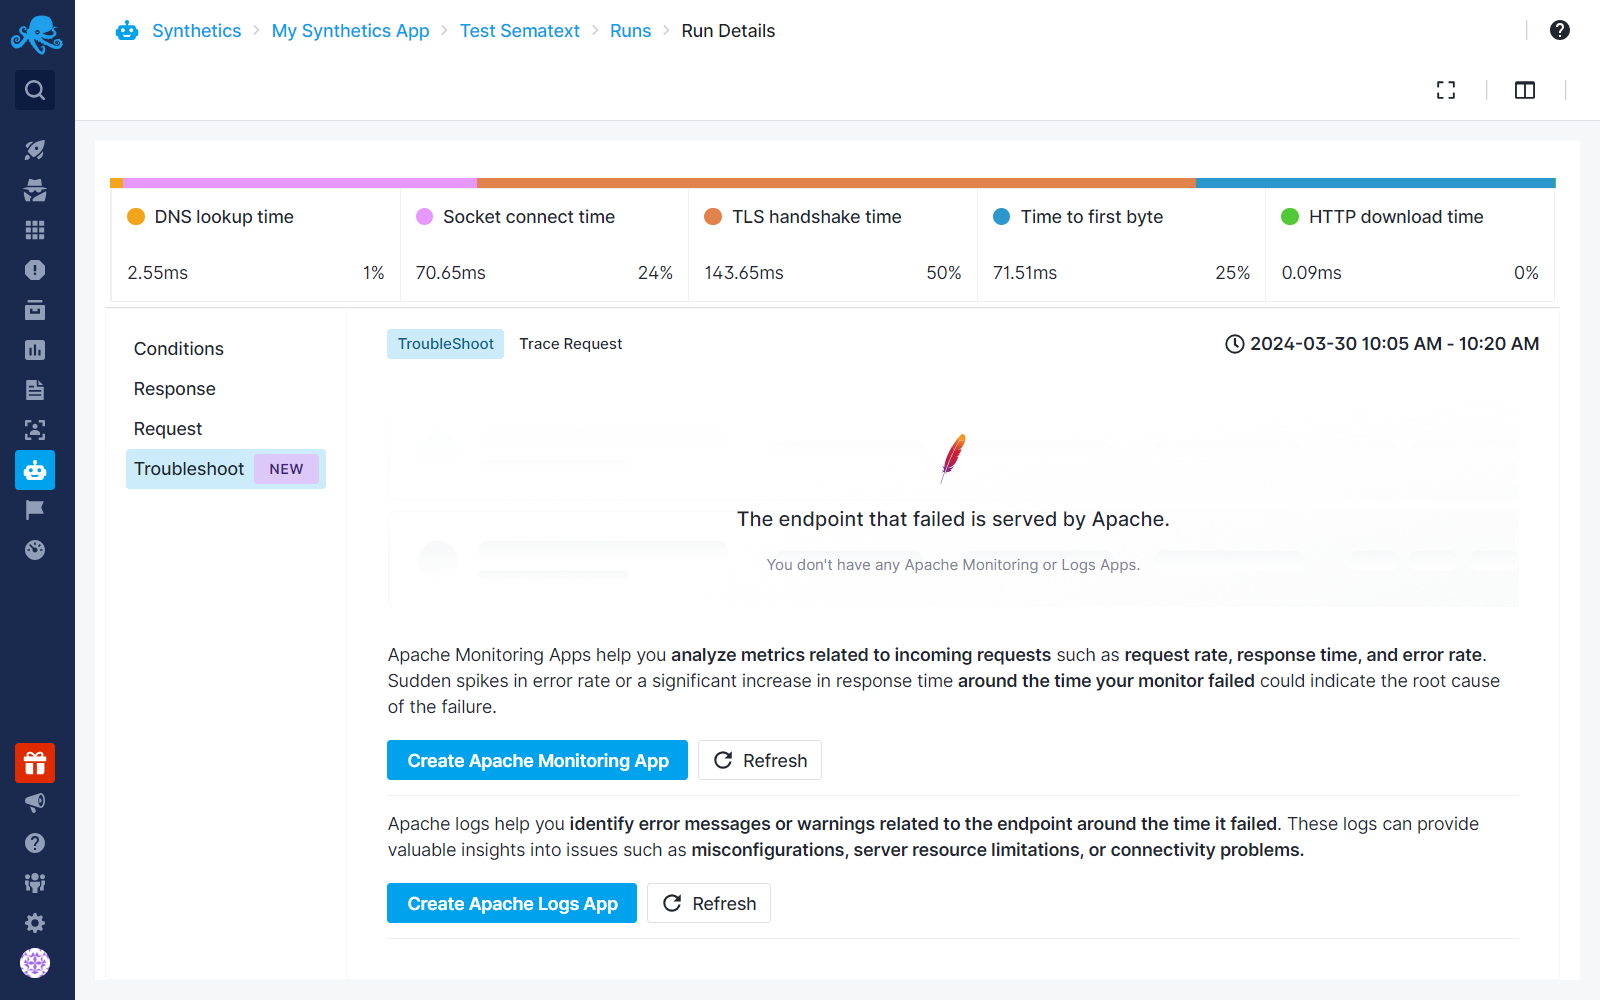
Let’s imagine you’ve created a Monitoring App for Apache, installed Sematext Agent, and started monitoring Apache metrics. Now the Troubleshoot tab will change to Metrics and Logs tabs as shown in the screenshot below. The next time you go into the troubleshooting tab, if you want to add Logs on top of it, you don’t need to install anything additionally.
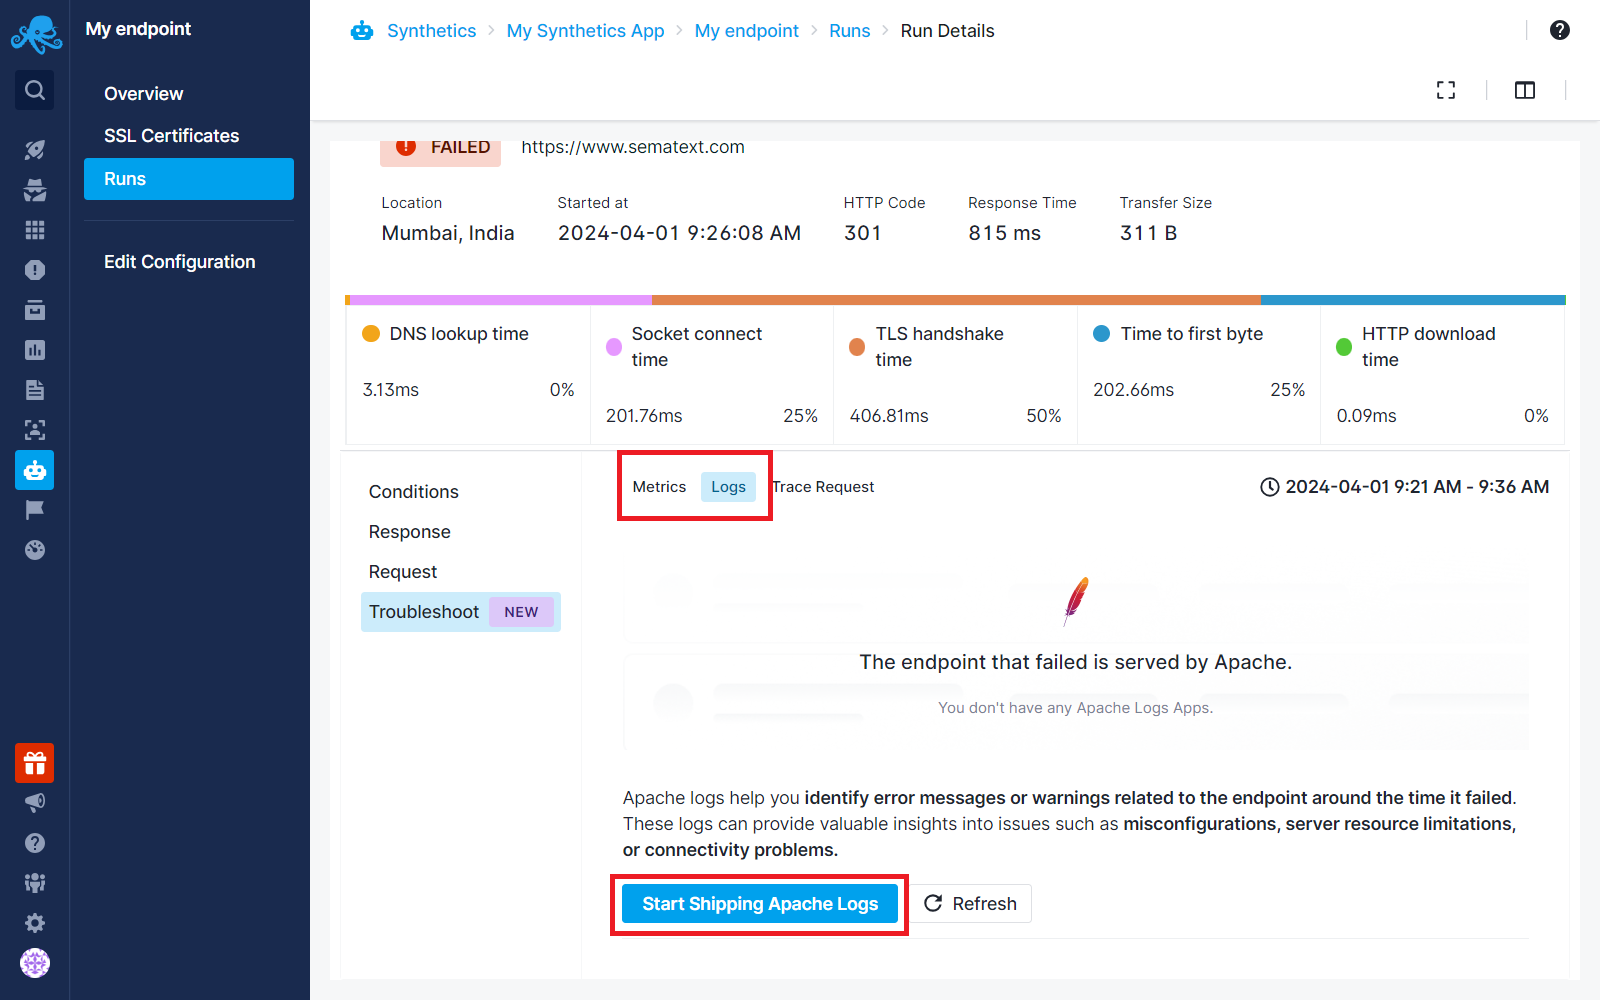
We will just direct you to the Discovery page, where you can easily set up log shipping from the service type with a couple of clicks without needing any additional installation.

Upon creating the Apps or connecting existing ones, you will start seeing metrics and logs around the time your monitor failed within the Troubleshoot tab, allowing you to drill down to the root cause from a single page. For more details, refer to the Troubleshooting section.
If the Service is Unknown by Sematext:
In cases where the service type is unknown, all existing Monitoring and Logs Apps associated with your account are listed. You can choose to connect relevant Apps directly from the Troubleshoot tab, as seen here
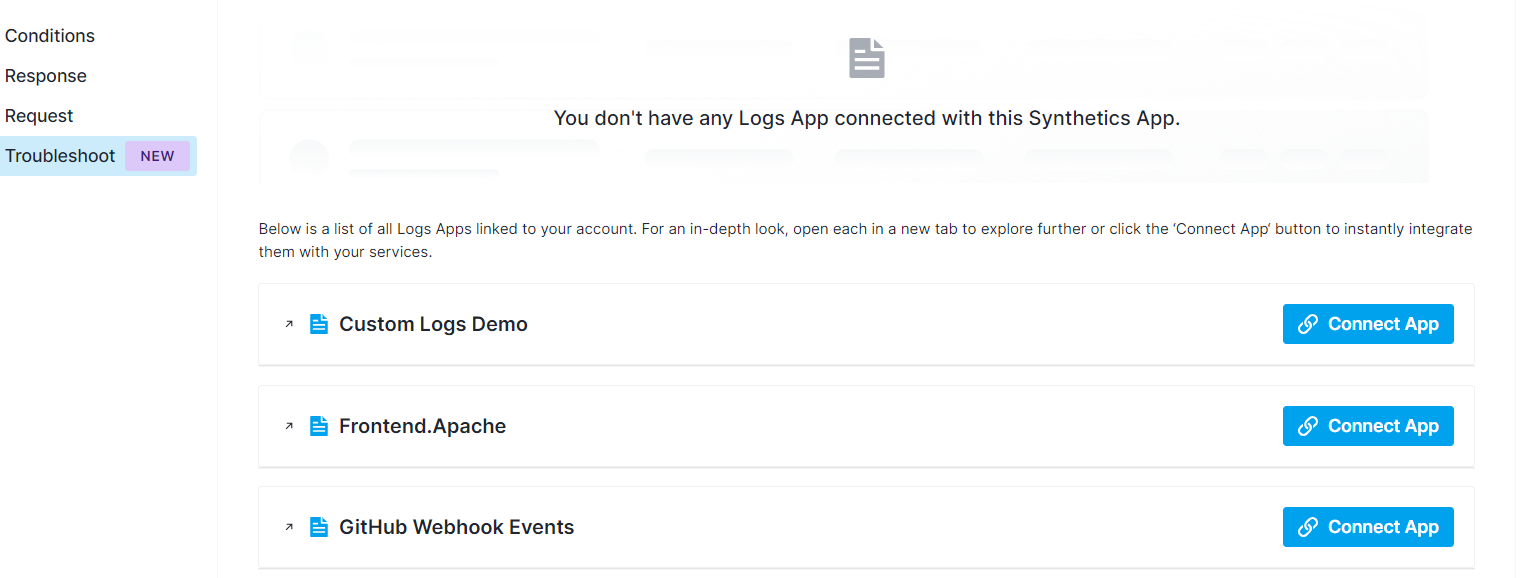
If no Apps exist, you can create them from the tab, and they will be automatically connected with your Synthetics App, where you can view metrics and logs the next time your monitor fails. For more details, refer to the Troubleshooting section.
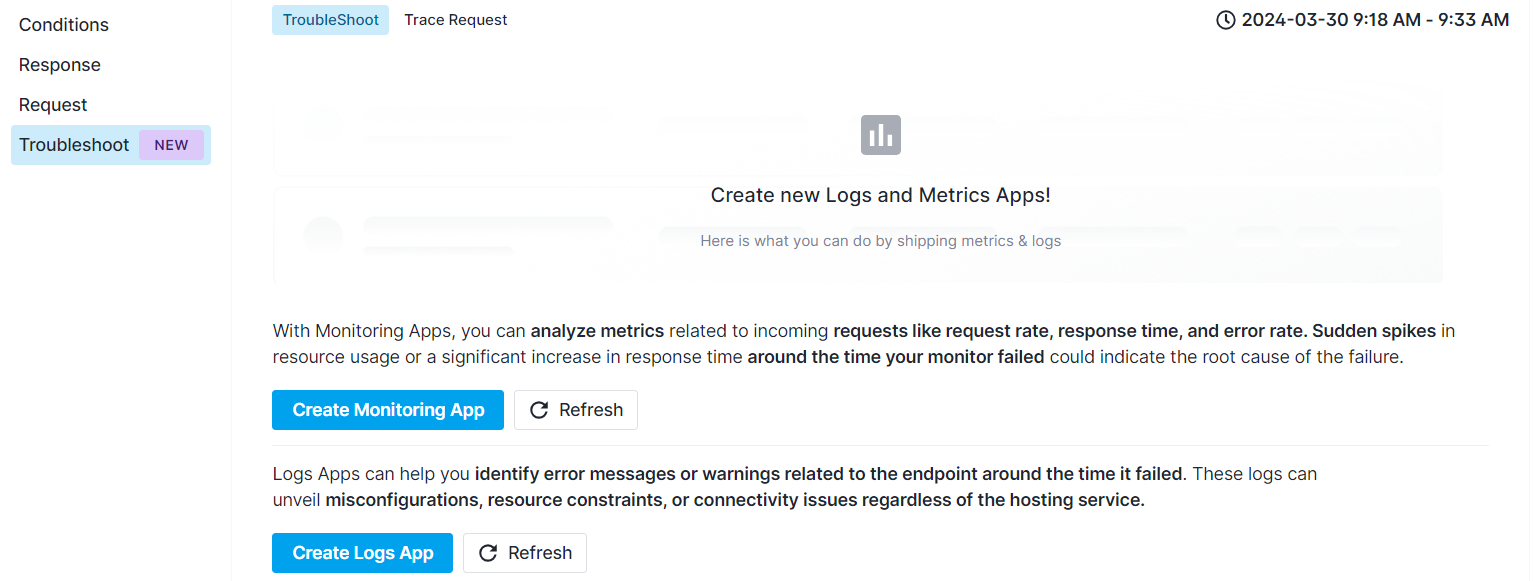
Trace Request
Trace request tab lets you look at logs related to a specific failed synthetic monitor run by adding the Synthetics request IDs to your applications and services logs.
For more information, including how to set that up, refer to How to troubleshoot with Synthetics Request ID.
Troubleshooting
Once you have configured metrics and log shipping, whether for a known or unknown service type, all Monitoring and Logs Apps that are connected to your Synthetics App will appear under the Troubleshoot tab.
Metrics
Under the Metrics tab, you'll find a list of Monitoring Apps connected with your Synthetics App:
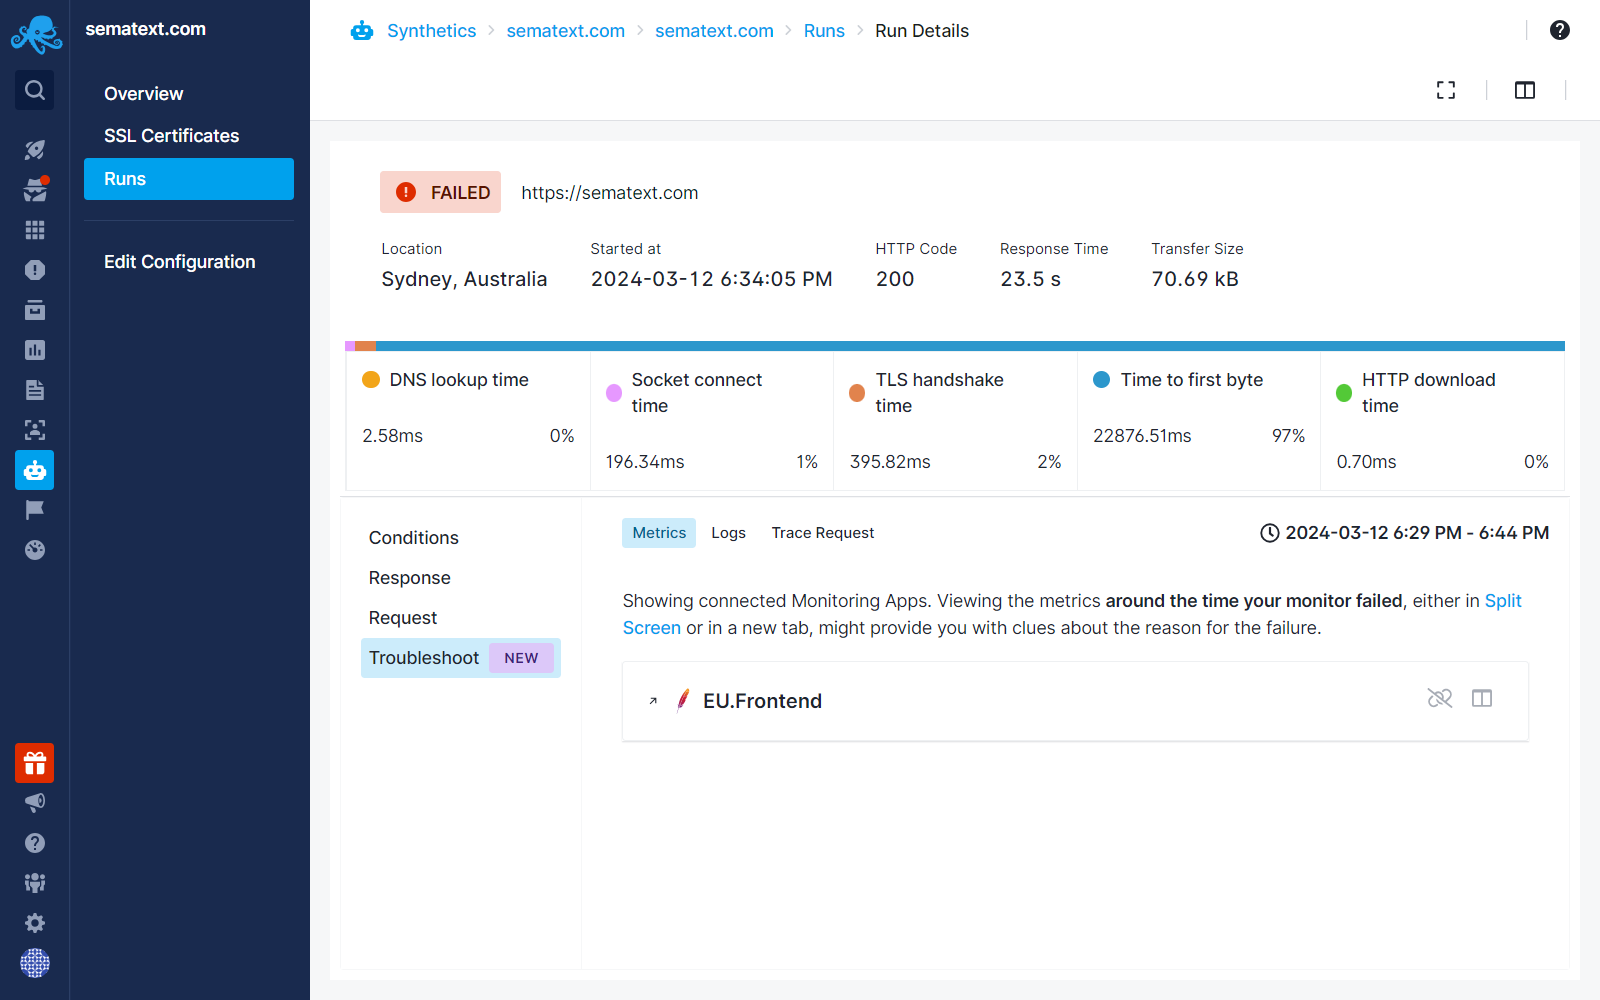
To analyze metrics around the time your monitor failed, you can open the relevant Monitoring Apps either in a Split Screen or in a new tab. Look for any sudden spikes or anomalies in metrics that are critical for your endpoint. Use these metrics to identify potential root causes of the failure.
In the image below, our sematext.com endpoint has failed, which is hosted by an Apache server. We are shipping metrics from that server into an Apache Monitoring App called EU.Frontend, which is connected to our Synthetics App.
We navigate to the Troubleshoot tab and then open the Apache Monitoring App in a new tab by clicking on the App name or within the same screen using the Split Screen button.
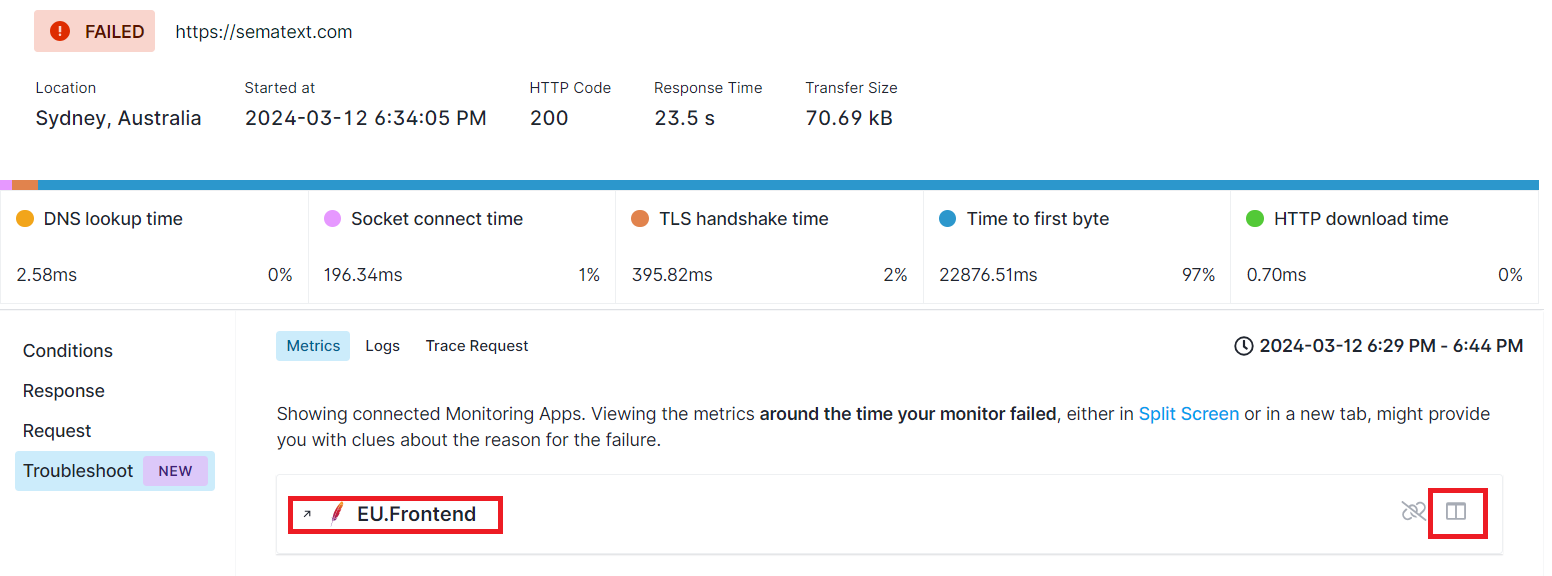
An automatic filter is applied to show the metrics around the time our monitor failed. Sematext From there, we would want to check basics first, such as CPU and Memory charts around the time the monitor failed.
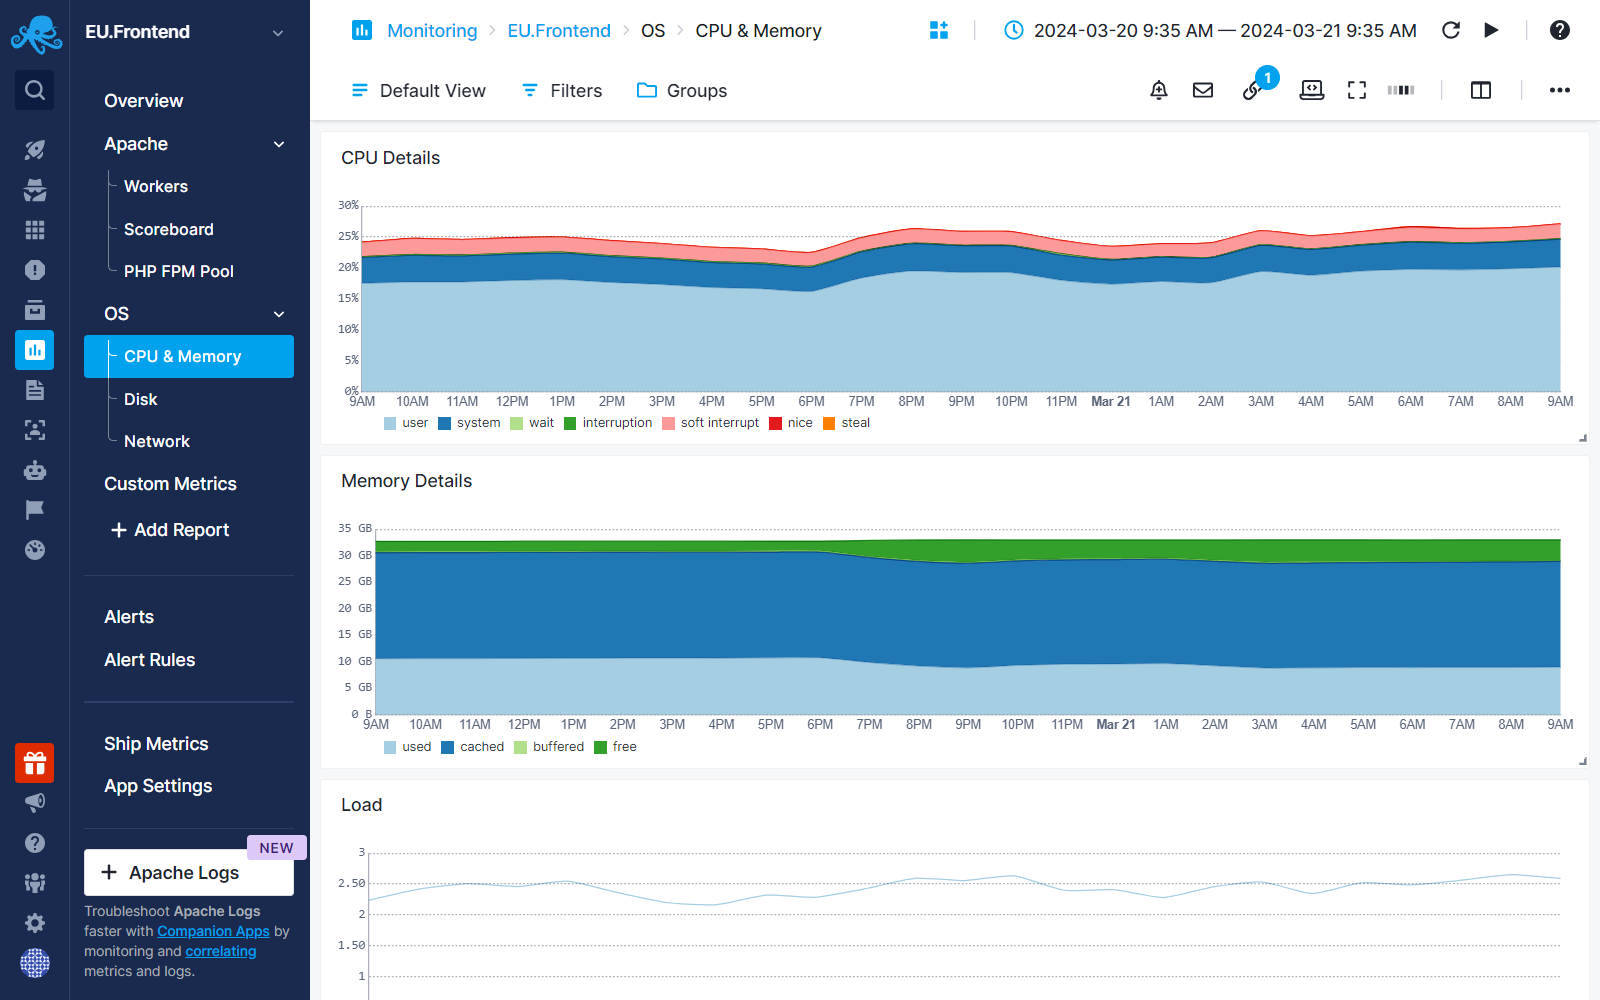
Then, we can check charts for request rate and traffic rate to observe trends, along with CPU/Memory utilization charts.
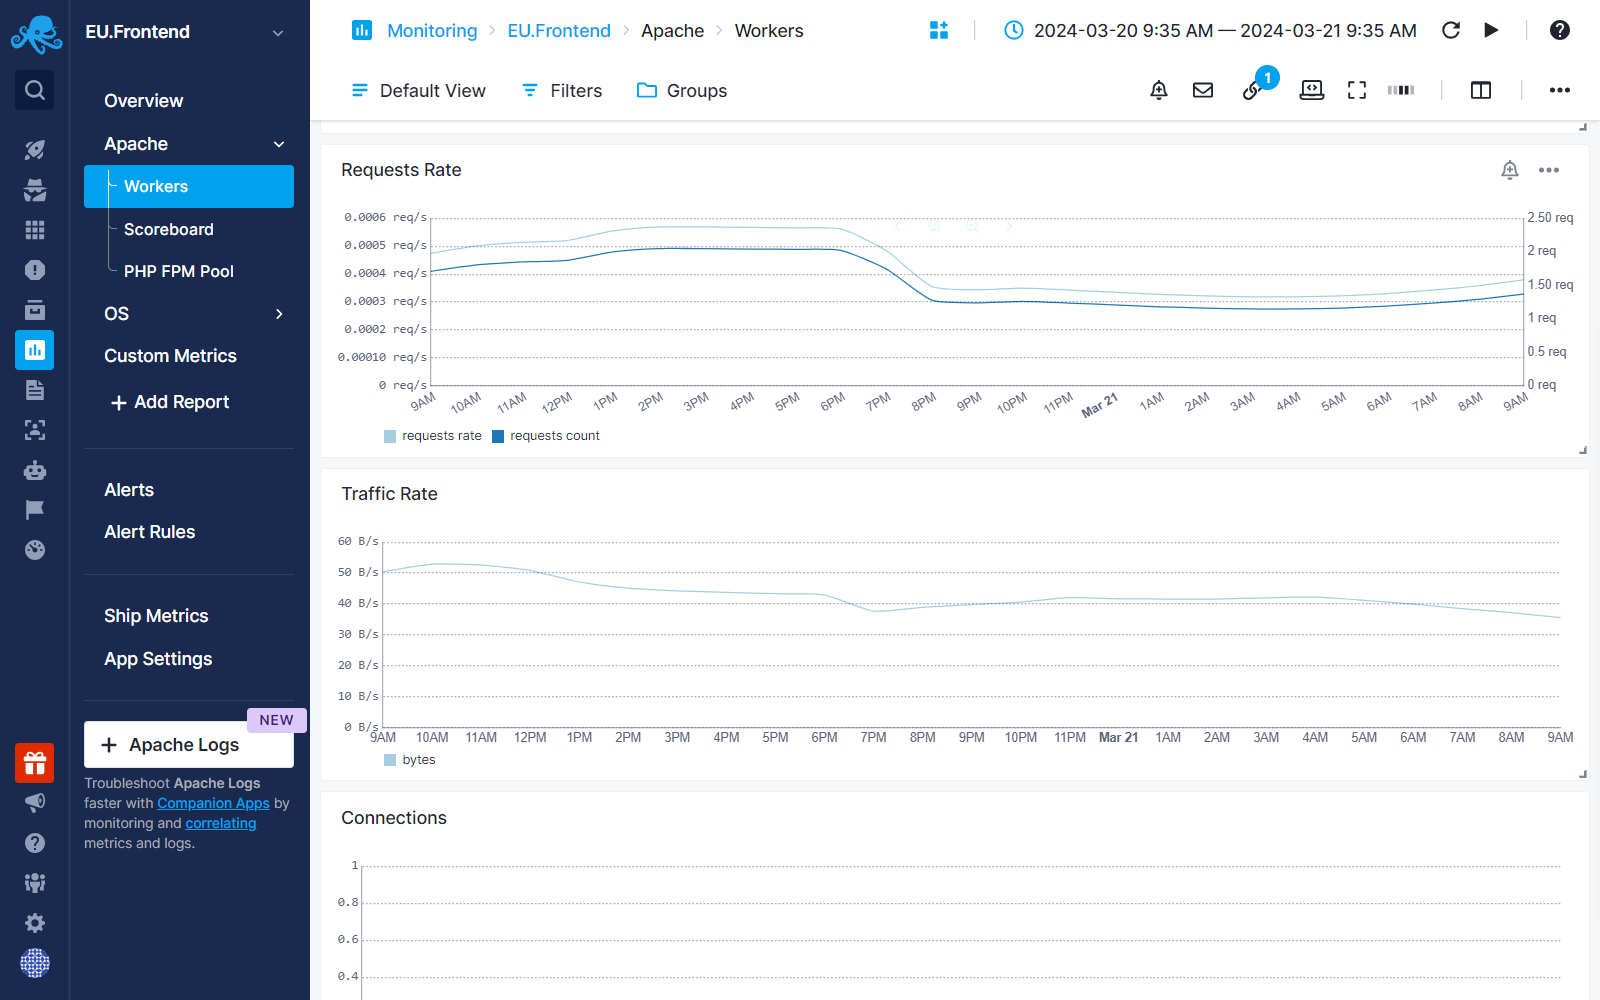
If you don't find anomalies in these charts, we move on to the logs!
Logs
Any connected Logs Apps will appear under the Logs tab. Each Logs App will display the number of error and warning logs detected around the time your monitor failed. If you have multiple hosts shipping logs to the same App, you will see errors and warnings specific to each host.
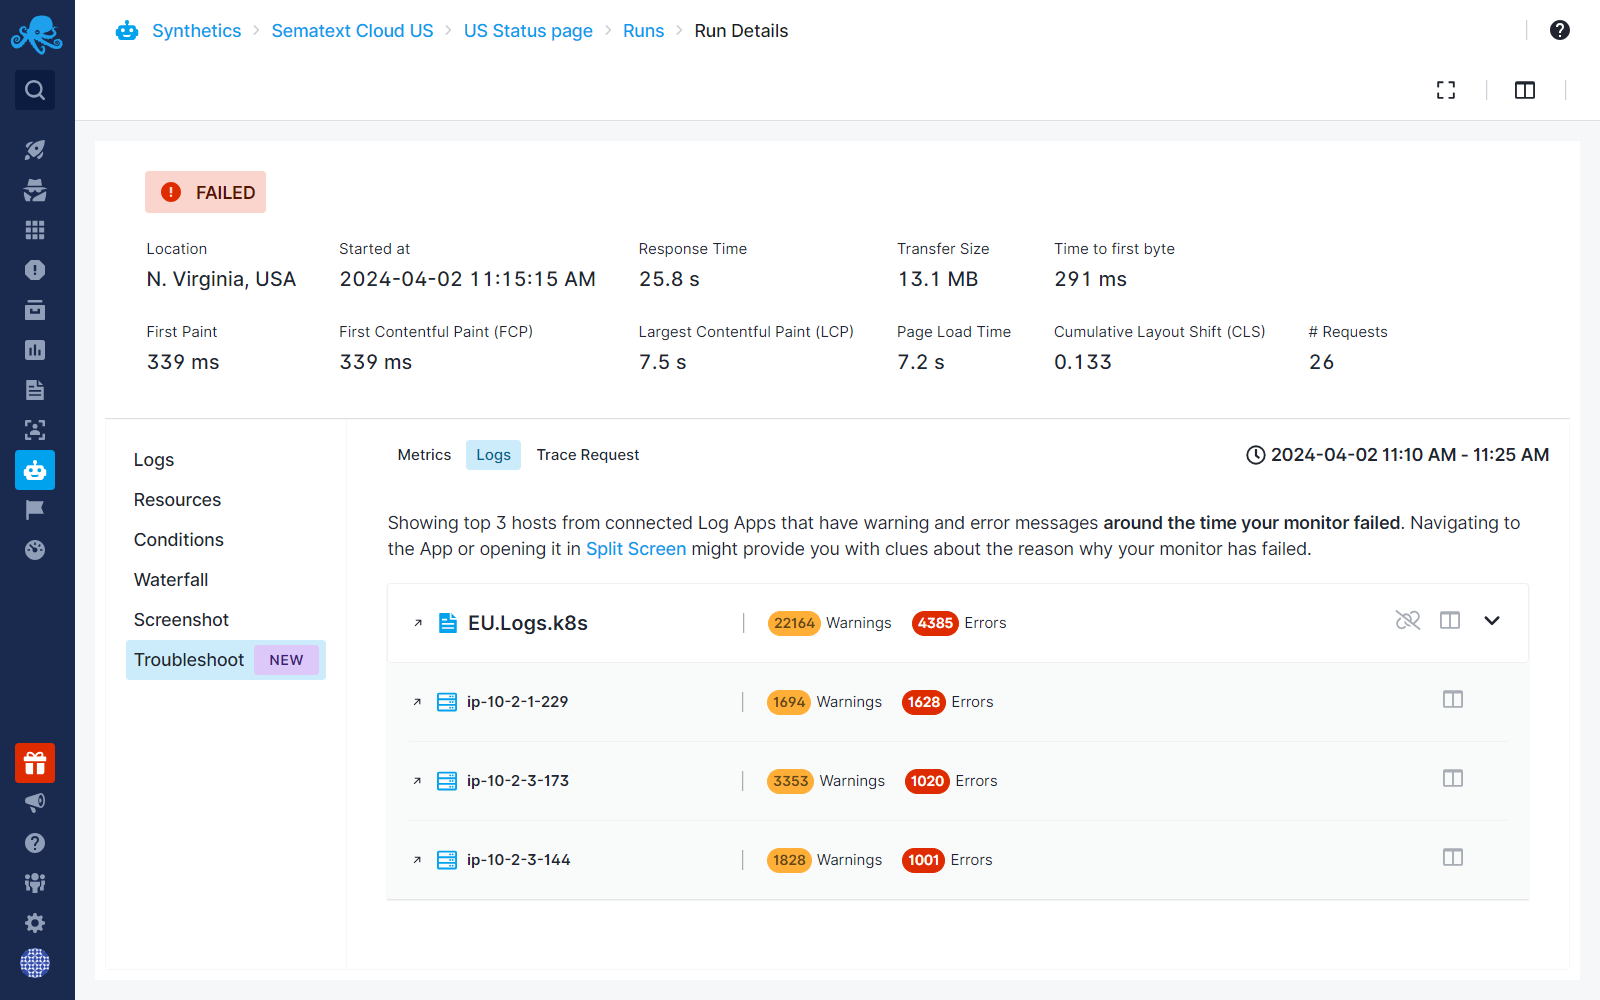
You can analyze logs around the time your monitor failed directly within the same page using Split Screen. Alternatively, you can open the logs in a new tab to further drill down into the root cause of your endpoint failures.
In the image below, our monitor has failed. The monitored endpoint is a service that runs in a Kubernetes cluster. We are shipping logs from that cluster into a logs App called EU.Logs.k8s, which is connected to our Synthetics App. We navigate to the Troubleshoot tab, where we can see the number of error and warning logs from the Kubernetes cluster from 5 minutes before and after the time our monitor failed.
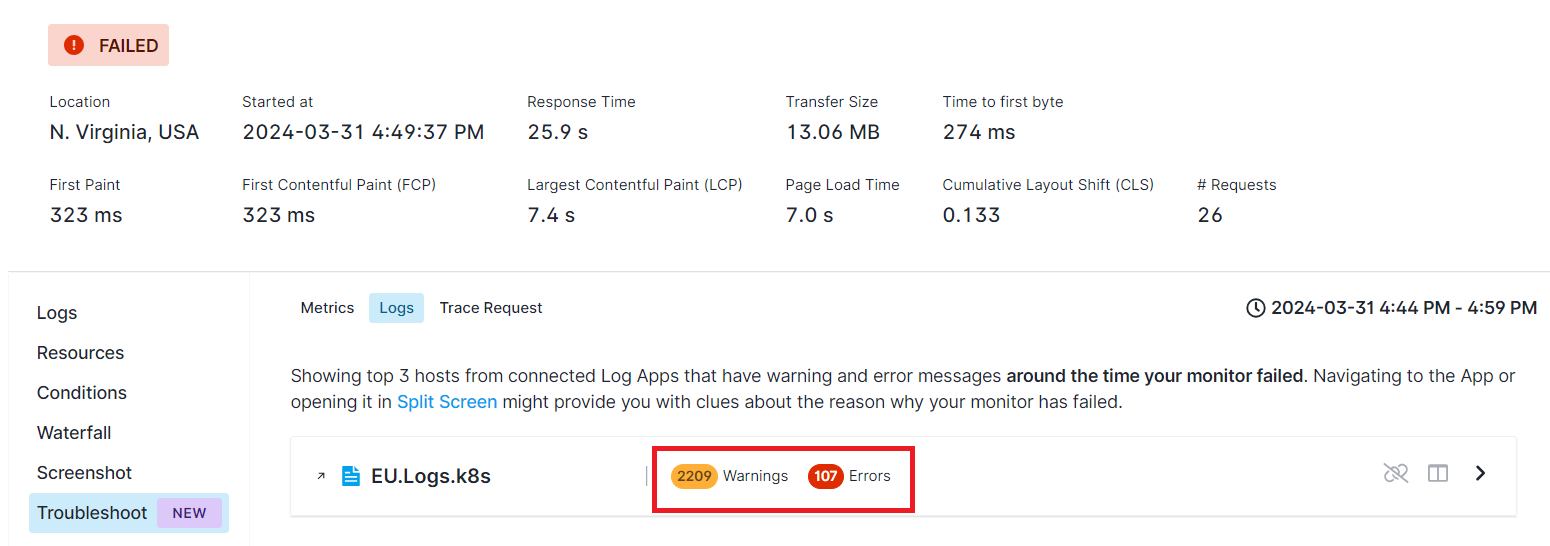
Then, we open the Logs App either in a new tab by clicking on the App name or within the same screen using the Split Screen button.
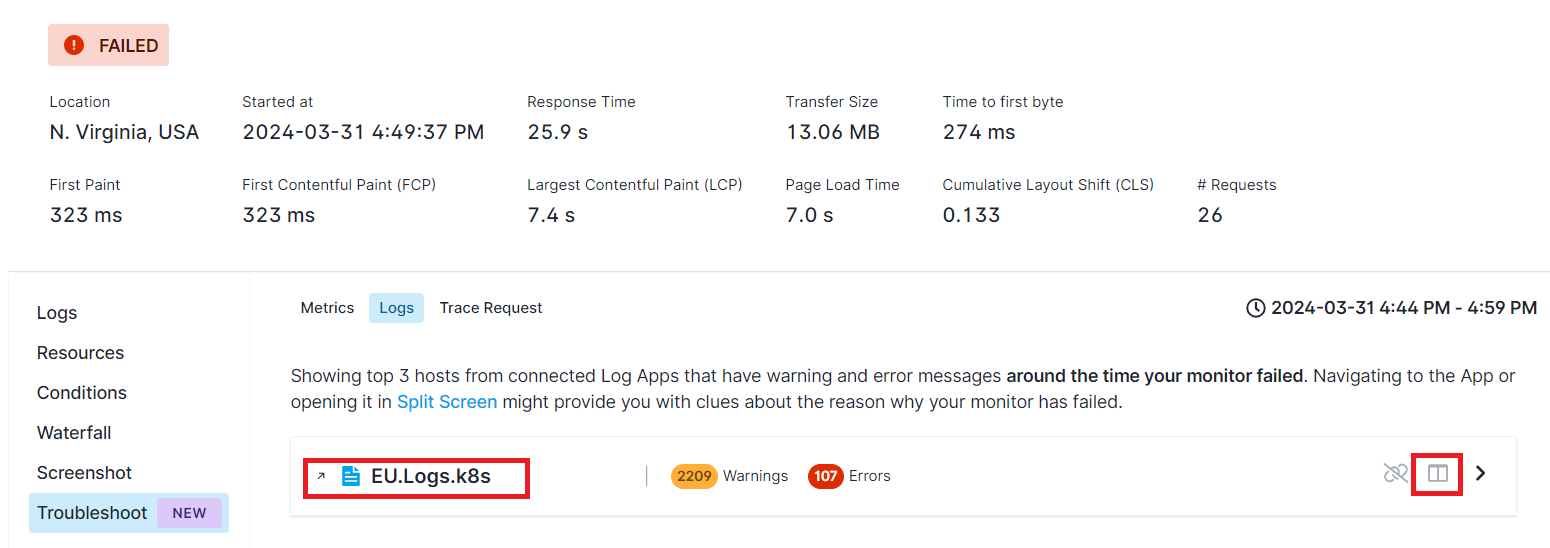
Automatic filters are applied to display only warning and error logs around the time our monitor failed. In this particular example We can add a filter to view logs exclusively from the pods that run our service endpoint.
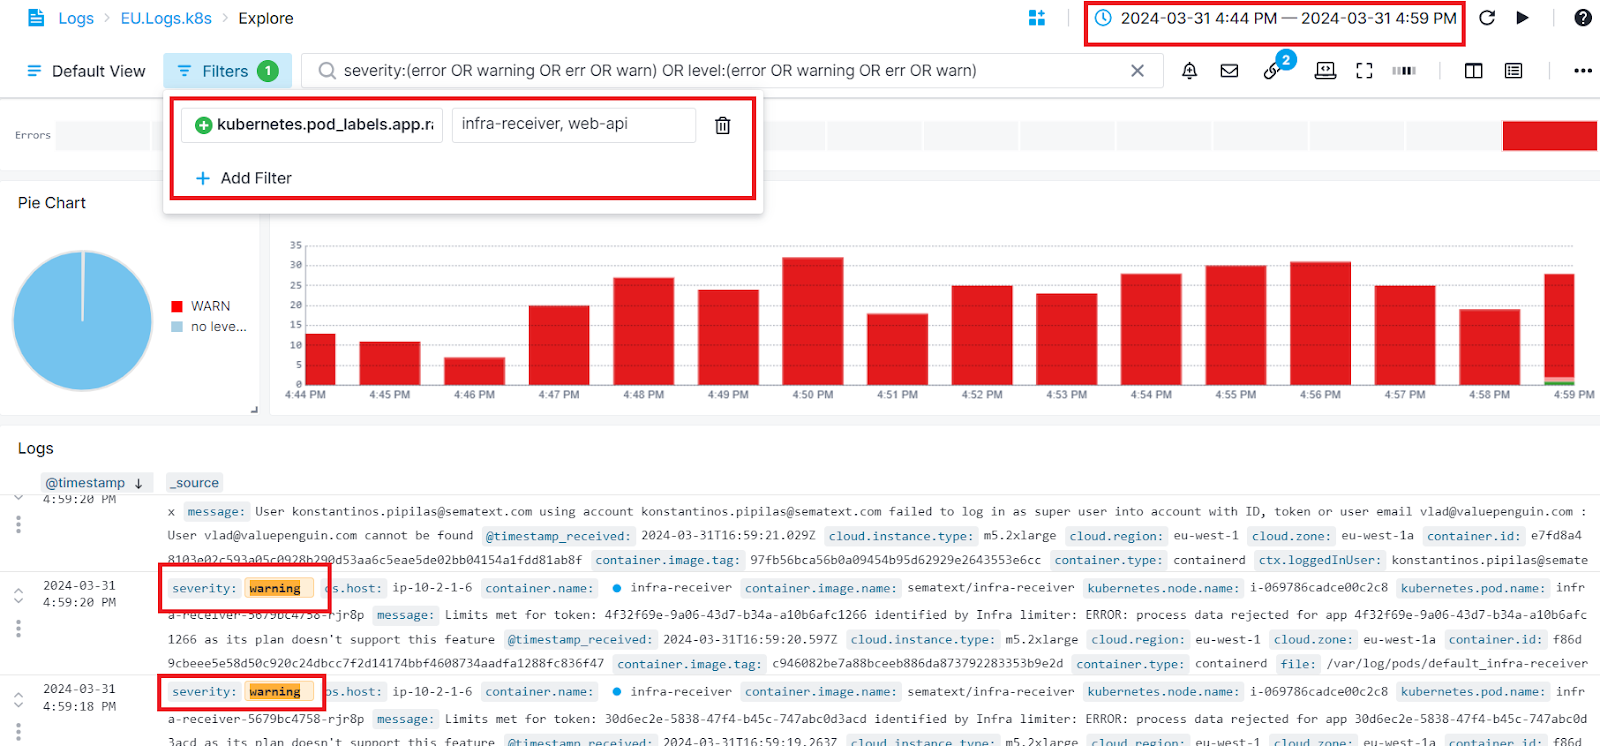
From there we can look at log events and potentially find the backend issue that is a likely cause of the monitor failure.
You can also use the Context View when troubleshooting your failed monitor runs' application logs. The Context View lets you see logs from before and after an individual log, which helps you understand the sequence of events leading up to and following the failed endpoint request.