Overview
Sematext Application and Infrastructure Monitoring, with over 100 integrations, allows you to collect an extensive set of events and thousands of metrics across your entire stack.
Get started in minutes with out-of-the-box dashboards that include prebuilt charts and other numeric components for the most notable metrics. Get notified with automatic alerts powered by anomaly detection rules, and ability to analyze metrics by a number of context-aware filters.
Application and Service Monitoring
No matter how complex your infrastructure is, you can benefit from service autodiscovery functionality and get all the important metrics from your applications and services easily and quickly. Simply choose one of the available monitoring integrations and monitor performance and health metrics for all your applications.
Get dedicated dashboards and reports for each application to extract the most value from the metrics we track. Useful tips are presented alongside the charts and other report components. Of course, if you prefer to be notified of important events, we have you covered with automatic alert rules. Read more in the Application Monitoring Overview.
Infrastructure Monitoring
Monitor your core infrastructure in minutes, simply install Sematext Agent. Get performance and health metrics from a single (Infra) Monitoring App. Keep an eye on everything, from servers and Kubernetes clusters to cloud instances, containers, processes, inventory, events, and beyond. Read more in the Infrastructure Monitoring Overview.
Sematext Monitoring goes beyond just collecting metrics.
Use Database Monitoring to get a complete overview of your database health whether you are running it on your own infrastructure or using AWS RDS.
Transaction Tracing will show slow database operations, full SQL statements, end-to-end HTTP transaction context, top 10 operations by throughput, latency, or time consumed, filter database operations, and much more...
You can create custom dashboards with real-time data that helps you understand important trends, summarize top values and view the frequency of conditions.
And you can additionally send any kind of custom metrics.
If you haven't signed up for free yet, check it out or sign in to get started by creating a Sematext Monitoring App with a wide selection of integrations to choose from.
Creating Monitoring Apps
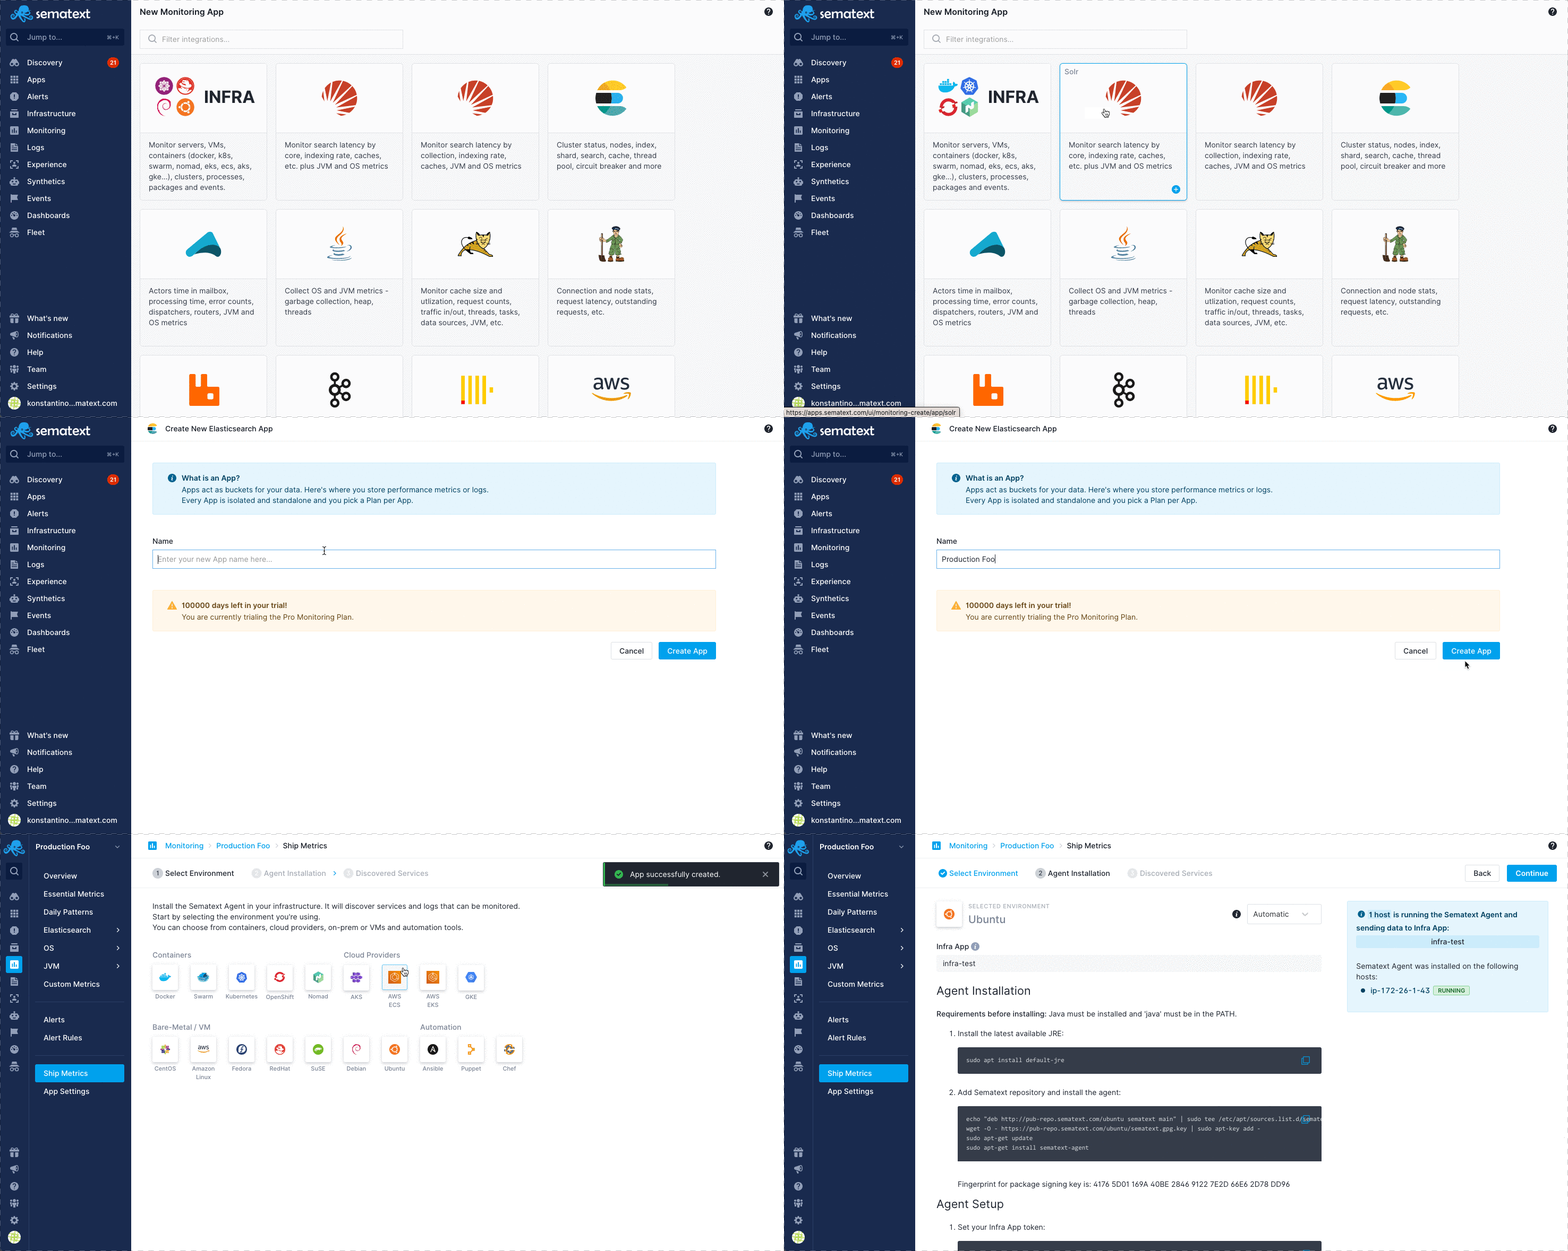
The first step to monitoring with Sematext is to create a Monitoring App. Go to monitoring view, click on New Monitoring App button, select your integration and create monitoring App.
Follow along the Quick Start guide to learn how.

App Settings
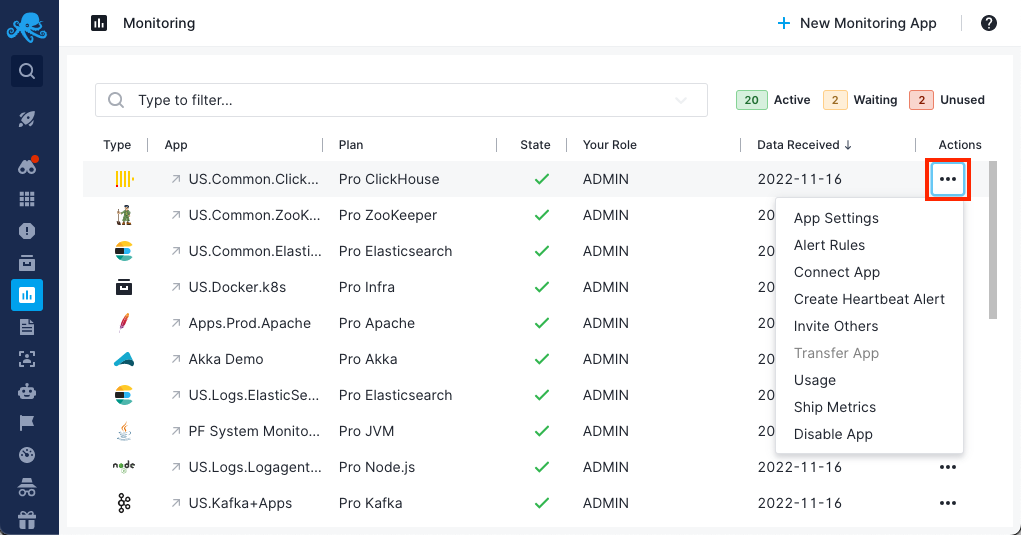
App settings and actions include, but are not limited to:
- changing your App's plan
- managing alert rules
- connecting Apps
- heartbeat alert creation
- inviting others to your App
- App ownership transfer
- setting up a Sematext Monitoring Agent to ship metrics
- scheduled report emails


Check out the Settings guide to learn more.
Reports And Components
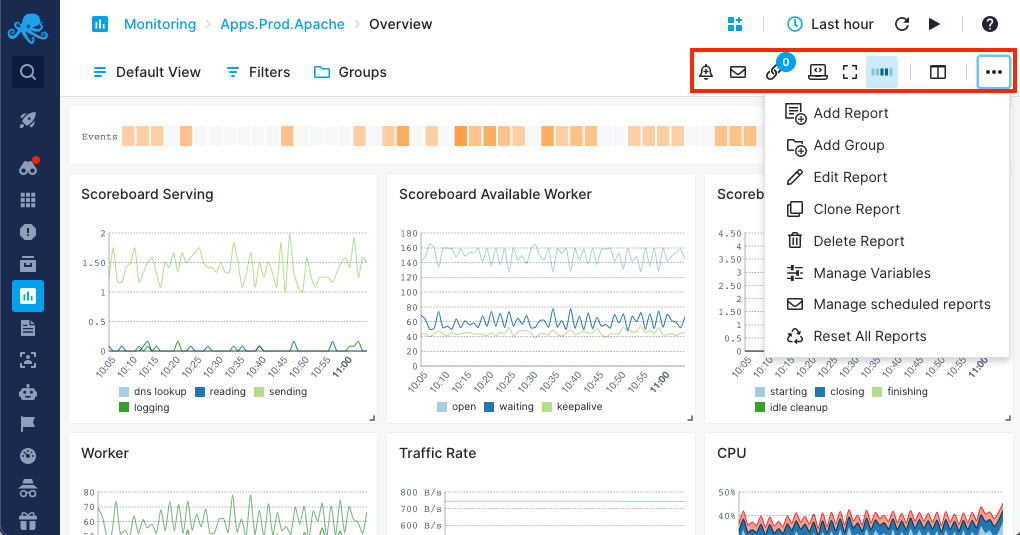
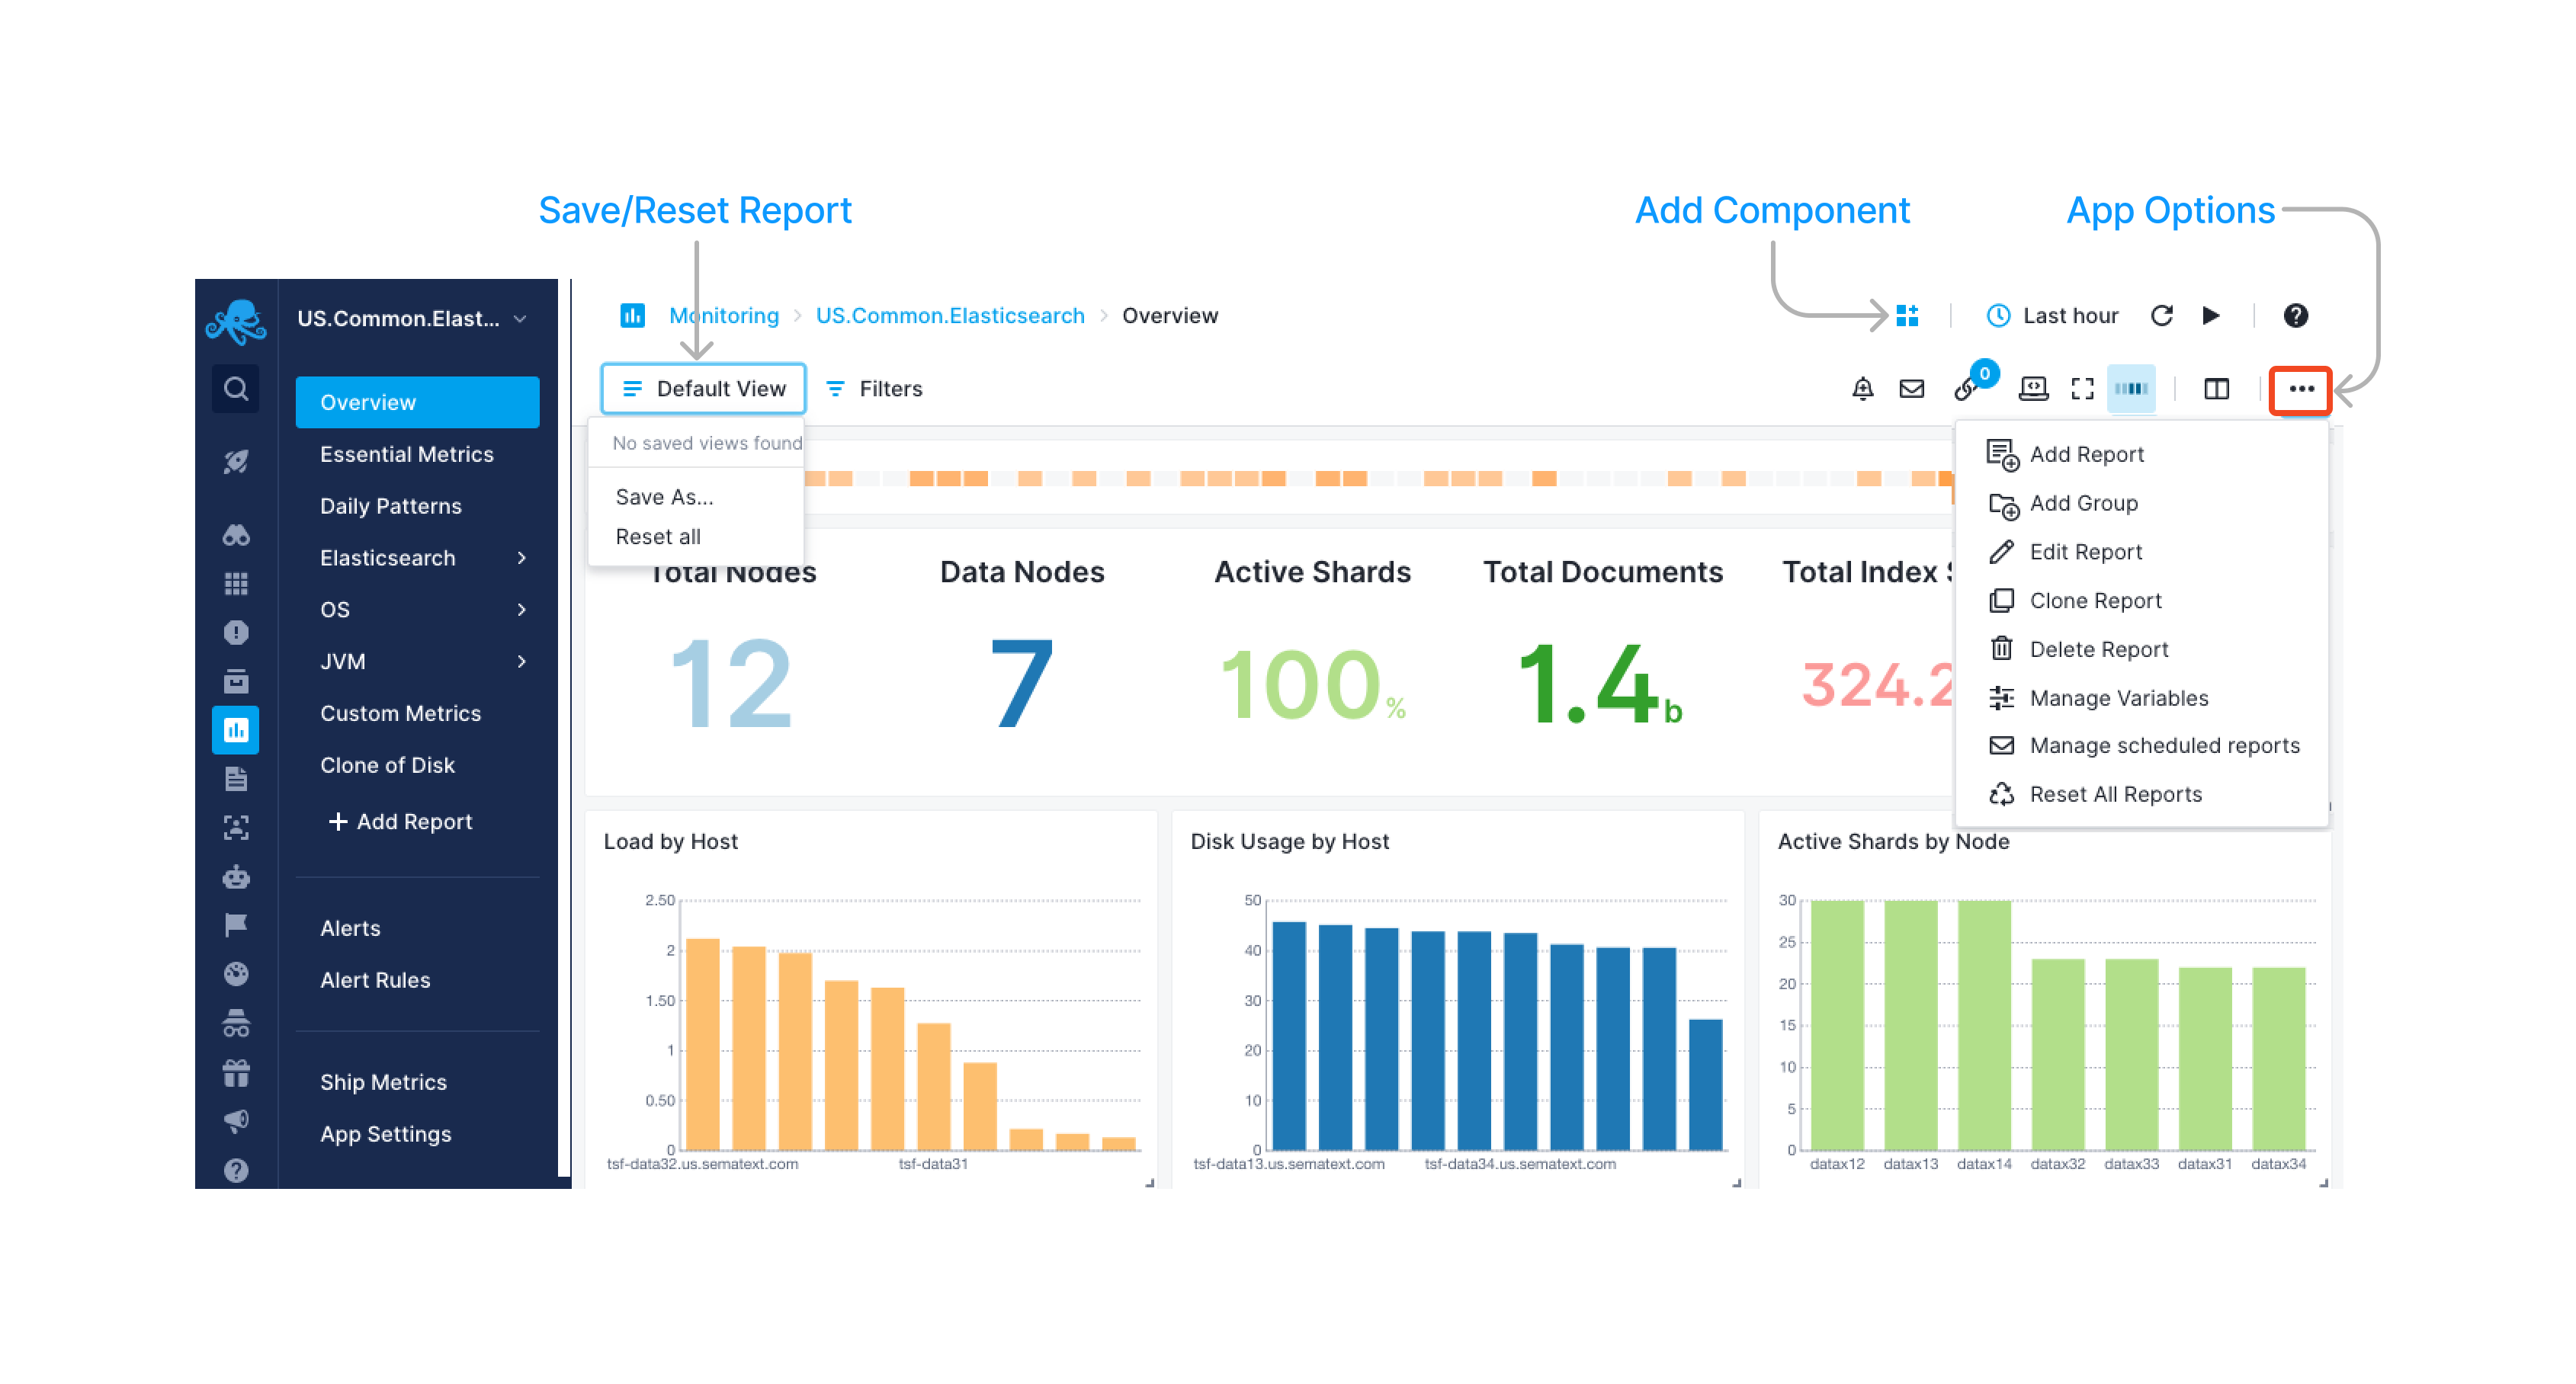
Every Monitoring App can have multiple Reports that act as buckets for your metrics and data. The distinct metrics in one report are separated into components.
Read more in the Reports and Components guide.

Additional Features
To help you manage your metrics, hosts, and containers, and to help you create more useful dashboards, you can assign metadata to each host/server/container in the form of tags.
Check the Tags page for different ways to use tags.
You can create custom dashboards with real-time data that helps you understand important trends, summarize top values and view the frequency of conditions.
Getting Support
We hope you enjoy using Sematext App and Infrastructure Monitoring and Log Management tools. If you need further support or have any feedback regarding our products, please don't hesitate to contact us! You can also contact / talk to us using chat widget at the bottom right corner of the page or give us a shout @Sematext.