FAQ
General
How many logs can I store?
There is no limit to how many logs you can store in your Logs App. That said, you should try to pick the ideal Daily Volume when picking your plan, as that is going to give you the most optimal $/GB price.
If you pick too small Daily Volume and often go over the selected volume your $/GB price will be higher than if you picked the next higher Daily Volume.
How many fields can my log events have?
A single Logs App allows up to 1000 fields. Most of the time you will want to pay attention to how you structure your logs in order to get the most value out of them, and that typically includes having a manageable number of fields in your logs.
We are getting "Too many fields present in the index". What does that mean and how can we fix it?
This means you have more than the allowed number of distinct fields in your Logs App. To manually remove some fields use the Field Editor, but if you continue shipping logs with fields you've removed via Field Editor those fields will be recreated.
To prevent unwanted fields to be created you can exclude them with Logs Pipelines.
- You can use Drop Processor to drop unwanted log events that match a specific condition.
- You can use Remove Fields Processor to drop nested fields that contain redundant data.
- You have many different deeply nested fields (e.g. foo.bar.bar, foo.bar.bam, etc.), perhaps because you log "objects" with attributes. Often times you don't want all attributes to turn into individual fields. You can use Rename Fields Processor to extract useful information from a nested field and then use Remove Fields Processor to drop the nested field.
See Pipeline Processsors for more info.
If you have a high number of different types of log events with different sets of fields, maybe from different sources. You may want to consider using multiple Logs Apps in such cases.
What is @timestamp field?
@timestamp is a date field that is used to filter logs by a selected time. If a log event does not have such a field defined,
we will add it and set it to the time when we first receieved the log event.
How can I check how many GB/day I am shipping to your centralized logging management solution?
From the application, click the App Actions button and select
Usage. There's also Settings button next to any of your Logs apps in
the Logs > All Logs Apps section in our centralized logging and monitoring management solution.

On click, App Settings > Usage page will present both Total Volume in Gb and Total Count of indexed logs for that particular Logs App.

How can I check the number of logs I currently have in a Logs App?
Total Count of indexed logs is displayed in App Settings > Usage page.
The number of logs will be also displayed in the right corner of the Log Counts panel just below the App's search input. It will change as you perform search queries, change time and apply filters in your Logs App.

How long are my logs stored?
How long your logs are stored depends on what Data Retention you selected when you picked your Logging Management App plan. Each such App can have a different Daily Retention, Daily Volume, and plan. You can change retention, volume, and plan at any time.
Click the App Actions button and select App Settings. App Info page will open where you can see and change Daily Retention, Daily Volume, and Plan for that particular Logs App.

Can I send old logs?
Yes, you can send all logs. However, keep in mind your Logs App's Data Retention settings. For example, if your retention is set to 7 days and you send logs that are 10 days old, we will give you a warning saying that you are outside of your valid retention time range.
How can I send old logs?
Use Logagent. With Logagent you can then do: cat
/path/to/old/log | logagent -t YOUR_LOGSENE_APP_TOKEN
What is data retention and how does it work?
Data retention mechanism is responsible for removing old log events. If you have retention set to 7 days, all log events that are received more than 7 days ago will be removed.
How long is my data stored?
This depends on the data retention you selected for each of your logging Apps. Backups are stored in S3 and kept for 90 days.
How do I configure archiving for my Logs?
Please see Log Archiving
Is data retention based on index/import/upload/receive time or the actual log event @timestamp?
Data retention is based on log events' receive timestamp.
Are logs shipped to Logs App ever rejected?
When you pick a Selected Daily Volume we automatically set another Logs App setting called Daily Volume Limit. By default we set it to 2x the Selected Daily Volume. When this Daily Volume Limit is reached, your Logs App will stop accepting new logs until the next day (00:00 UTC). In other words, you can go over Selected Daily Volume, but the Daily Volume Limit is a hard limit. You can change the Daily Volume Limit at any time and can set it to any value greater or equal to Selected Daily Volume.
This Daily Volume Limit prevents run-away logging from causing over-billing. Logs App will send email notifications before this limit is reached, so if you need to temporarily increase it, you can do that without losing any logs.
How does Sematext calculate daily log volume when I ship historical data?
We calculate daily log volume based on the time we receive your logs, not on the timestamps in your log data.
Each log event typically includes a @timestamp field, which represents when the event actually occurred. However, when we calculate daily log volume and apply your plan’s daily volume limit, we use the @timestamp_received field, which is the time when Sematext Cloud receives your data.
This means that if you send a month’s worth of historical logs in a single day, even though the logs have @timestamp values spread across different days, all that data will count toward the daily log volume for the day it was received.
What is the maximum log size Logs App will accept?
That depends on the plan you selected for your application. If your application is using the Basic plan, our logging management platform will accept logs up to 64 KB in size. If your application is using the Standard plan, it will allow logs up to 128 KB. If your application is using the Pro plan, it will accept logs up to 256 KB in size. If your logs are larger than the mentioned limits, please reach out to us for a custom plan.
My logs have special structure. Can Logs App handle that?
Yes, if the default log index fields (also known as index mapping) don't fit your needs you can create completely custom index mapping. See Custom Mapping Template How-To.
I have multiple log sources - should I send them all to the same Logs App?
Sending logs from multiple log sources to the same Logs App is not a problem at all. However, if you have multiple different log structures (different "fields" in the logs), see the next FAQ entry.
I have multiple different log structures, each with a different set of fields. How should I handle that?
If you have N different log structures, the best way to handle that is by creating N Logs Apps, each with its own index mapping. For example, you may have web server logs, your system logs in /var/log/messages, and your custom application logs. Each of these 3 types of logs has a different structure.
The web server logs probably use Apache Common Log format, the logs in /var/log/messages have syslog structure, and your own application's logs can be in any format your application happens to use. To handle all 3 log formats elegantly simply create 3 separate Logs Apps and use a different format for each of them.
If you want to be able to search all logs together, even when they have different fields, you can do that - just ship them all to the same Logs App. The thing to watch out for are fields that have the same name, but different data type. For example, if one log source has a purely numeric field "size" and another log source also has a field "size", but can have non-numeric values, this will cause issues.
Thus, either keep logs of different structures in separate logging App or make sure there are no conflicting fields.
My data structure changed, can I reindex my data automatically?
Yes, when you change your index structure using Field Editor you will be given the opportunity to reindex your data.

Please keep in mind that the speed of reindexing depends on how much data needs to be reindexed and that reindexing is treated like original ingestion, which means it counts towards your daily volume and could result in you hitting your Max Daily Volume Limit.
Is automatic reindex free?
Using Sematext's Logs App reindex functionality is available for all plans and the normal plan charges apply. Because reindexing counts just like the original data ingestion, before reindexing the estimated cost of reindexing is shown in the UI.
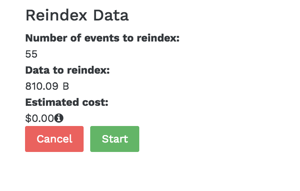
If the amount of data ingested for the day, plus data to be reindexed is smaller than your Max Daily Log Volume Limit then no additional charges will be applied.
Audit-proof logging
Sematext Cloud Logs supports audit-proof logging by automatically including the timestamp of the log event along with the original log event that was sent to the platform. Each log event can be retrieved in the form it was sent to Sematext Cloud using the logs export functionality, via the Sematext API or using the UI:

It is also possible to store the log events in external, S3 compatible storage via the logs archiving functionality.
Log Shipping
Which log shippers, logging libraries, and platform integrations are supported?
You can use numerous log shippers, logging libraries, and platform integrations.
How can I import logs from my existing Elasticsearch / ELK / Elastic stack?
You can use Logstash to copy logs from your own ELK / Elastic Stack to our Logs App as described at Elastic Stack Import-Export with Logstash & Logsene.
How can I ship logs from Android and iOS Apps?
For shipping logs from Android Apps use https://github.com/sematext/sematext-logsene-android and for shipping logs from iOS Apps use https://github.com/sematext/sematext-logsene-ios.
How can I ship AWS CloudTrail logs, AWS VPC logs, and other logs from S3?
Use the https://github.com/sematext/logsene-aws-lambda-cloudwatch AWS Lambda function. See Forwarding CloudTrail or Other Logs from AWS S3 to Logsene and Sending AWS Cloudwatch Logs to Logsene for detailed description of how to do this.
Can I ship logs from my frontend?
Yes, you can use logsene-js for that, but use a write-only token for your Logs App. Using a write-only token ensures that even though your token will be visible in the page source, one won't be able to use it to retrieve/search/get your logs. Tokens can be created and revoked in Logs App settings.
Why is it that I can forward logs with rsyslog via TCP or UDP, but not via RELP?
You probably need to install the omrelp module first. If you have rsyslog installed in your system, there's probably a package that you can install:
For RedHat and CentOS:
For Debian and Ubuntu:
For SUSE and OpenSUSE:
If you compiled rsyslog manually, you need to supply --enable-relp
to the configure script. You can check if rsyslog starts properly by
starting it in foreground:
You will get an error if the module is not found or you have any other
problem. For debug mode, add -d as
well.
How do I ship exception stack traces and other multi-line logs with Logstash without breaking them into multiple log events?
Please see Handling Stack Traces with Logstash.
Plans & Prices
How much does your centralized logging management solution cost?
Check the Logs App Plans & Prices.
What happens with my logs when I downgrade an App?
You don't have to worry about your data when you downgrade an App. Your logs will remain safe and you can still be able to search them. Your data will remain accessible based on your data retention settings. However, when you downgrade an App data retention restrictions will be applied to your data based on the selected plan.
What happens if I go over the selected daily log volume and how much does that cost?
The GB/day volume is not a limit. That number controls only cost per GB. When you go over the GB/day number you had selected we do not reject your data (for protection, use Max Daily Volume). Instead, we keep track of how much data over the selected daily volume was shipped and add that to the monthly cost using the $/GB rate for the selected daily volume.
The higher daily volume you select, the lower the per GB price. For example, if you picked 1 GB/day and you typically don't go over it, or go over very little, then it pays to keep that 1 GB/day selection. However, if you ship closer to 5 GB/day, then you should select 5 GB/day volume, because that will give you a lower $/GB rate than if you stay with 1 GB/day selection.
How much data can I ship to Sematext using the Basic plan?
Each day, a total of 500 MB/day can be shipped to all Sematext Logs Apps together. To ship more data use one of the bigger plans.
Troubleshooting
Why am I not seeing my logs?
The most common reason is that logs' timestamps are in the future, and this most often happens when timestamps don't specify the timezone. For example, if you are east of UTC (e.g. in +0100 – 1 hour ahead of UTC) and you send logs with timestamps in your local time, but without specifying your local timezone, like this: 2016-01-30T14:00:00.000Z – this timestamp actually represents 14:00 in UTC. However, if it 14:00 in your timezone, which is 1 hour ahead of UTC, that means that 14:00 UTC is actually 1 hours in the future.
Currently, our Logs App does not display logs that have timestamps in the future, but it does accept them, and shows them when those timestamps stop being in the future.
Another possibility why you are not seeing your logs is that their structure clashes with the structure of your existing logs in the same Logs App. For example, if you have sent logs with field "priority" as integer field then Sematext's Logging Platform will expect all future values of "priority" field to be integers.
Sending a string value in a "priority" field will fail. Note that you can change the underlying field "mapping" at any time - see elsewhere in this FAQ.
If none of the above turns out to be a problem in your case, please let us know via support@sematext.com or via our live chat!
Why are logs from some hosts missing for my Logs App?
Missing logs might be caused by:
- The Sematext Agent not monitoring the log files for the service on specific hosts.
- Connectivity issues between the host and Sematext Cloud
Open the Infrastructure group in your Logs App and access the Hosts report to identify all hosts running the service. Click on a specific host and review the Agent tab to verify that all the agents are running without issues.
How can I use the Infrastructure group to improve troubleshooting for my services?
The Infrastructure group inside each Logs App provides a holistic view of your environment:
- The Hosts report helps identify which hosts are involved with a service.
- The Processes report offers detailed insights into the processes running in the above hosts.
I've deleted all my Apps and created new ones, but now I'm not seeing my logs
If you've deleted all your Logs and Infra Apps, created new ones, and you can't see your logs, it is suggested to restart the Sematext Agent as described in the Agent starting / stopping instructions.
How to check if there are any network connectivity issues?
Things to check to ensure network connectivity is OK:
- Try to connect to logsene-receiver.sematext.com / logsene-receiver.eu.sematext.com (port 80 or 443) with the following command:
or if you are using syslog, connect to logsene-syslog-receiver.sematext.com / logsene-syslog-receiver.eu.sematext.com (port 514 for TCP and UDP, port 20514 for RELP, port 10514 for TLS):
The output should show something like: Connection to logsene-receiver.sematext.com 443 port [tcp/https] succeeded!
In case you see some other result:
- if your server requires proxy to access the Internet, you'll have to adjust your log shipper config to use proxy settings
- if firewall is used to protect your server, it may be blocking outbound traffic from it. Depending on which receiver and protocol you are using, please ensure with your IT/network admins that right ports are open for outbound traffic
-
check your DNS (see below)
-
Check if your DNS has correct entries for Logs App Receiver:
The output of these commands should look like this, although the IP addresses and names may be somewhat different, as they change periodically:
Server:        127.0.1.1
Address:    127.0.1.1#53

Non-authoritative answer:
logsene-receiver.sematext.com    canonical name = VPC-Logsene-Token-Receiver-LB-188765535.us-east-1.elb.amazonaws.com.
Name:    VPC-Logsene-Token-Receiver-LB-188765535.us-east-1.elb.amazonaws.com
Address: 52.54.165.65
Name:    VPC-Logsene-Token-Receiver-LB-188765535.us-east-1.elb.amazonaws.com
Address: 34.196.180.172
Or, if you are using syslog, try:
The output should be similar to:
Server:        127.0.1.1
Address:    127.0.1.1#53

Non-authoritative answer:
logsene-syslog-receiver.sematext.com    canonical name = ec2-52-44-248-43.compute-1.amazonaws.com.
Name:    ec2-52-44-248-43.compute-1.amazonaws.com
Address: 52.44.248.43
How to avoid 'failed events'?
Sematext Cloud is a schema-less storage and uses OpenSearch as log storage.
When your App receives new log lines, containing unknown fields, those fields are automatically created with the data type of the field value (string, number, object).
So you don't need to specify a schema (called 'mapping' in OpenSearch) upfront.
When you ship logs (OpenSearch document) with the same field name and different types (string, number, object) an error called mapper_parsing_exception happens in OpenSearch. This means the document can't be indexed because of a mismatch in the data schema.
Sematext Cloud catches this error and produces a failed event entry in your Logs App.
The failed event entry contains the error message and the original document as JSON string in the field logsene_orig_log.
You can resolve the problem with the mapper_parsing_exception with the following procedure:
1) Check the logsene_error message, it contains details which field caused the conflict
2) Make sure that the fields use only one type (not a mix of string, number, object ...)
You could do three different things to avoid schema conflicts: 1) Adjust your log output to match the schema. E.g. rename the fields in your logs. 2) Ship logs with different schema to different Sematext Cloud Log Apps.
Example:
Service A produces a log with a field "detail" with a text message.
Service B produces a log with a field "detail" with a JSON object What could be done in this situation? There are basically two options:1) You could rename the field in the log output of in "Service B" e.g. detail -> detail_object.
The renaming could take place in your Apps logging code, or in a log shipper configuration. Some log shippers have support to rename fields before logs get shipped.
2) You could ship the logs of "Service B" to a separate Logs App (different App token). Create a new Logs App in Sematext UI and configure your log shipper to ship logs from "Service B" to the new Logs App.
Option #2 is probably the simplest way to resolve the issue.
In case you created only one time logs with a wrong structure, you could use the Field Editor to change the schmema/mapping. Please refer to related FAQ section: I have multiple different log structures, each with a different set of fields. How should I handle that
Security
Can I ship data to your centralized logging management solution using a secure and encrypted transport like TLS/SSL or HTTPS?
Yes, all data can be shipped both over encrypted channels like TLS/SSL and HTTPS, or via their unencrypted counter-parts. See https://apps.sematext.com/ui/logs for more information about how to configure log shipping.
How secure is my data?
Our Logging Management Platform runs on Amazon AWS, whose infrastructure follows IT security best practices and adheres to a number of compliance standards such as SOC 1/SSAE, SOC 2, SOC 3,16/ISAE 3402 (formerly SAS 70 Type II), FISMA, DIACAP, FedRAMP, and HIPAA. For more information about AWS security and compliance certifications see: http://aws.amazon.com/security and https://aws.amazon.com/compliance/.
Your data is protected from unauthorized reads. If you want to read data using scripts you can authorize
your API calls using apiKey. You can read more about this here and here.
Where is my data stored?
Logs App runs and stores data in Amazon AWS in the US and the EU. You can choose if you want your account and your data in the US or in the EU.
Timestamps
Why does my syslog timestamp have a different time zone?
The original syslog specification (RFC 3164) has a date field that doesn't contain any time zone information. Fortunately, there's a new specification (RFC 5424) that uses ISO 8601 timestamp. That's why we recommend using the new format for syslog daemons that support it, such as rsyslog or syslog-ng. If you use an older syslogd implementation, or you simply prefer to use the older format, you have two options to have a correct timestamp:
- set the system time on your server to UTC, or
-
change the timestamp for your logs to ISO 8601. For example, rsyslog does it with the default template RSYSLOG_ForwardFormat. For instance, to forward all logs via TCP, with the original specification, but with the ISO timestamp, you'd add the following line to your config:
. @@logsene-syslog-receiver.sematext.com:514;RSYSLOG_ForwardFormat
What are the supported timestamp formats?
If you send your logs via the Sematext API, you can use:
- ISO8601. For example, 2001-06-08T08:00:01.123Z or 2001-06-08T08:00:01+03:00. A timezone must be there after the time (use Z for UTC), so 2001-06-08T08:00:01.123 won't work. You can also send timestamps with just the date (2001-06-08), and we'll count them as occurring at 00:00
- UNIX time in milliseconds, for example 1487854172123. UTC is assumed here, so we recommend setting the system time to UTC if you go this route
If you send your logs via syslog, you can use ISO8601, too (recommended, see the previous question) or the legacy RFC-3164 timestamp (like Oct 11 22:14:15). The legacy format assumes UTC and assumes the current year. It doesn't have sub-second precision, either.
See Supported Date Formats for more examples of supported date and time formats.
What happens if I try to send data with @timestamp older than my retention time?
You can send old logs because our data retention works by checking the received timestamp, not @timestamp. For example, if your retention is set to 7 days and you send logs that are 10 days old (i.e. they contain a timestamp from 10 days ago), they will get accepted and processed, but when you set a time range to select those logs, you might get warning that you selected time range that is outside of your retention.
What happens if I try to send data with @timestamp that is in the future?
You can send logs with timestamps in the future, but they will not be shown in Logs App until their timestamps stops being in the future. For example, if you send logs that are "2 hours ahead of real time" they will be accepted, but will not be displayed until 2 hours later.
What happens if I send data with non-supported @timestamp format?
If your log events are sent to Sematext Cloud with a format that is not supported in our platform the @timestamp field value will be set to the current date and time using the UTC timezone.
See Supported Date Formats for more examples of supported date and time formats.
Alerts
What are Logs App Alerts?
Logs App alerts are based on full text search queries and filters. They trigger alert notifications when the query and filters meet a certain threshold condition in your logs - e.g. less than N matches in 5 minutes, more than M matches in 3 minutes, etc., or when search query detects sudden changes in the number/volume of matching logs - i.e., anomalies.
How to create Alerts in Logs App?
Alerts are added by clicking the bell icon located next to the Logs App input field. Here you enter query info. The alerts panel will expand and allow you to customize alert specific to that particular search query. Read more
How to view Alert Rules?
Click on the Alert Icon located in the left navigation and then select Alert Rules.

What is the difference between threshold-based Alerts and Anomaly Detection (aka Algolerts)?
If you have a clear idea about how many logs should be matching a given Alert Query, then simply use threshold-based Alerts. In other words, if you know that you always have some ERROR-level log events, you may want to use threshold-based alerts for that.
For example, if your logs typically have < 100 ERROR-level messages per minute you may want to create an Alert Query that matches ERROR log events and notifies you when there are more than 100 such matches in 1 minute.
If you do not have a sense of how many matches a given Alert Query matches on a regular bases, but you want to watch out for sudden changes in volume, whether dips or spikes, use Algolerts (Anomaly Detection-based Alerts).
An extreme example that you may actually like is an Alert Query that matches all logs - "*" - a single wildcard character for a query. If you use that for an Algolert then Logs App will notify you when the overall volume of your logs suddenly changes, which may be a signal that you should look for what suddenly increased logging (e.g. maybe something started logging lots of errors, exceptions, timeouts, or some such), or why logging volume suddenly dropped (e.g. maybe some of your server(s) or App(s) stopped working and sending logs).
Can I send Alerts to Slack, PagerDuty, Nagios, or other WebHooks and ChatOps services?
Yes. Our centralized logging management solution lets one configure arbitrary WebHooks to call with Alert event information when Alert events are triggered. See alerts FAQ for more info.