Creating a Tracing App
This guide walks you through the complete Tracing App creation process in Sematext Cloud, from initial setup through agent installation and application instrumentation.
What is a Tracing App? In Sematext, an App is a container for your data. A Tracing App specifically collects and stores distributed traces from your applications, providing a dedicated space to analyze performance, errors, and dependencies. Each App is isolated and can have its own access controls, retention settings, and alert configurations.
Prerequisites
- A Sematext Cloud account (sign up free)
- Access to your application's deployment configuration (auto-instrumentation requires no code changes) or source code (for manual instrumentation)
- Ability to install the Sematext Agent (installation guide) with OpenTelemetry support
Complete App Creation Flow
Step 1: Create Your Tracing App
1.1 Navigate to App Creation:
- Log in to Sematext Cloud
- Click "Create App" or "Create New Tracing App" in the main navigation
- Select "Tracing" as the App type
1.2 Name Your App:
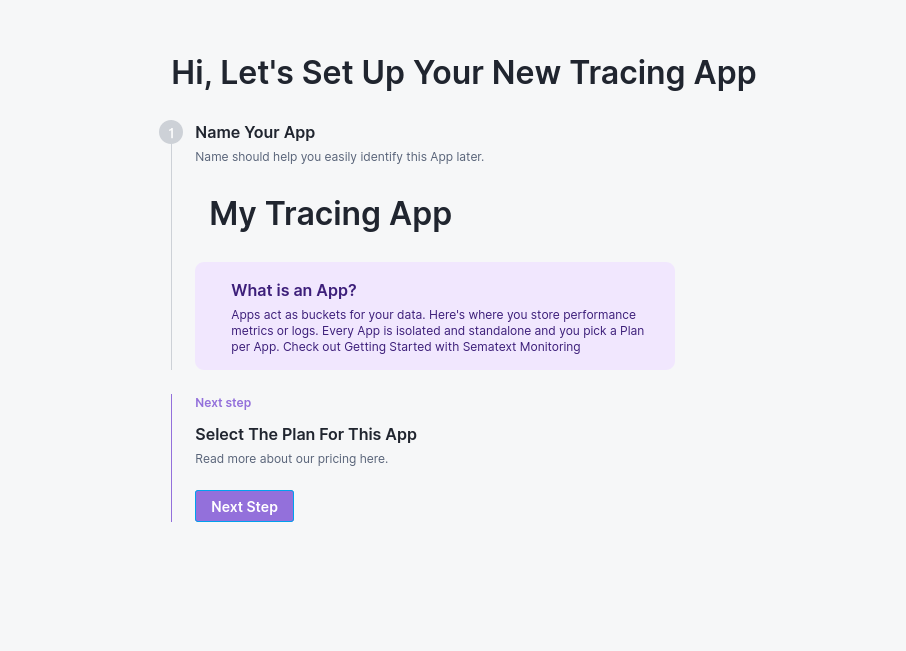
Enter a descriptive name for your Tracing App. Use names that reflect your service or environment (e.g., "production-api", "user-service", "payment-gateway").
Step 2: Select Plan and Infra App
2.1 Plan Selection:
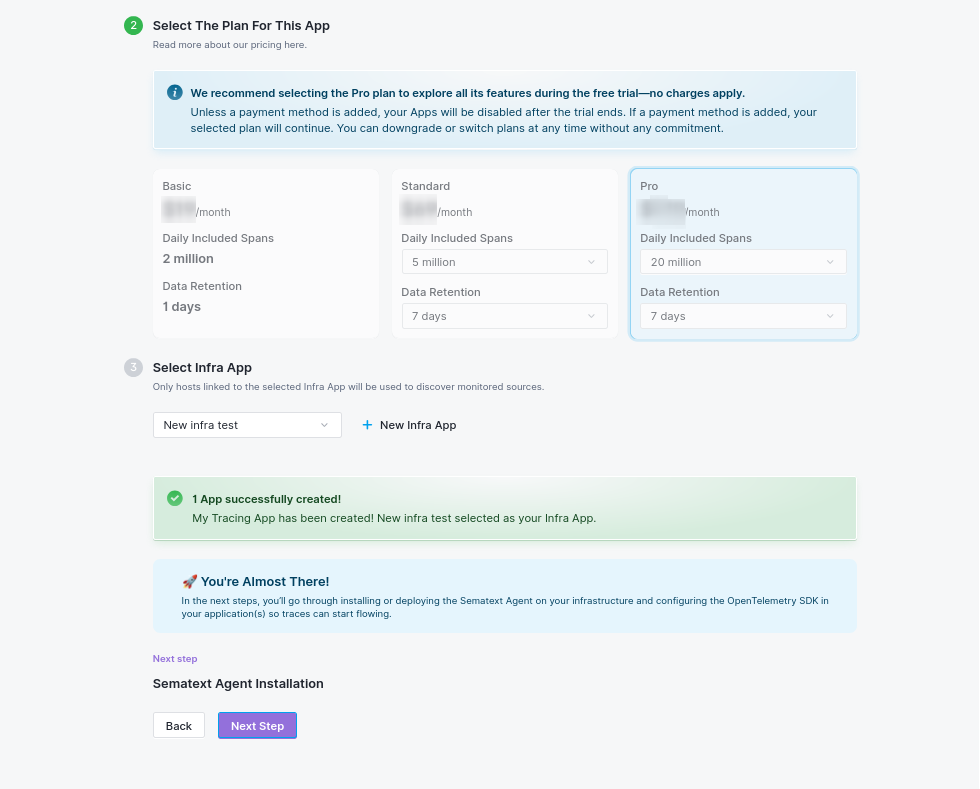
Choose your plan based on your needs, see detailed features and pricing at sematext.com/pricing.
2.2 Select Infra App:
- Select an existing Infra App from your available Apps, or
- Create a new Infra App (click "+ New Infra App")
- The Infra App is required for agent communication and infrastructure monitoring
Once configured, your Tracing App will be created and you'll see a success message.
Step 3: Install and Configure Sematext Agent
After App creation, the wizard continues with agent installation. The agent must be installed before you can receive traces.
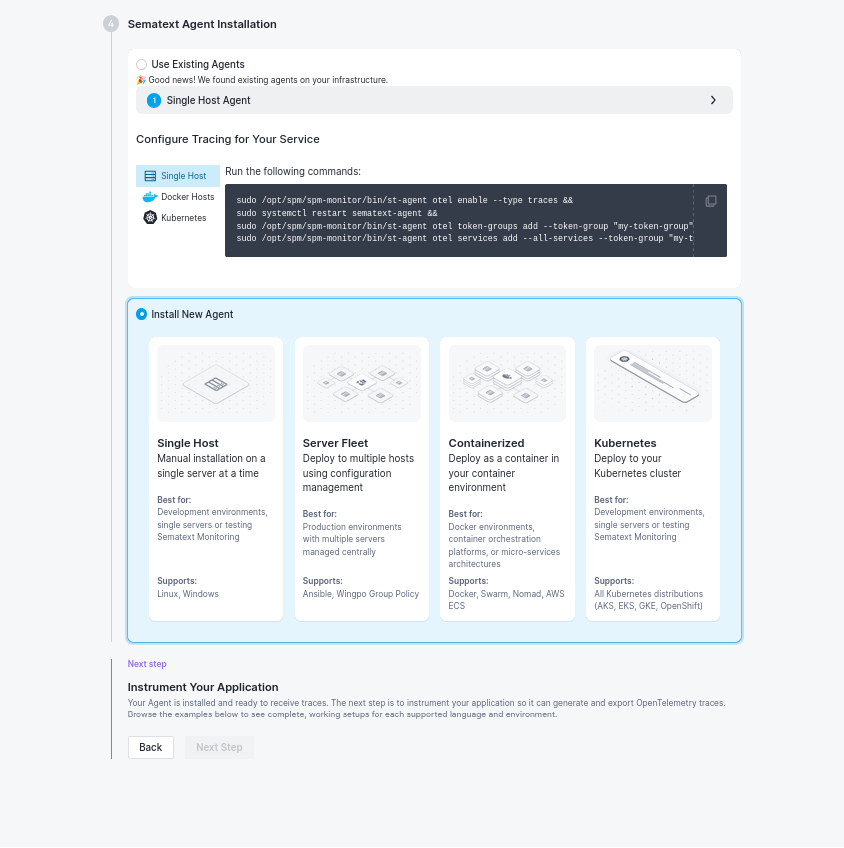
3.1 Use Existing Agent (if available):
If you already have Sematext Agent installed on your infrastructure, it will be detected and you can configure it for tracing by running the displayed commands.
3.2 Install New Agent:
Choose your deployment method:
Single Host
- Best for: Development environments, single servers, or testing
- Platforms: Linux, Windows
- Installation: Command-line or GUI installer (Windows)
Server Fleet
- Best for: Production environments with multiple servers managed centrally
- Management: Ansible, Windows Group Policy
- Approach: Configuration management for multiple hosts
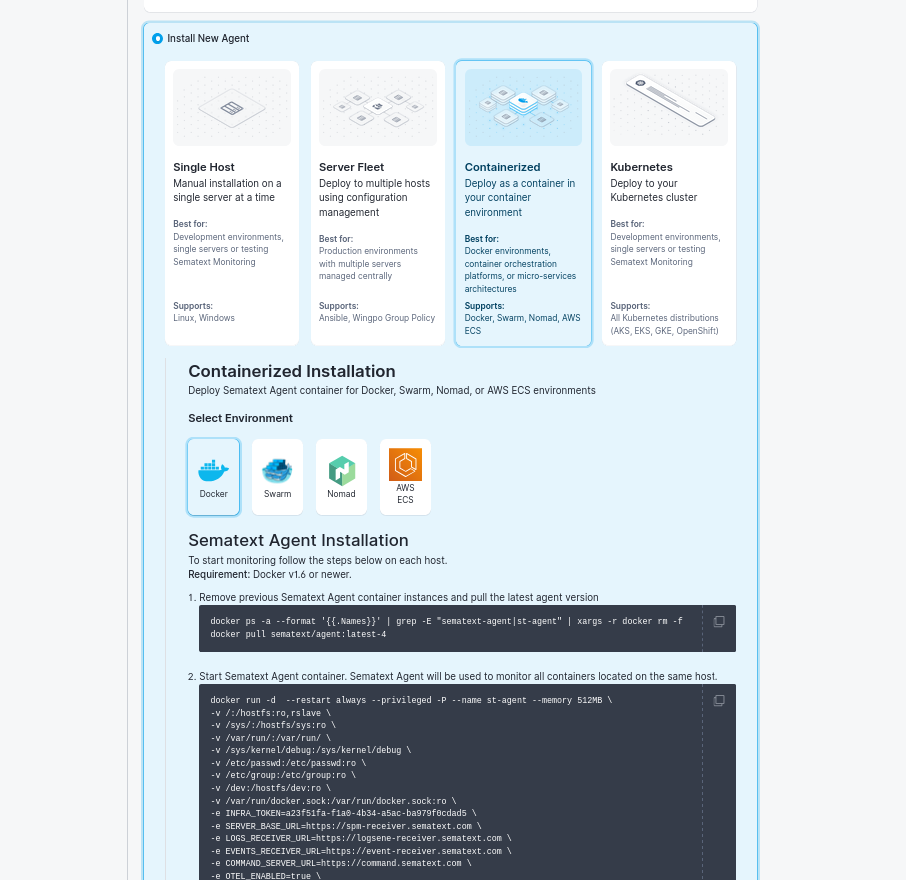
Containerized
- Best for: Docker environments, container orchestration platforms
- Platforms: Docker, Swarm, Nomad, AWS ECS
- Deployment: As a container in your containerized environment
Kubernetes
- Best for: Kubernetes clusters (AKS, EKS, GKE, OpenShift, Rancher)
- Methods: Helm, kubectl, Sematext Operator
- Deployment: As a DaemonSet across your Kubernetes cluster
Follow the installation commands provided in the UI for your chosen deployment method.
3.3 Verify Agent Installation:
Once the agent is running, the wizard will show "Host Detected" when the agent is communicating correctly.
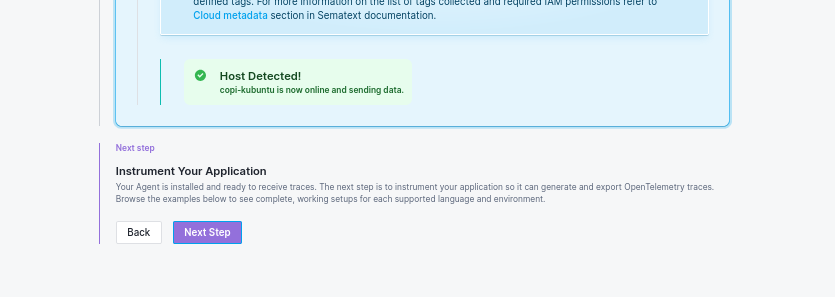
Step 4: Instrument Your Application
With the agent installed and running, the final step is to instrument your application to send traces.
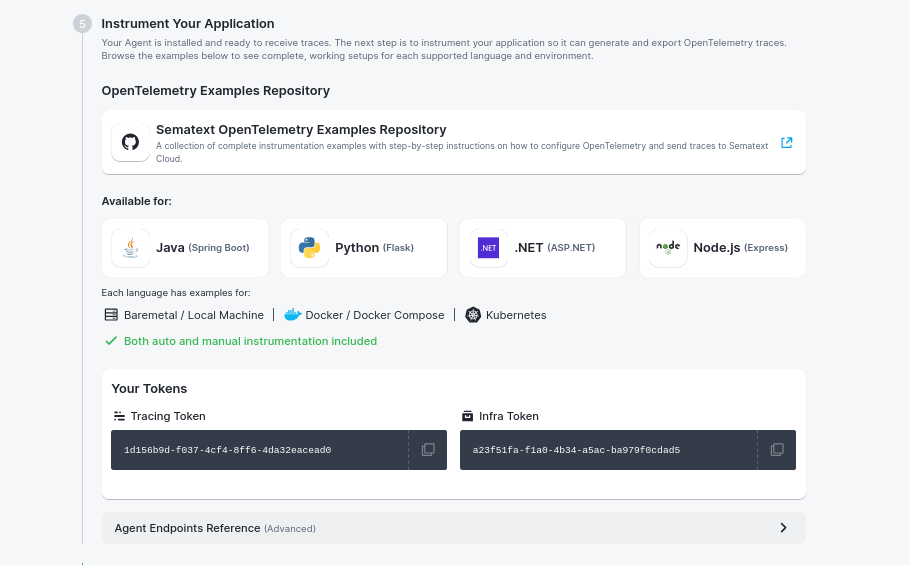
The wizard directs you to the Sematext OpenTelemetry Examples Repository, which contains complete, working examples for instrumenting your applications.
Available Languages:
| Language | Framework | Repository Link |
|---|---|---|
| Java | Spring Boot | java/ |
| Python | Flask | python/ |
| Node.js | Express | nodejs/ |
| .NET | ASP.NET Core | dotnet/ |
Available Environments:
Each language includes examples for:
- Baremetal / Local Machine: Direct installation on your server or development machine
- Docker / Docker Compose: Containerized deployments
- Kubernetes: Kubernetes cluster deployments
Instrumentation Types:
- Auto-Instrumentation: Zero code changes, automatic trace capture (recommended for getting started)
- Manual Instrumentation: Full control with custom spans and complete observability
Your Tokens:
The wizard displays your tokens needed for configuration:
- Tracing Token: Used in your application's OpenTelemetry configuration
- Infra Token: Used for agent authentication
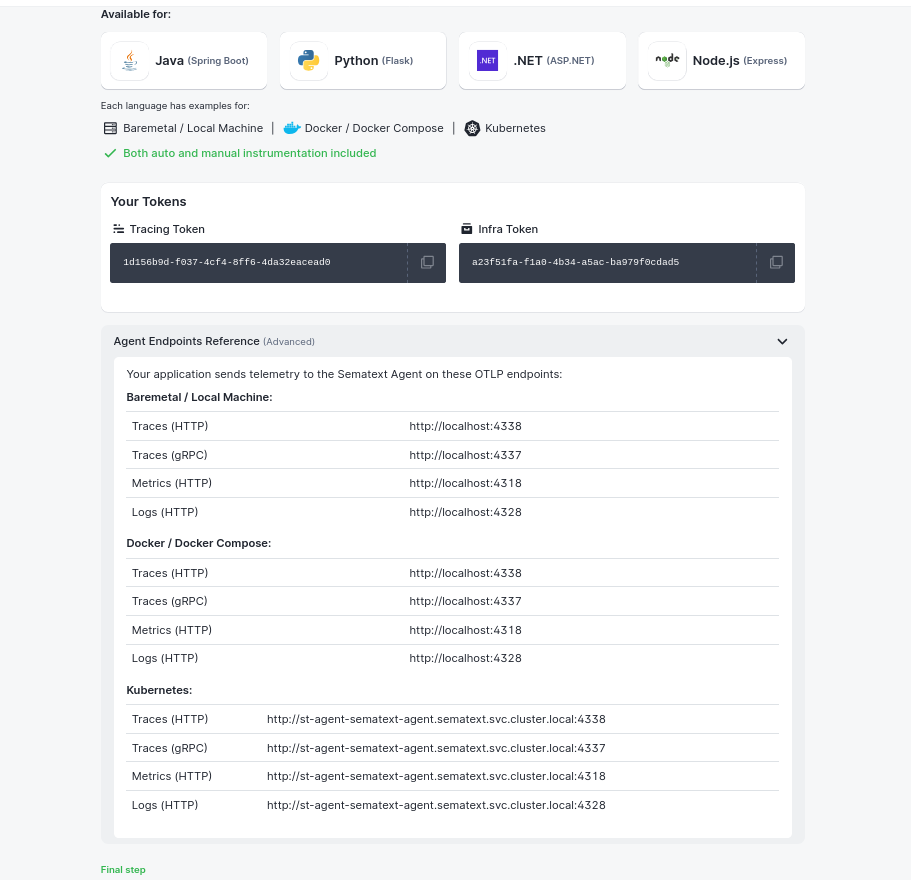
Agent Endpoints Reference:
Your application sends telemetry to the Sematext Agent on these OTLP endpoints:
| Environment | Traces (HTTP) | Traces (gRPC) |
|---|---|---|
| Baremetal / Docker | http://localhost:4338 |
http://localhost:4337 |
| Kubernetes | http://st-agent-sematext-agent.sematext.svc.cluster.local:4338 |
http://st-agent-sematext-agent.sematext.svc.cluster.local:4337 |
Additional endpoints for metrics and logs are also available (ports 4318 for metrics, 4328 for logs).
Quick Start Examples
Once your agent is installed, follow the examples in the repository. Here's a quick overview:
Java (Spring Boot)
# Download OpenTelemetry Java agent
wget https://github.com/open-telemetry/opentelemetry-java-instrumentation/releases/latest/download/opentelemetry-javaagent.jar

# Run with automatic instrumentation
java -javaagent:opentelemetry-javaagent.jar \
  -Dotel.service.name=your-service-name \
  -Dotel.exporter.otlp.endpoint=http://localhost:4338 \
  -Dotel.exporter.otlp.protocol=http/protobuf \
  -jar your-application.jar
Python (Flask)
# Install OpenTelemetry packages
pip install opentelemetry-distro[otlp]
opentelemetry-bootstrap -a install

# Configure and run
export OTEL_SERVICE_NAME=your-service-name
export OTEL_EXPORTER_OTLP_ENDPOINT=http://localhost:4338
export OTEL_EXPORTER_OTLP_PROTOCOL=http/protobuf

opentelemetry-instrument python your_app.py
Node.js (Express)
# Install dependencies
npm install @opentelemetry/auto-instrumentations-node @opentelemetry/exporter-trace-otlp-http @opentelemetry/sdk-node

# Create tracing.js and run
node -r ./tracing.js your-app.js
For complete setup instructions including Docker and Kubernetes deployments, visit the Sematext OpenTelemetry Examples Repository.
What You'll Have After Completion
Tokens and Configuration
- Infra App Token: For agent authentication
- Tracing App Token: For sending trace data to Sematext Cloud
Ready-to-Use Features
- Tracing Overview: Key metrics and service health
- Traces Explorer: Search and filter traces
- Individual Trace Analysis: Detailed span inspection
- Alert Configuration: Ready to set up performance alerts
Best Practices
Naming Conventions
- Apps: Use environment prefixes (
prod-api,staging-web) - Services: Use descriptive names (
user-authentication,payment-processor) - Avoid spaces: Use hyphens or underscores instead (
my-service, notmy service) - Keep names concise but clear
Planning Your Setup
- One App per Business Domain: Group related microservices that communicate with each other (e.g., all e-commerce services, all analytics services)
- Environment Separation: Different Apps for prod/staging/dev environments
- Cross-Service Visibility: Keep communicating services in the same App to see end-to-end traces
Troubleshooting
No Traces Appearing
- Verify agent is running and shows "Host Detected"
- Check OTLP endpoint configuration in your application
- Ensure the service name is configured (
OTEL_SERVICE_NAME) - Review the Troubleshooting Guide
Agent Issues
- Confirm Infra App token is correct
- Check network connectivity between agent and application
- Verify ports 4337/4338 are accessible
- Review agent logs for configuration errors
Next Steps
After completing App creation:
- Explore Traces: Navigate to Traces Explorer to see your traces
- Set Up Alerts: Create performance alerts for key metrics
- Add Custom Instrumentation: Learn about manual instrumentation in SDKs
- Optimize Performance: Configure sampling strategies and cost optimization
Related Documentation
- OpenTelemetry SDKs - Detailed SDK documentation
- Sematext OpenTelemetry Examples - Working code examples
- Agent Configuration - Agent setup details
- Tracing Dashboard - Understanding the tracing UI
- Troubleshooting - Common issues and solutions
Need Help?
- Contact support@sematext.com
- Use live chat in Sematext Cloud