Kubernetes
Kubernetes is a portable, extensible, open-source platform for managing containerized workloads and services, that facilitates both declarative configuration and automation. To start monitoring Kubernetes with Sematext, you only need to install a tiny agent that adds basically no CPU or memory overhead.
If you are new to Sematext's Kubernetes Monitoring, the following 4 minute video is a good way to get a sneak-peak. Note that it's from late 2023 and our Kubernetes monitoring is constantly evolving and improving.
Monitoring Kubernetes with Sematext
Sematext Monitoring will provide you with detailed insights into your cluster's control plane components and their health, performance metrics, and resource counts, among other important metrics. Speaking of metrics, you can check out this page for a summarized list of key metrics that you can track using Sematext. It also includes a short explanation for each metric.
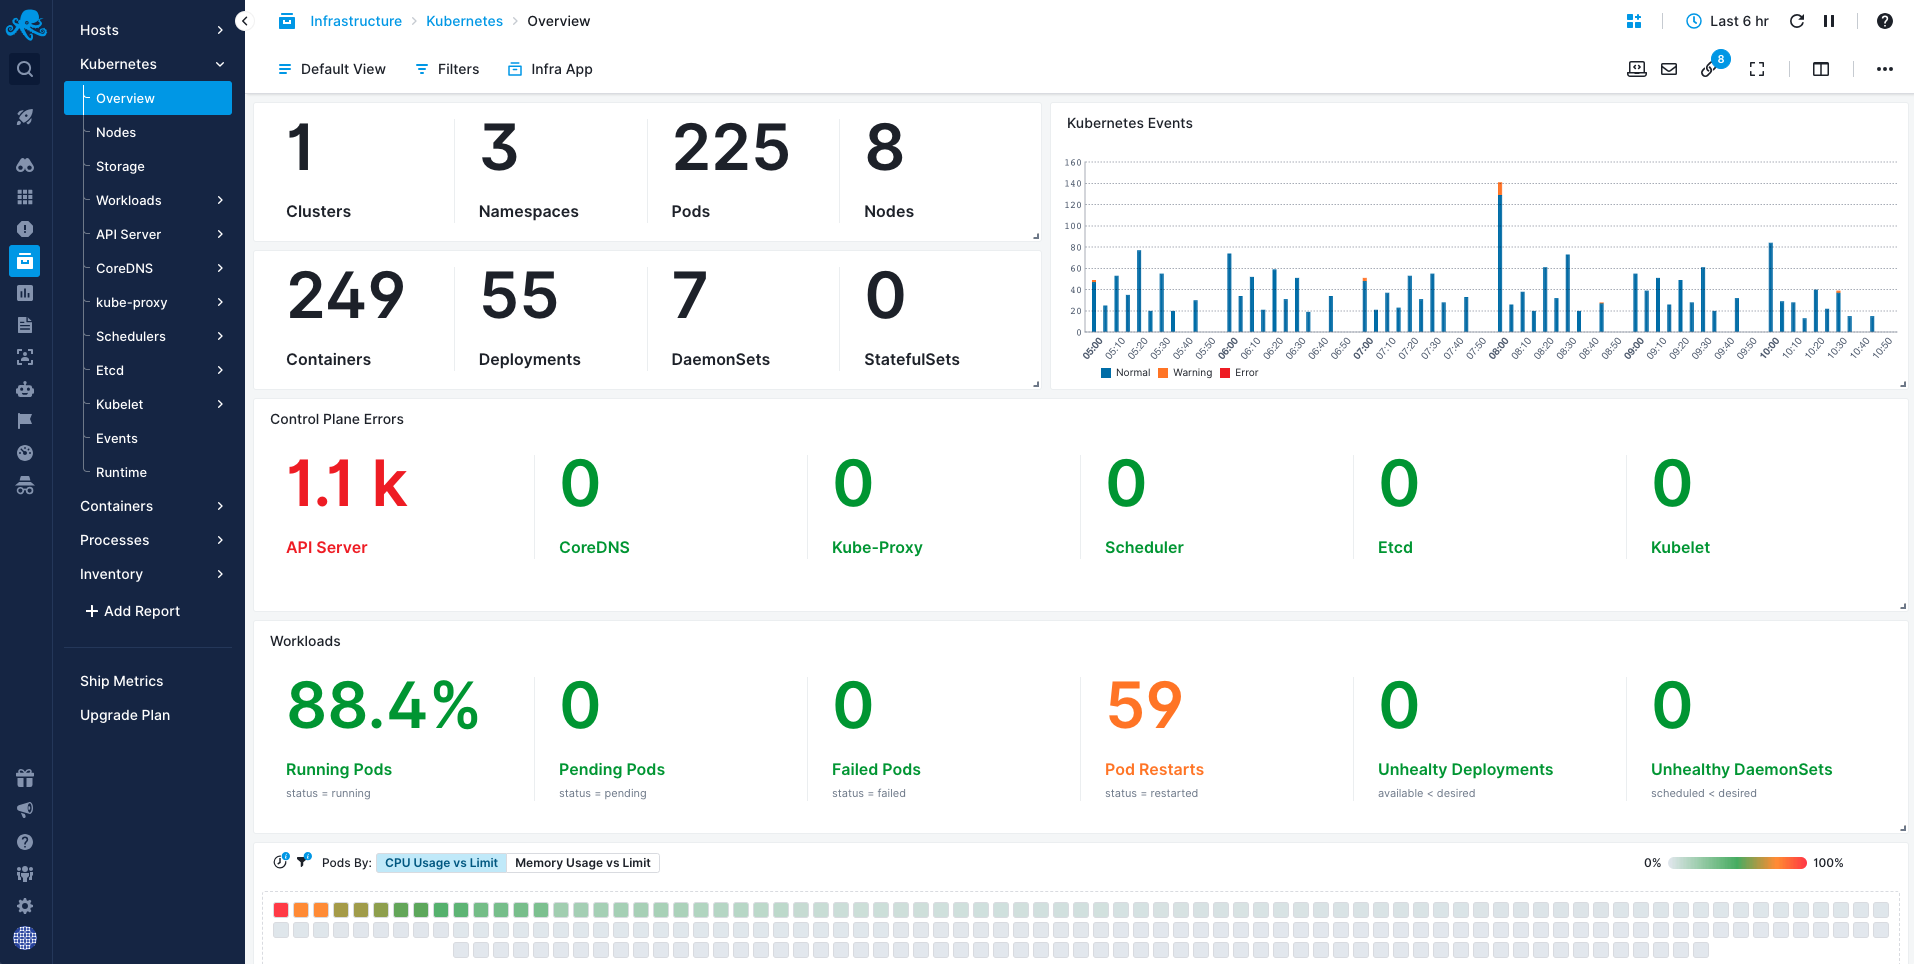
Agent Install
To start monitoring Kubernetes with Sematext install the Sematext Agent. Setting up the agent takes less than 5 minutes:
- Create a new Infra App in Sematext Cloud US (or Sematext Cloud Europe). Go to the All Apps page by clicking the Octi icon in the top-left corner of the main navigation menu. From there, select Infra to start creating your Infrastructure App.
- Name your Infra App, select the Kubernetes distribution of your choice and install the Sematext Agent based on your preferred installation method. Available options include kubectl and a Helm chart.
Agent Configuration
The Sematext Agent offers a versatile container engine monitoring and visibility solution that is easy to customize. For more information, please refer to our Agent Configuration for Kubernetes.
Kubernetes Distributions
This section provides specific information for all major Kubernetes distributions.
AWS Elastic Kubernetes Service (EKS)
All reports function as expected with the following limitations due to the services being managed by AWS:
- Etcd metrics are missing
Microsoft Azure Kubernetes Service (AKS)
All reports function as expected with the following limitations due to the services being managed by Azure:
- Kube controller manager metrics are missing
- Etcd metrics are missing, except for those originating from the API server
Google Kubernetes Engine (GKE)
All reports function as expected, with the following limitations due to the services being managed by Google:
- Some metrics in API server are missing
- Etcd metrics are missing
- CoreDNS metrics are missing since Google is using kube-dns
- Schedulers metrics are missing
Rancher
All reports, including Kubernetes Workloads, function as expected except for most of the control plane metrics, which are either missing or limited. However, all API server metrics are available.
Red Hat OpenShift
Most of the reports function as expected, with some limitations or missing metrics in the control plane due to the services being managed by Red Hat.
Shipping Kubernetes logs to Sematext
Due to its nature, Kubernetes can be difficult to debug and without proper tooling this process will take a lot longer than it has to. Sematext helps you shed light on what caused issues with your Kubernetes cluster by collecting Kubernetes logs and events.
All you need to do is use Discovery to Set Up log shipping:
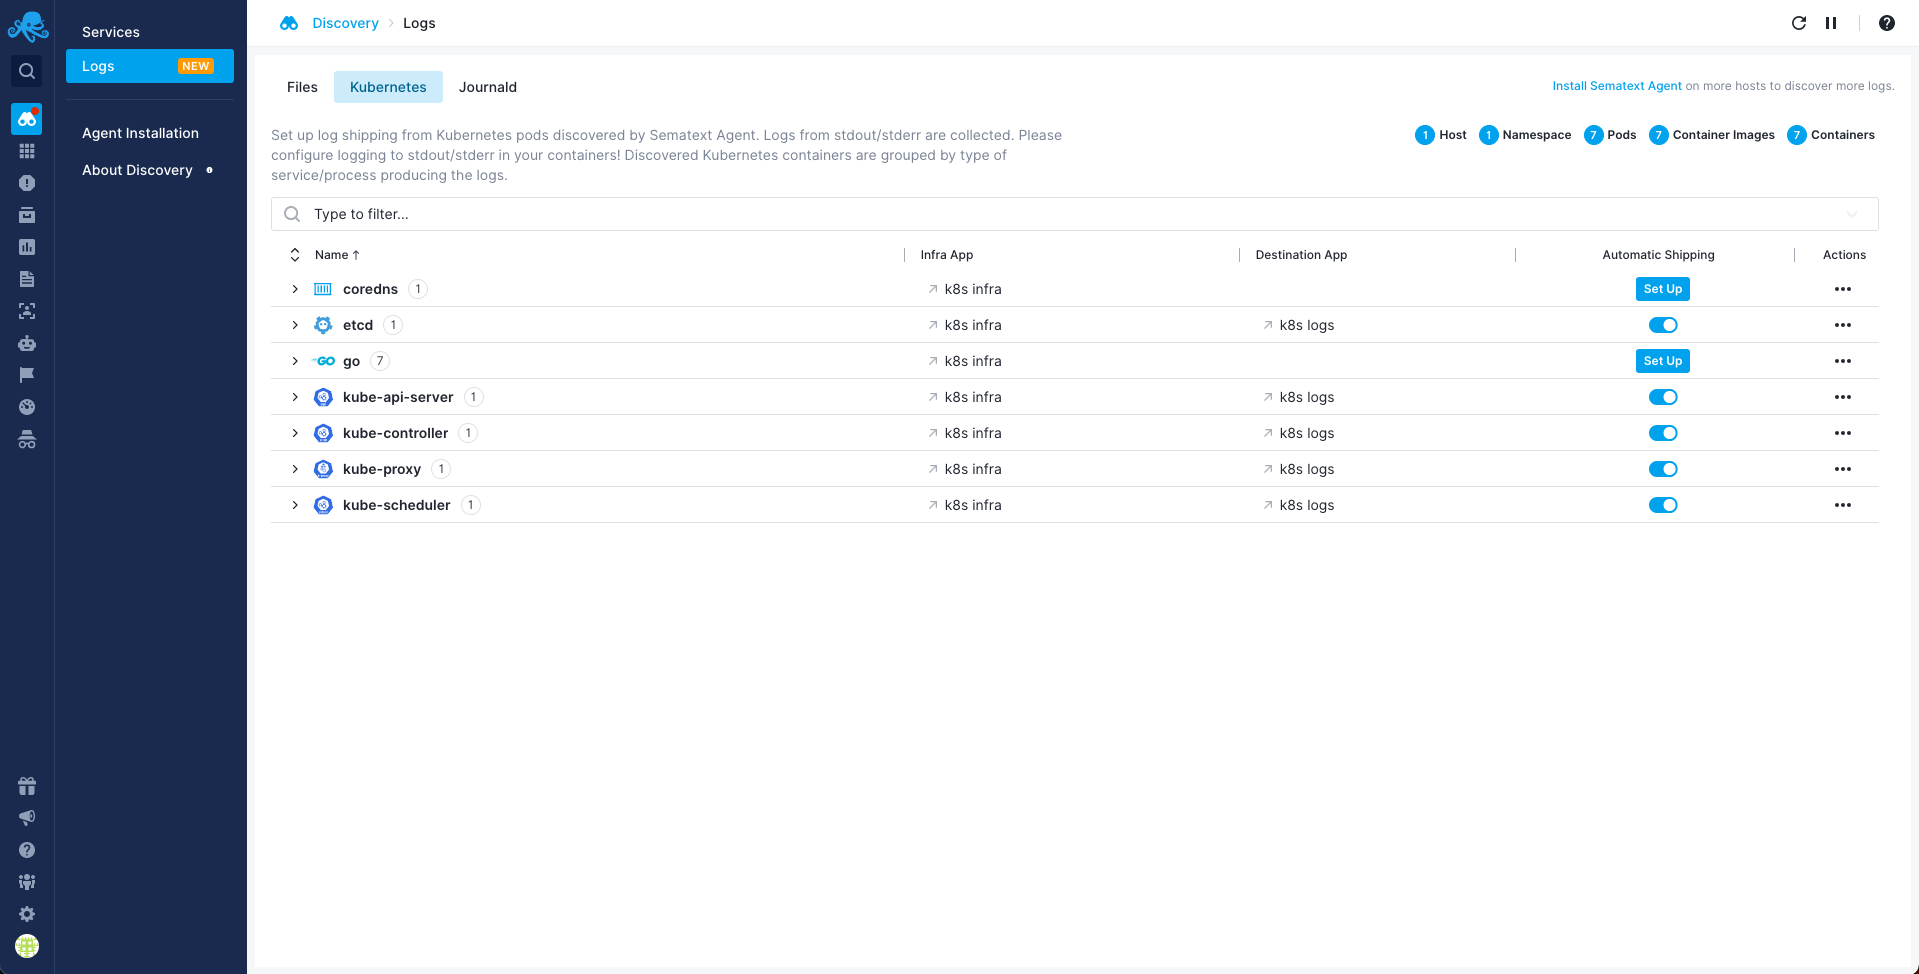
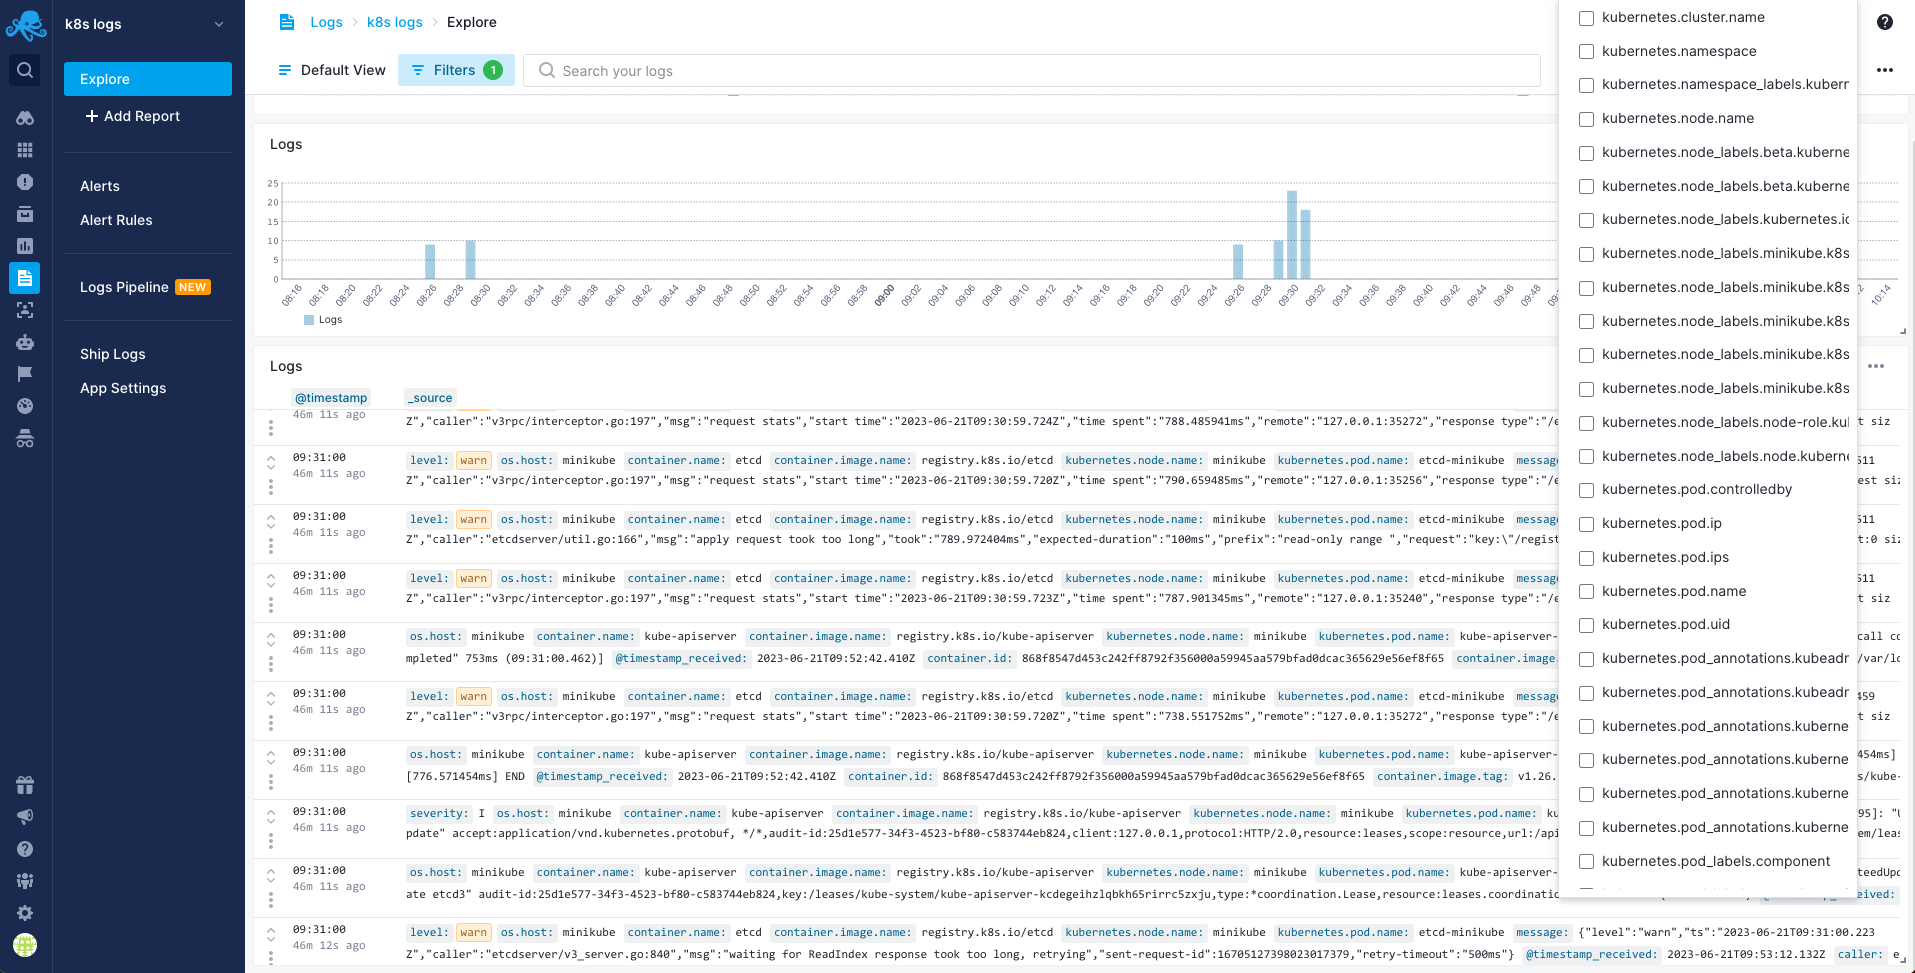
Once data is in, you can explore it via the built-in reports:
If you are looking to use a different type of integration you can check out this page.
Sematext also provides a Kubernetes Audit logs receiver endpoint. Check out Kubernetes Audit Logs Integration for detailed instructions on shipping Kubernetes audit logs.
Kubernetes Events
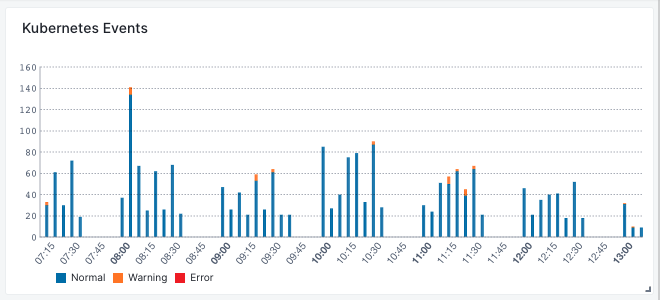
Kubernetes events track a wide range of activities within a Kubernetes cluster, making them really important in monitoring and troubleshooting the cluster's health and reliability. They provide detailed information about the state and behavior of resources in the cluster, such as pods, nodes, services, and other objects. That's why you can find these events both in the Kubernetes overview and in a dedicated Events report.
In the top-right corner of the Kubernetes overview, you’ll find a chart with the distribution of all Kubernetes events, coloured by severity, within your selected time range. This is really useful to quickly pinpoint when an incident happened.
In Kubernetes Events you can explore and filter all the events received within the selecting time range. They are also color-coded by severity and you can quickly see the event message, the available event tags (fields) and the Infra App name to which they belong. Each event can be expanded to get all the details, nicely structured based on all available event tags and their respective values.
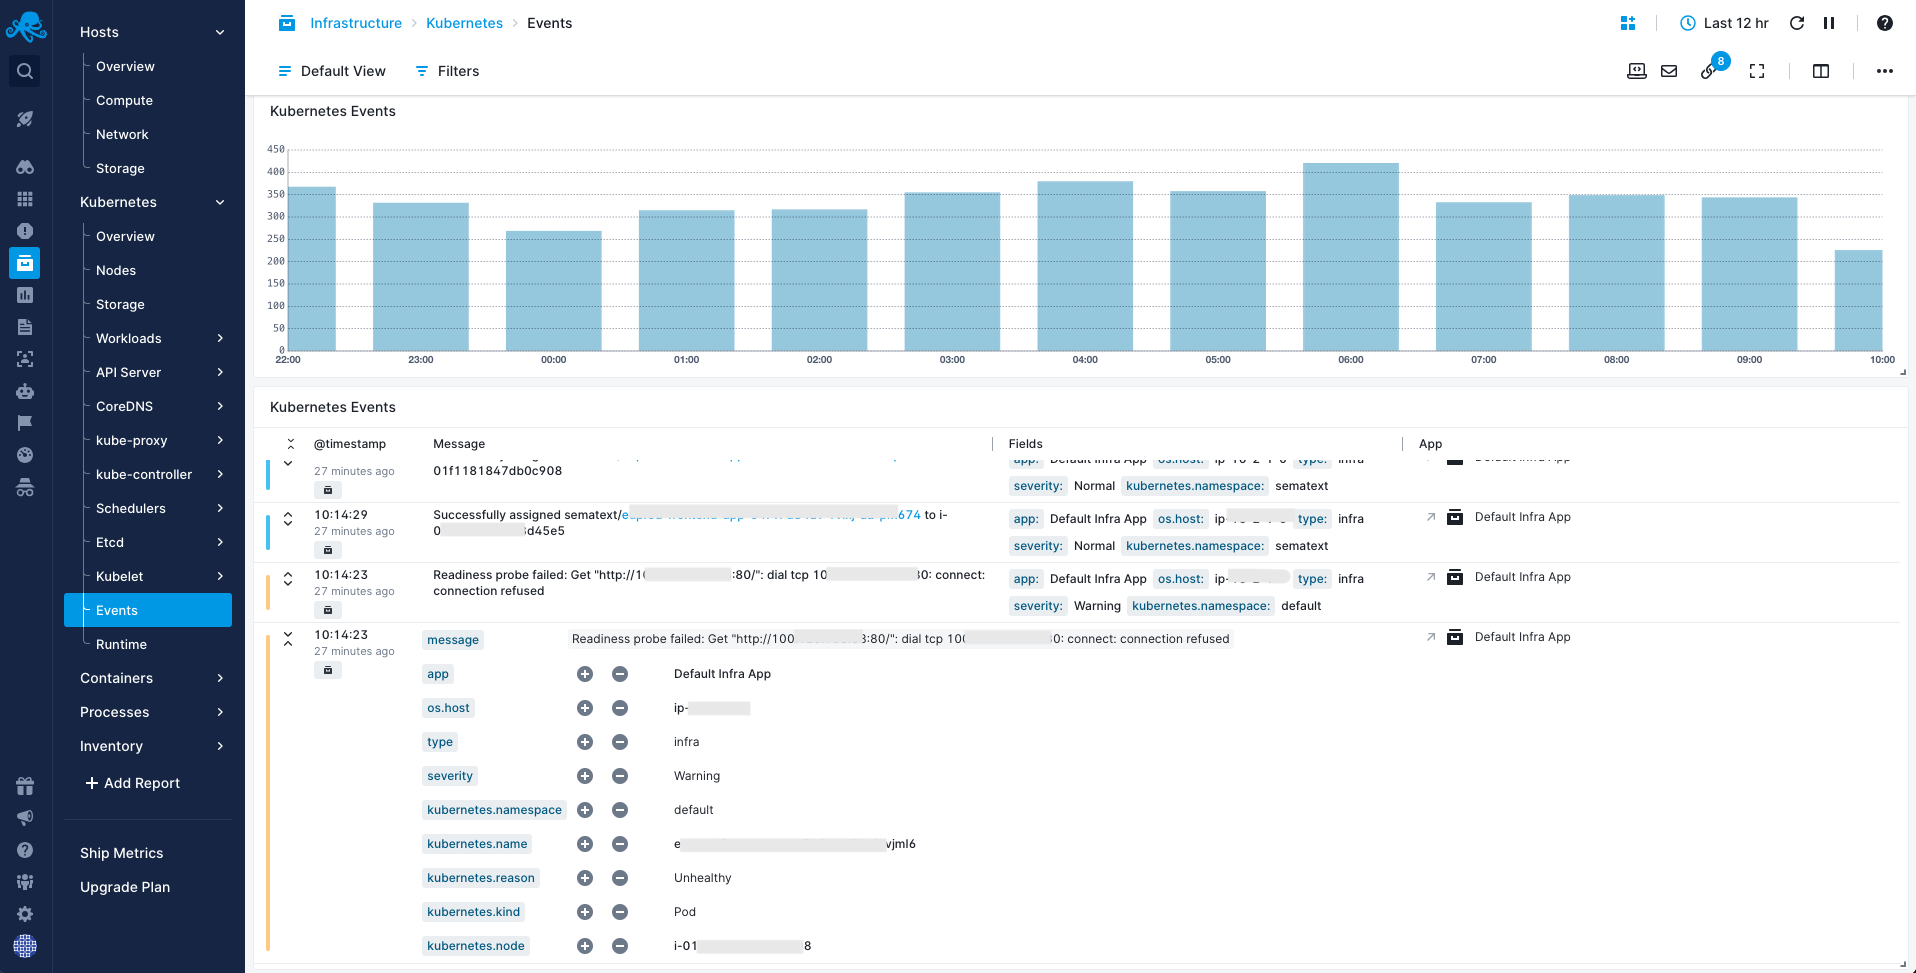
In the expanded view, you can filter the events by each individual tag value, whether to include or exclude it.
For additional information about Kubernetes events, please refer to the Agent Kubernetes events page.
Important Kubernetes Metrics
Below you can find a list of the most important Kubernetes metrics to monitor. For a complete list of all the supported metrics, please refer to our dedicated Kubernetes Metrics page.
Control Plane Metrics
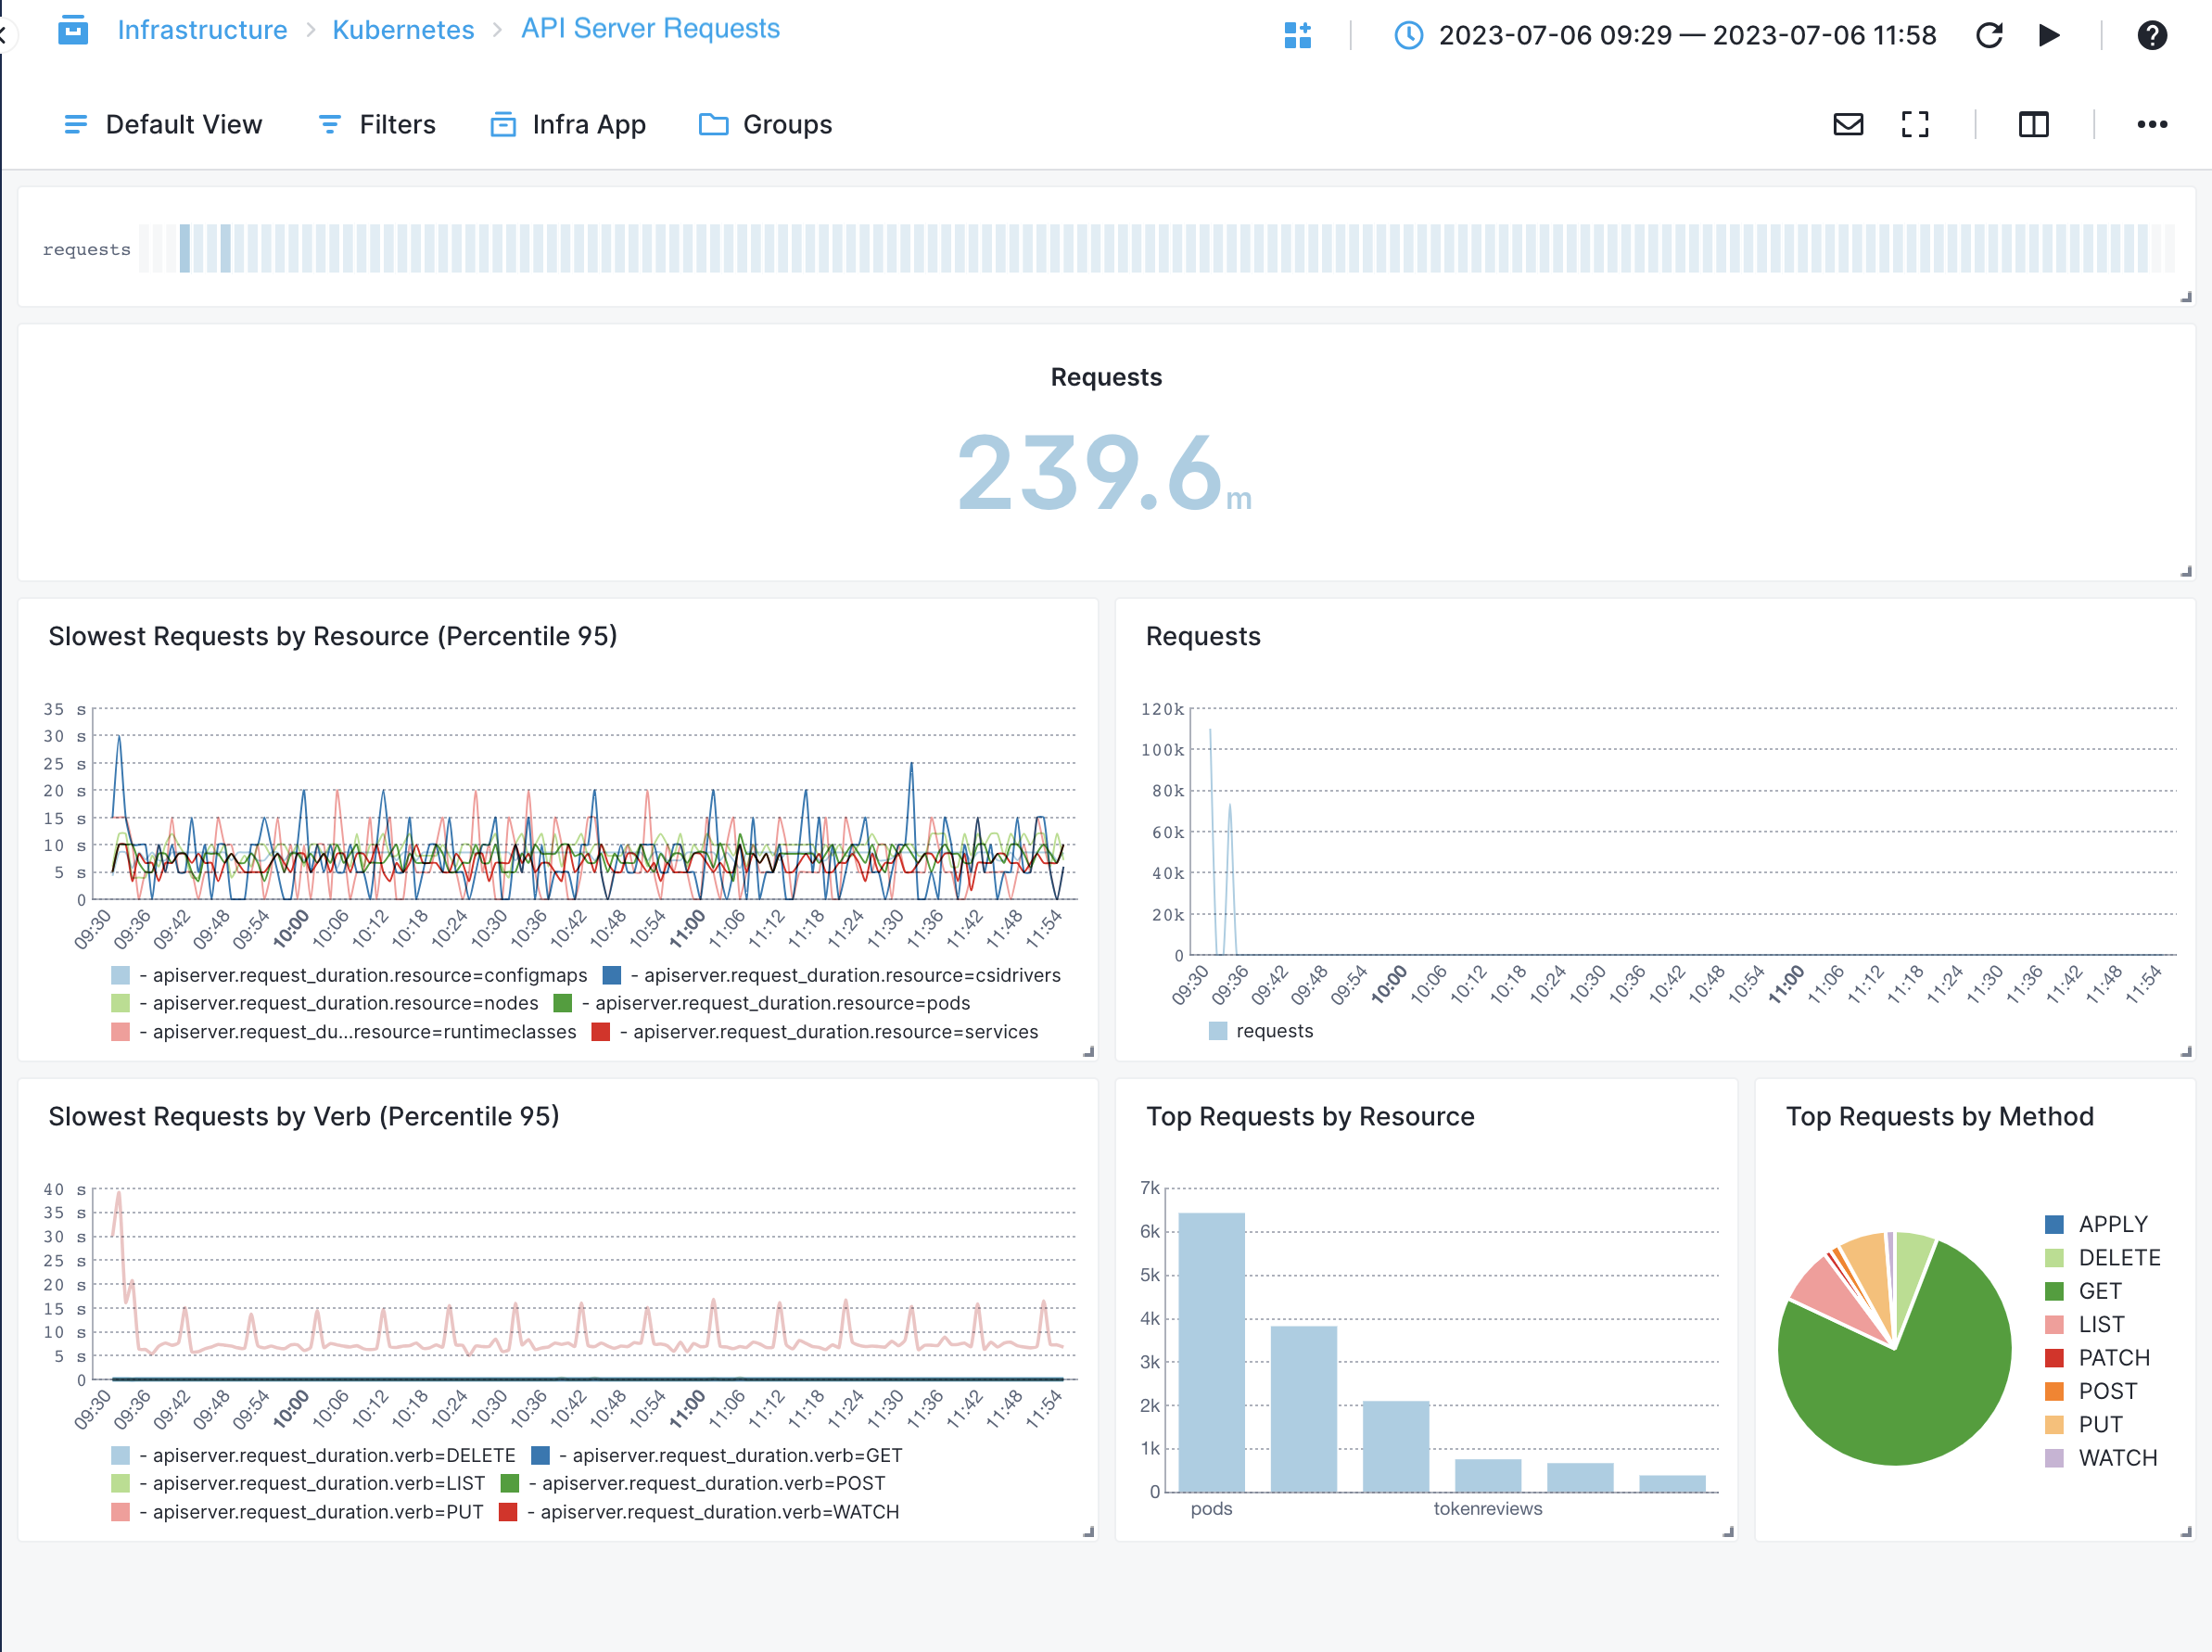
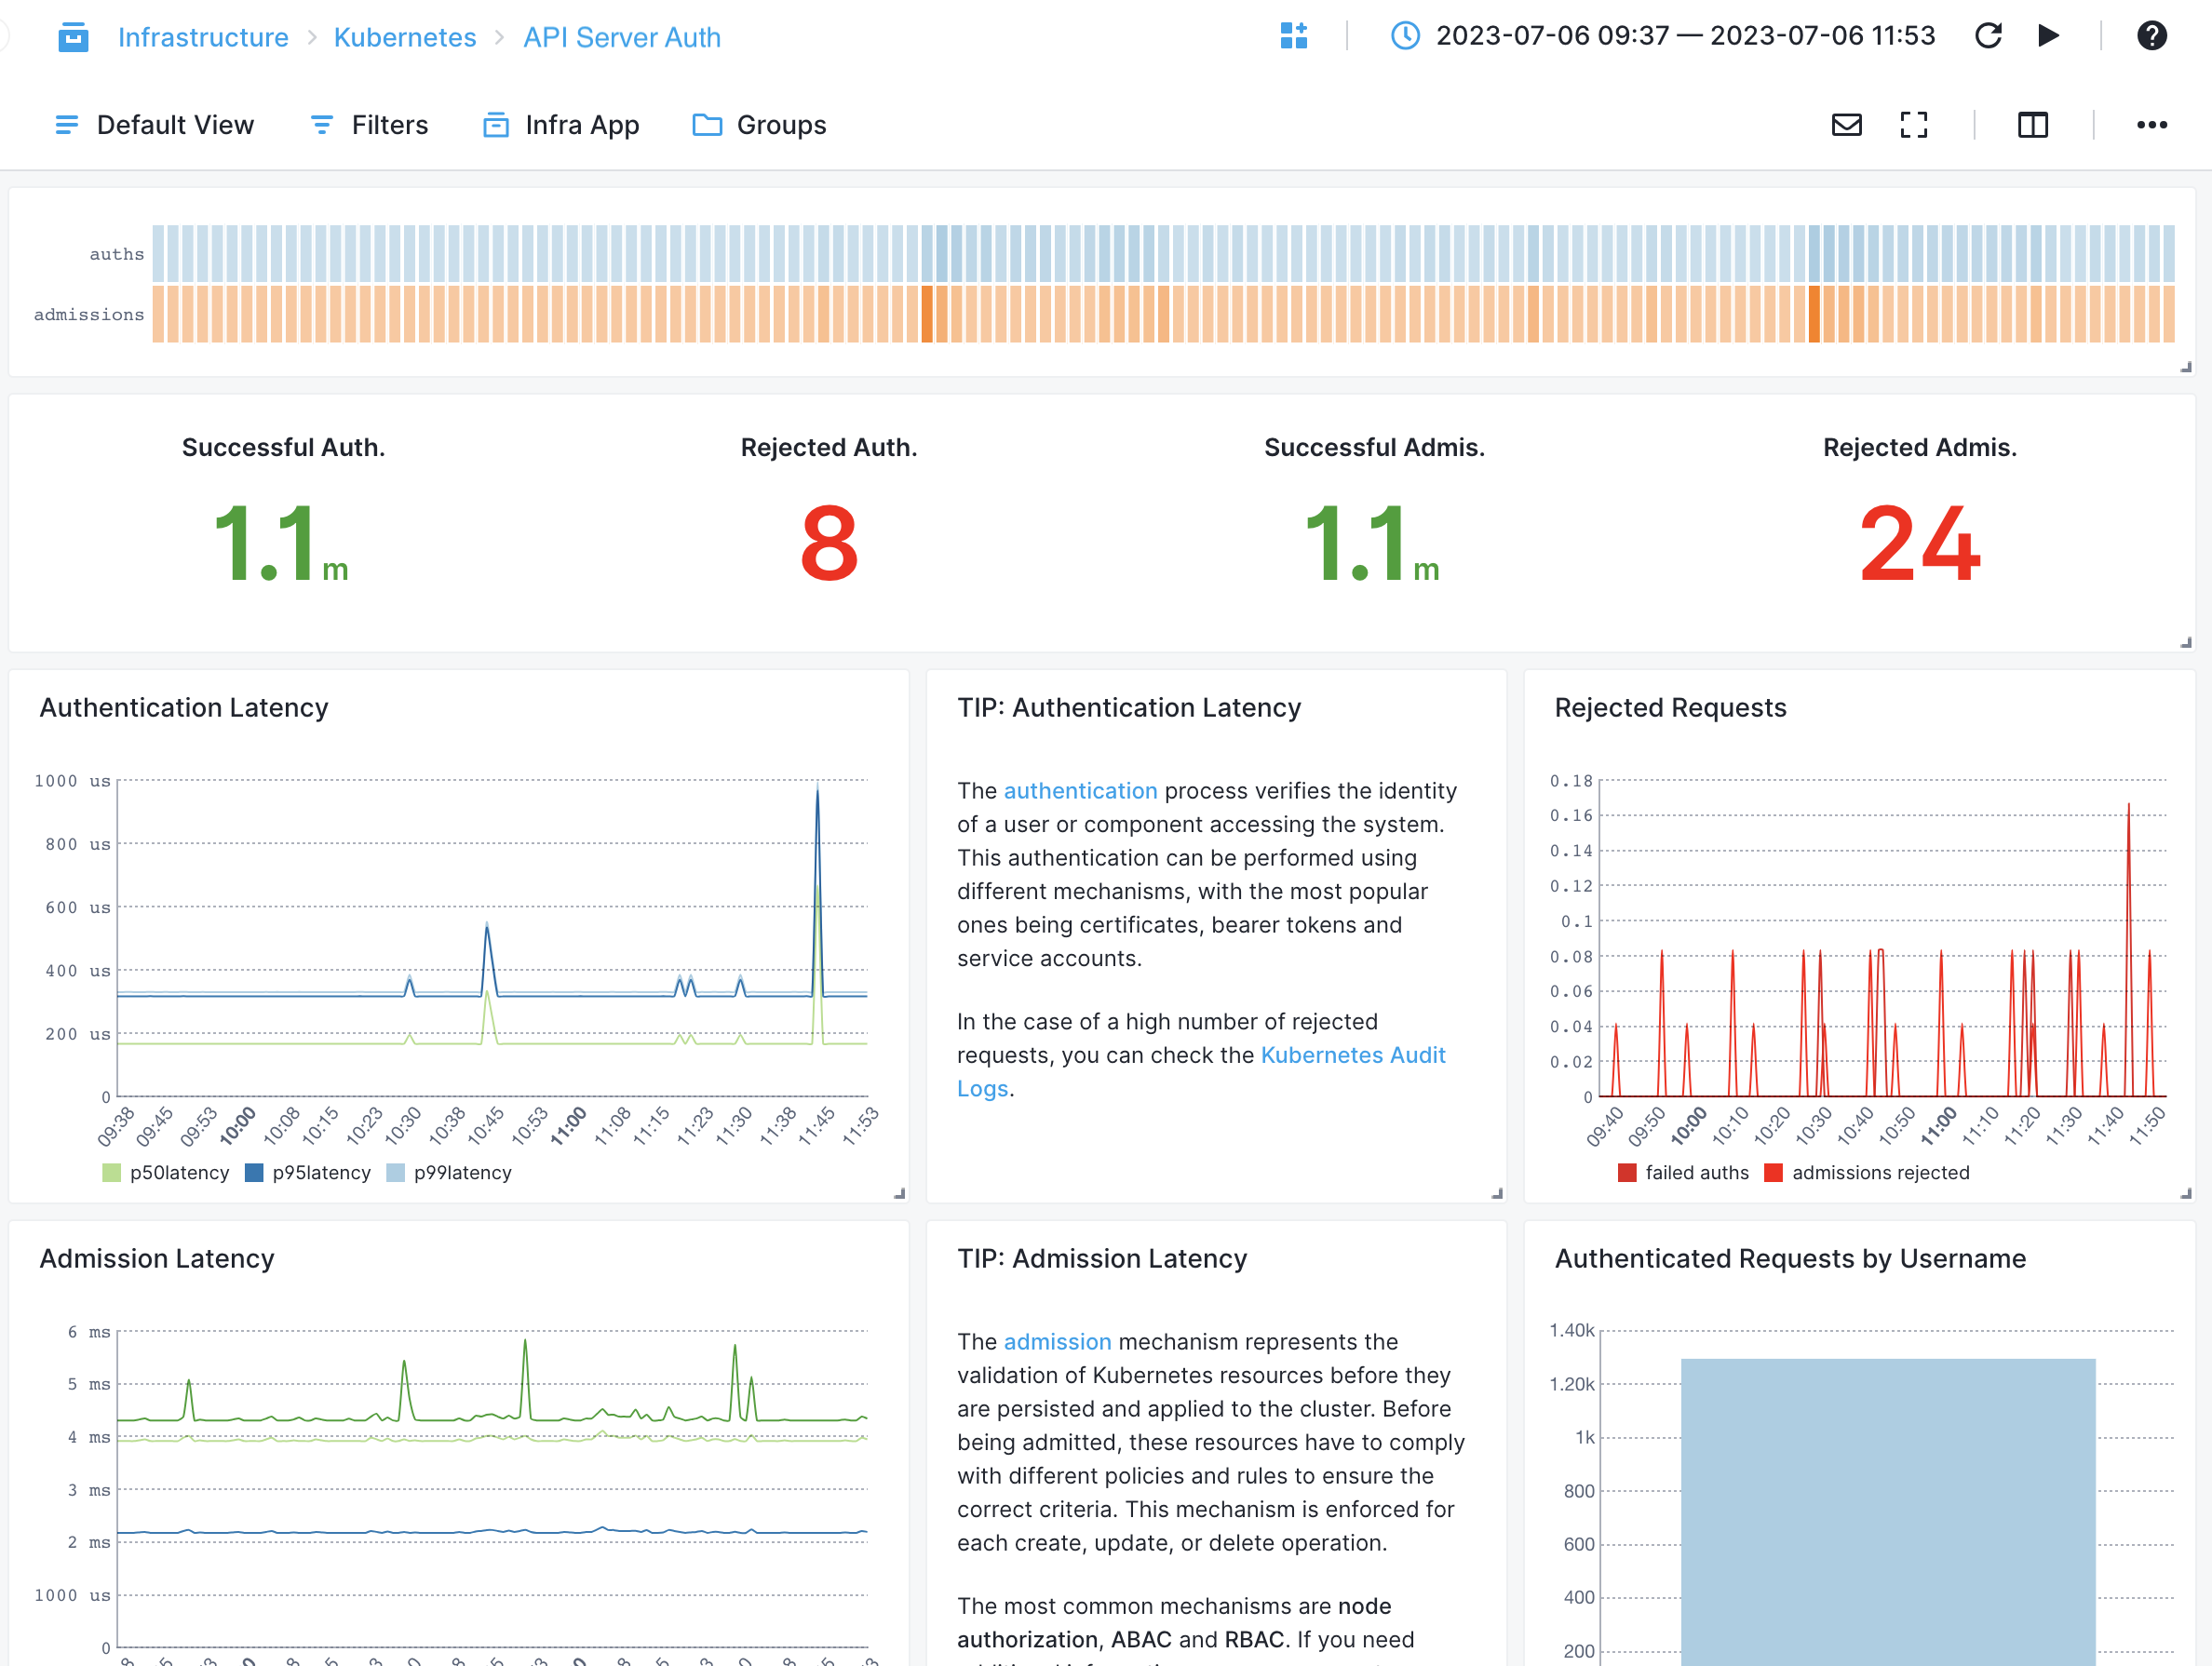
API Server
- Request Latency - Measures the time taken to process API server requests
- Request Throughput - Tracks the number of API server requests processed per unit of time
- Error Rate - Monitors the rate of API server errors
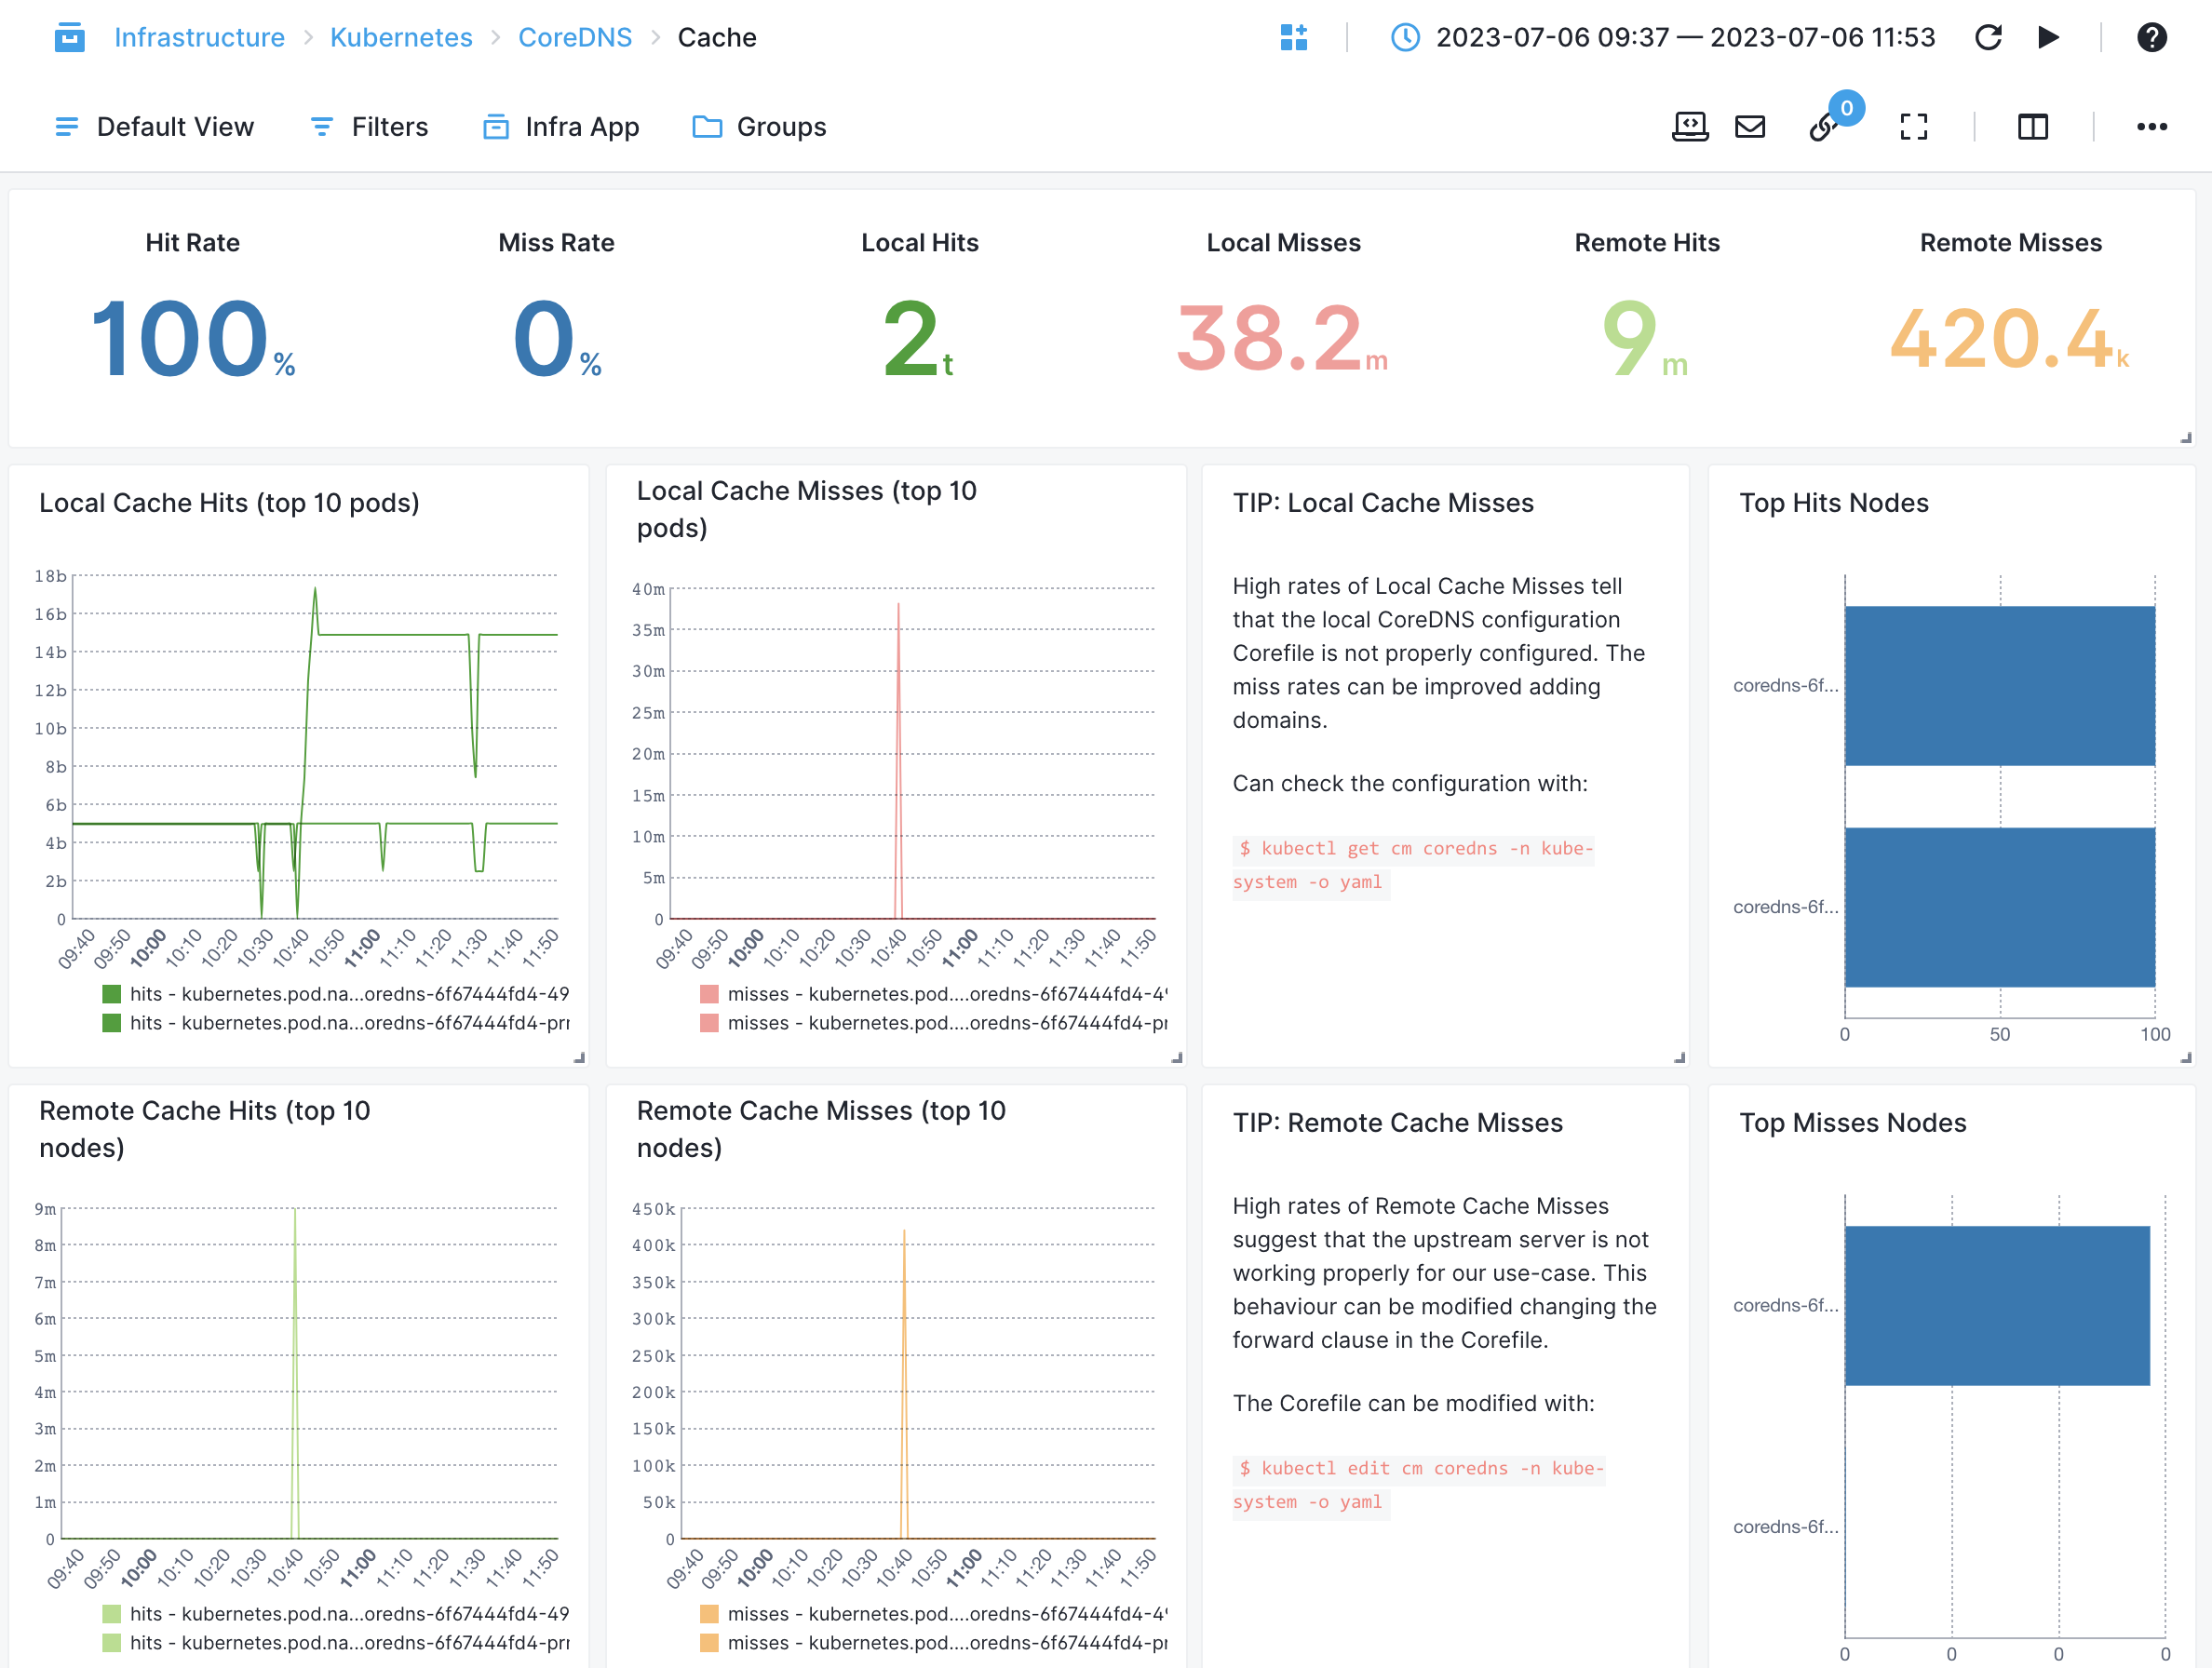
CoreDNS
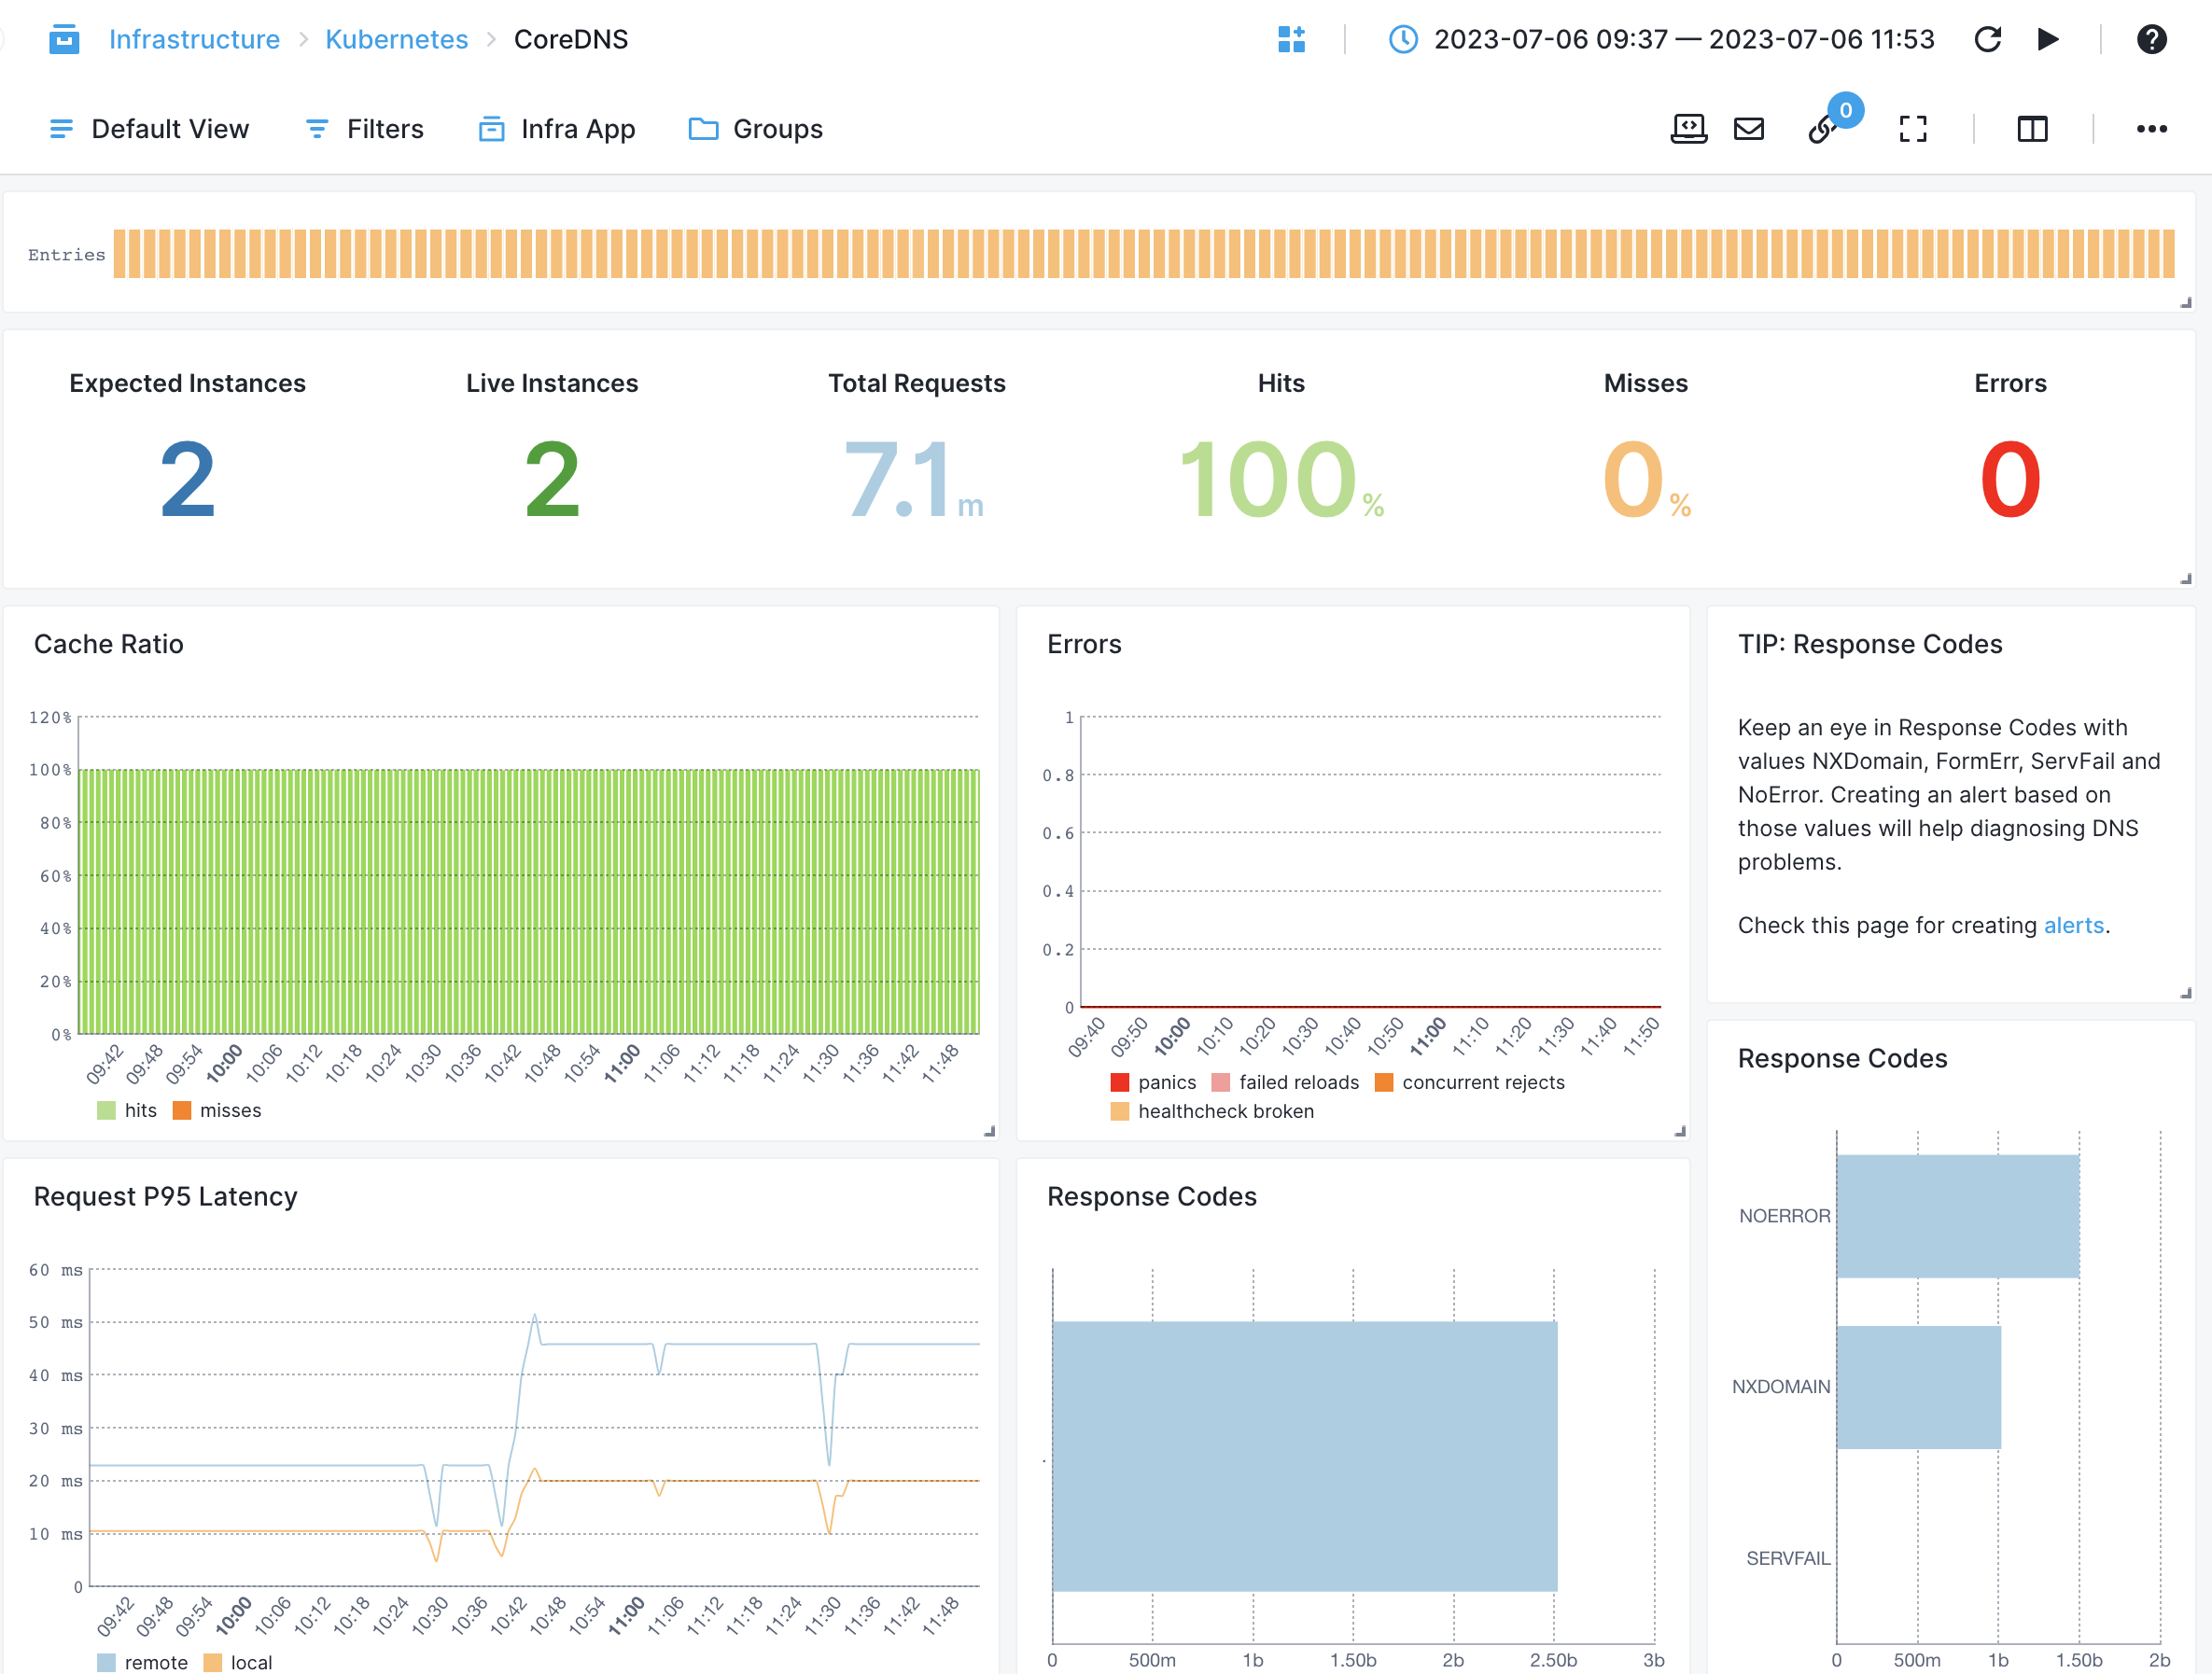
- DNS Request Latency - Measures the time taken to process DNS requests by CoreDNS
- DNS Local and Remote Cache Misses - Counts the number of cache misses for DNS queries in CoreDNS's local or remote cache.
- Error Rate - Monitors the rate of DNS errors encountered by CoreDNS
etcd
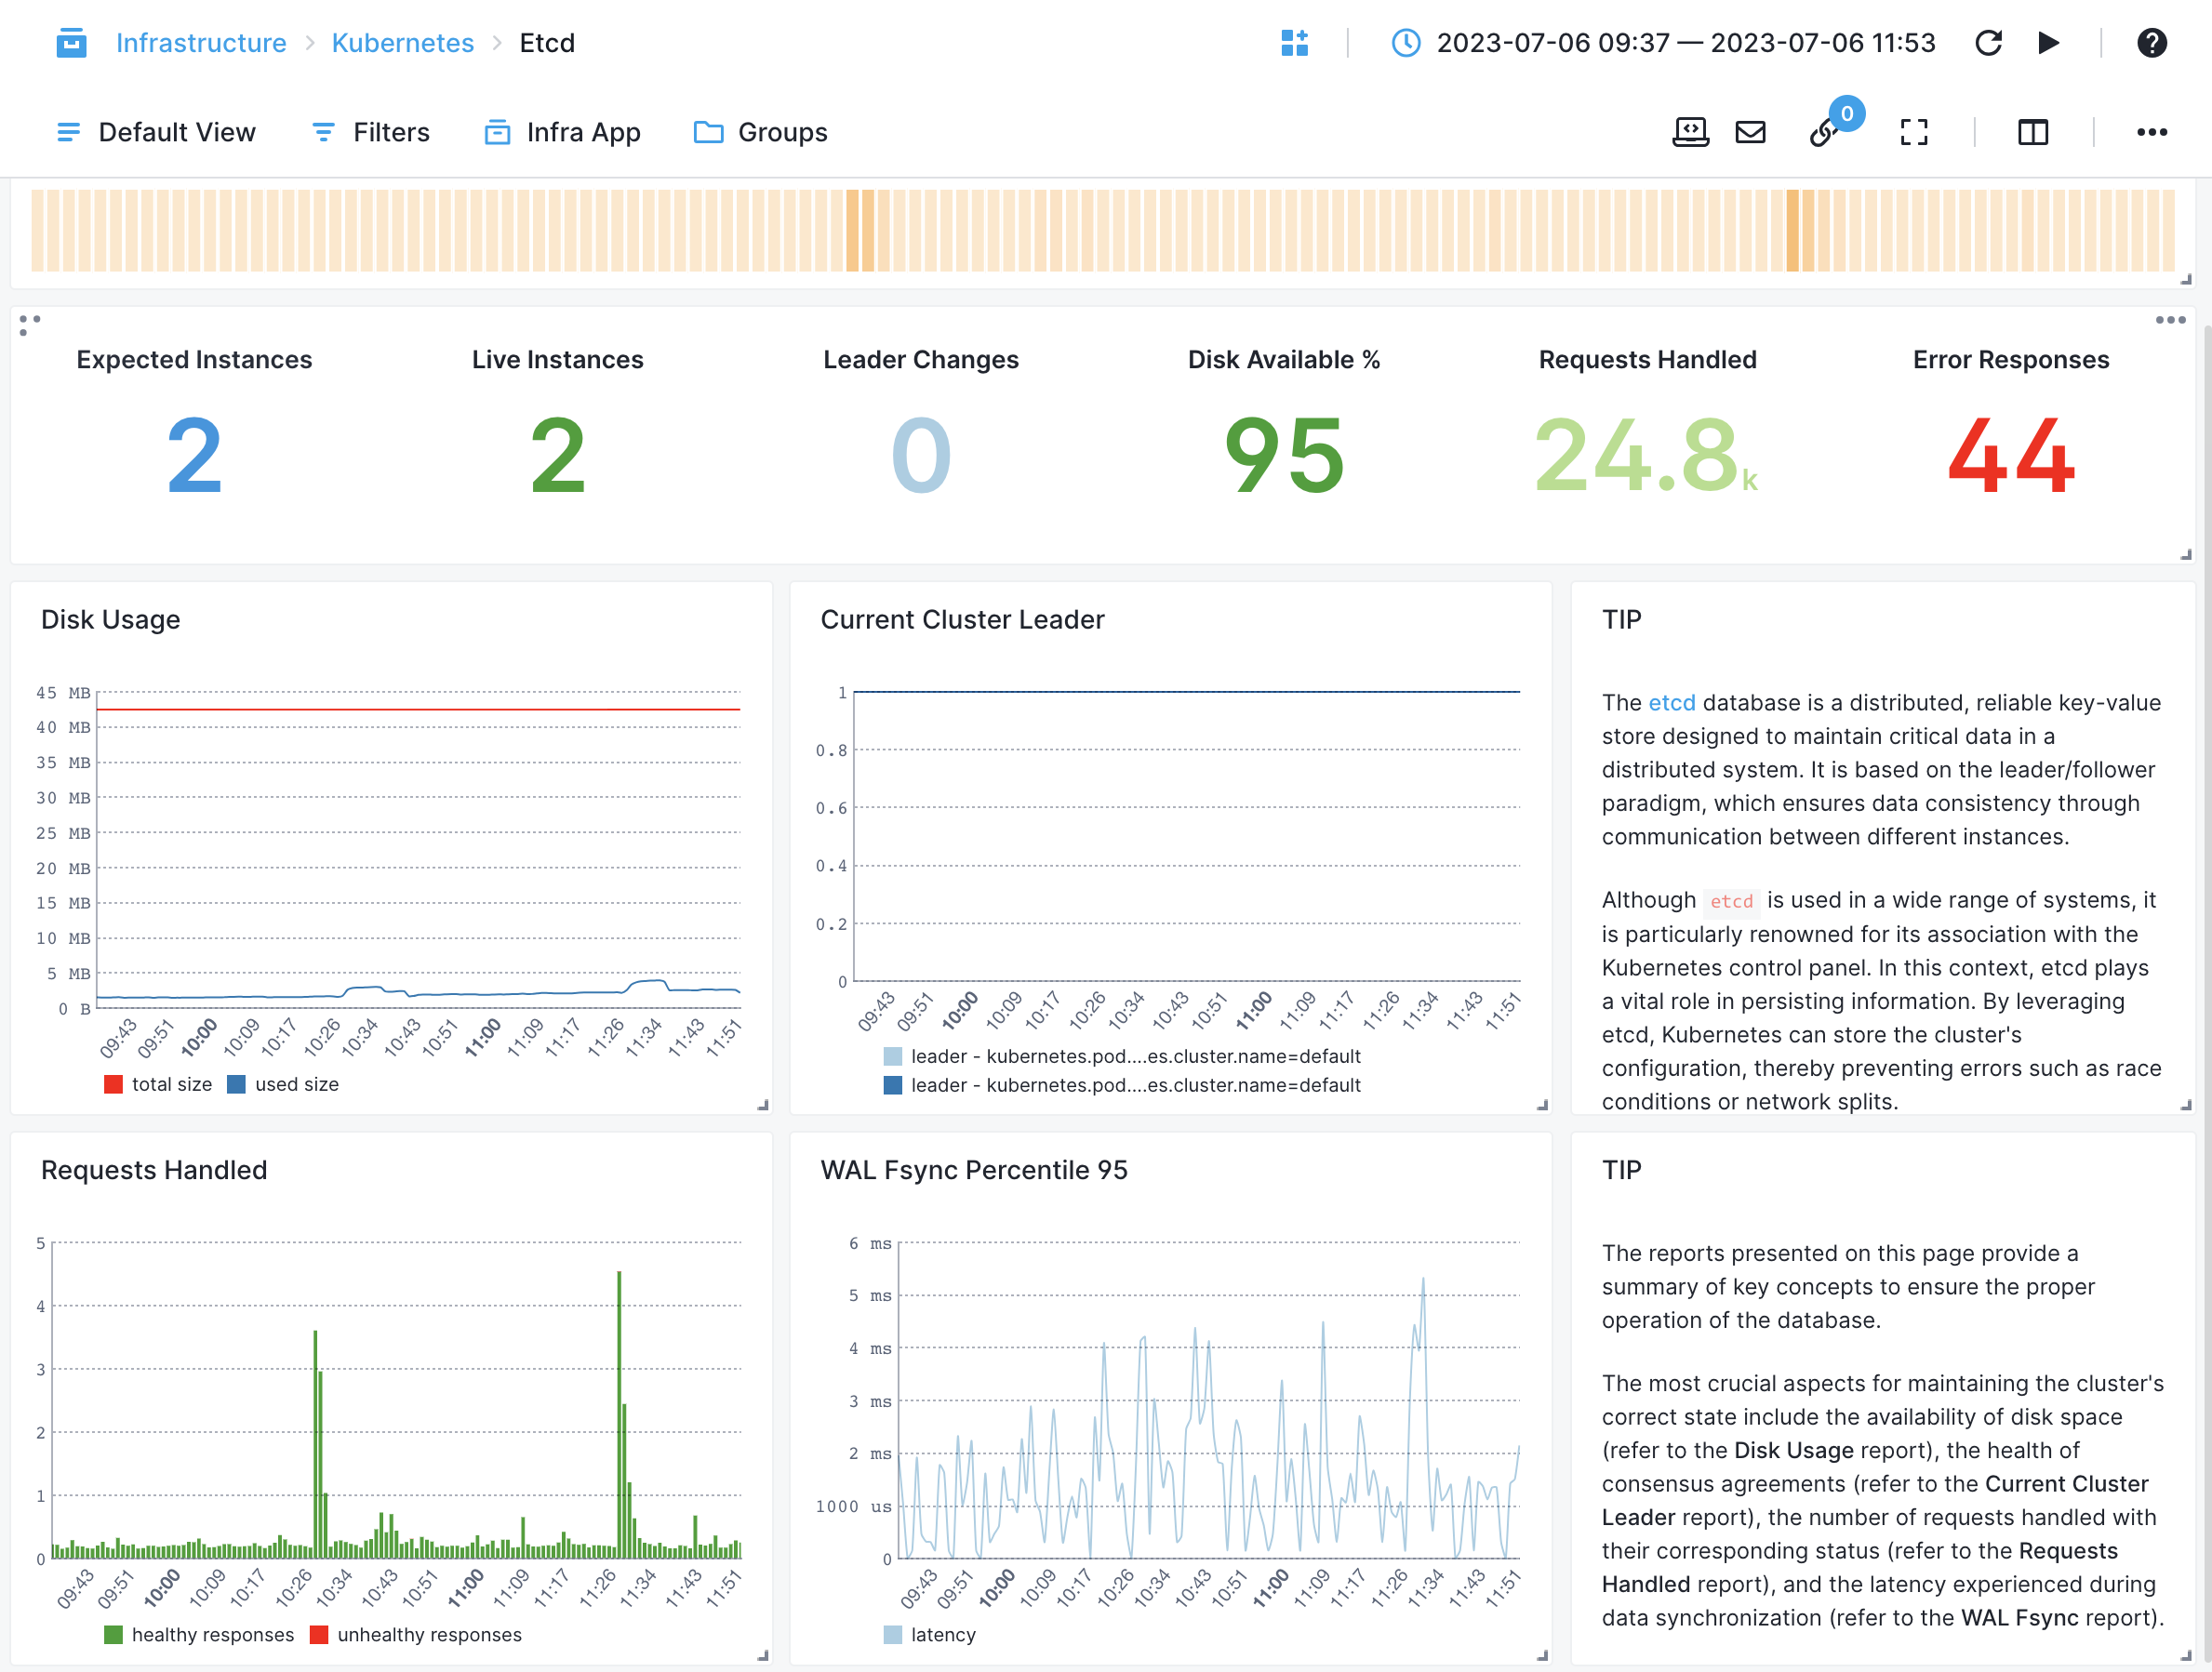
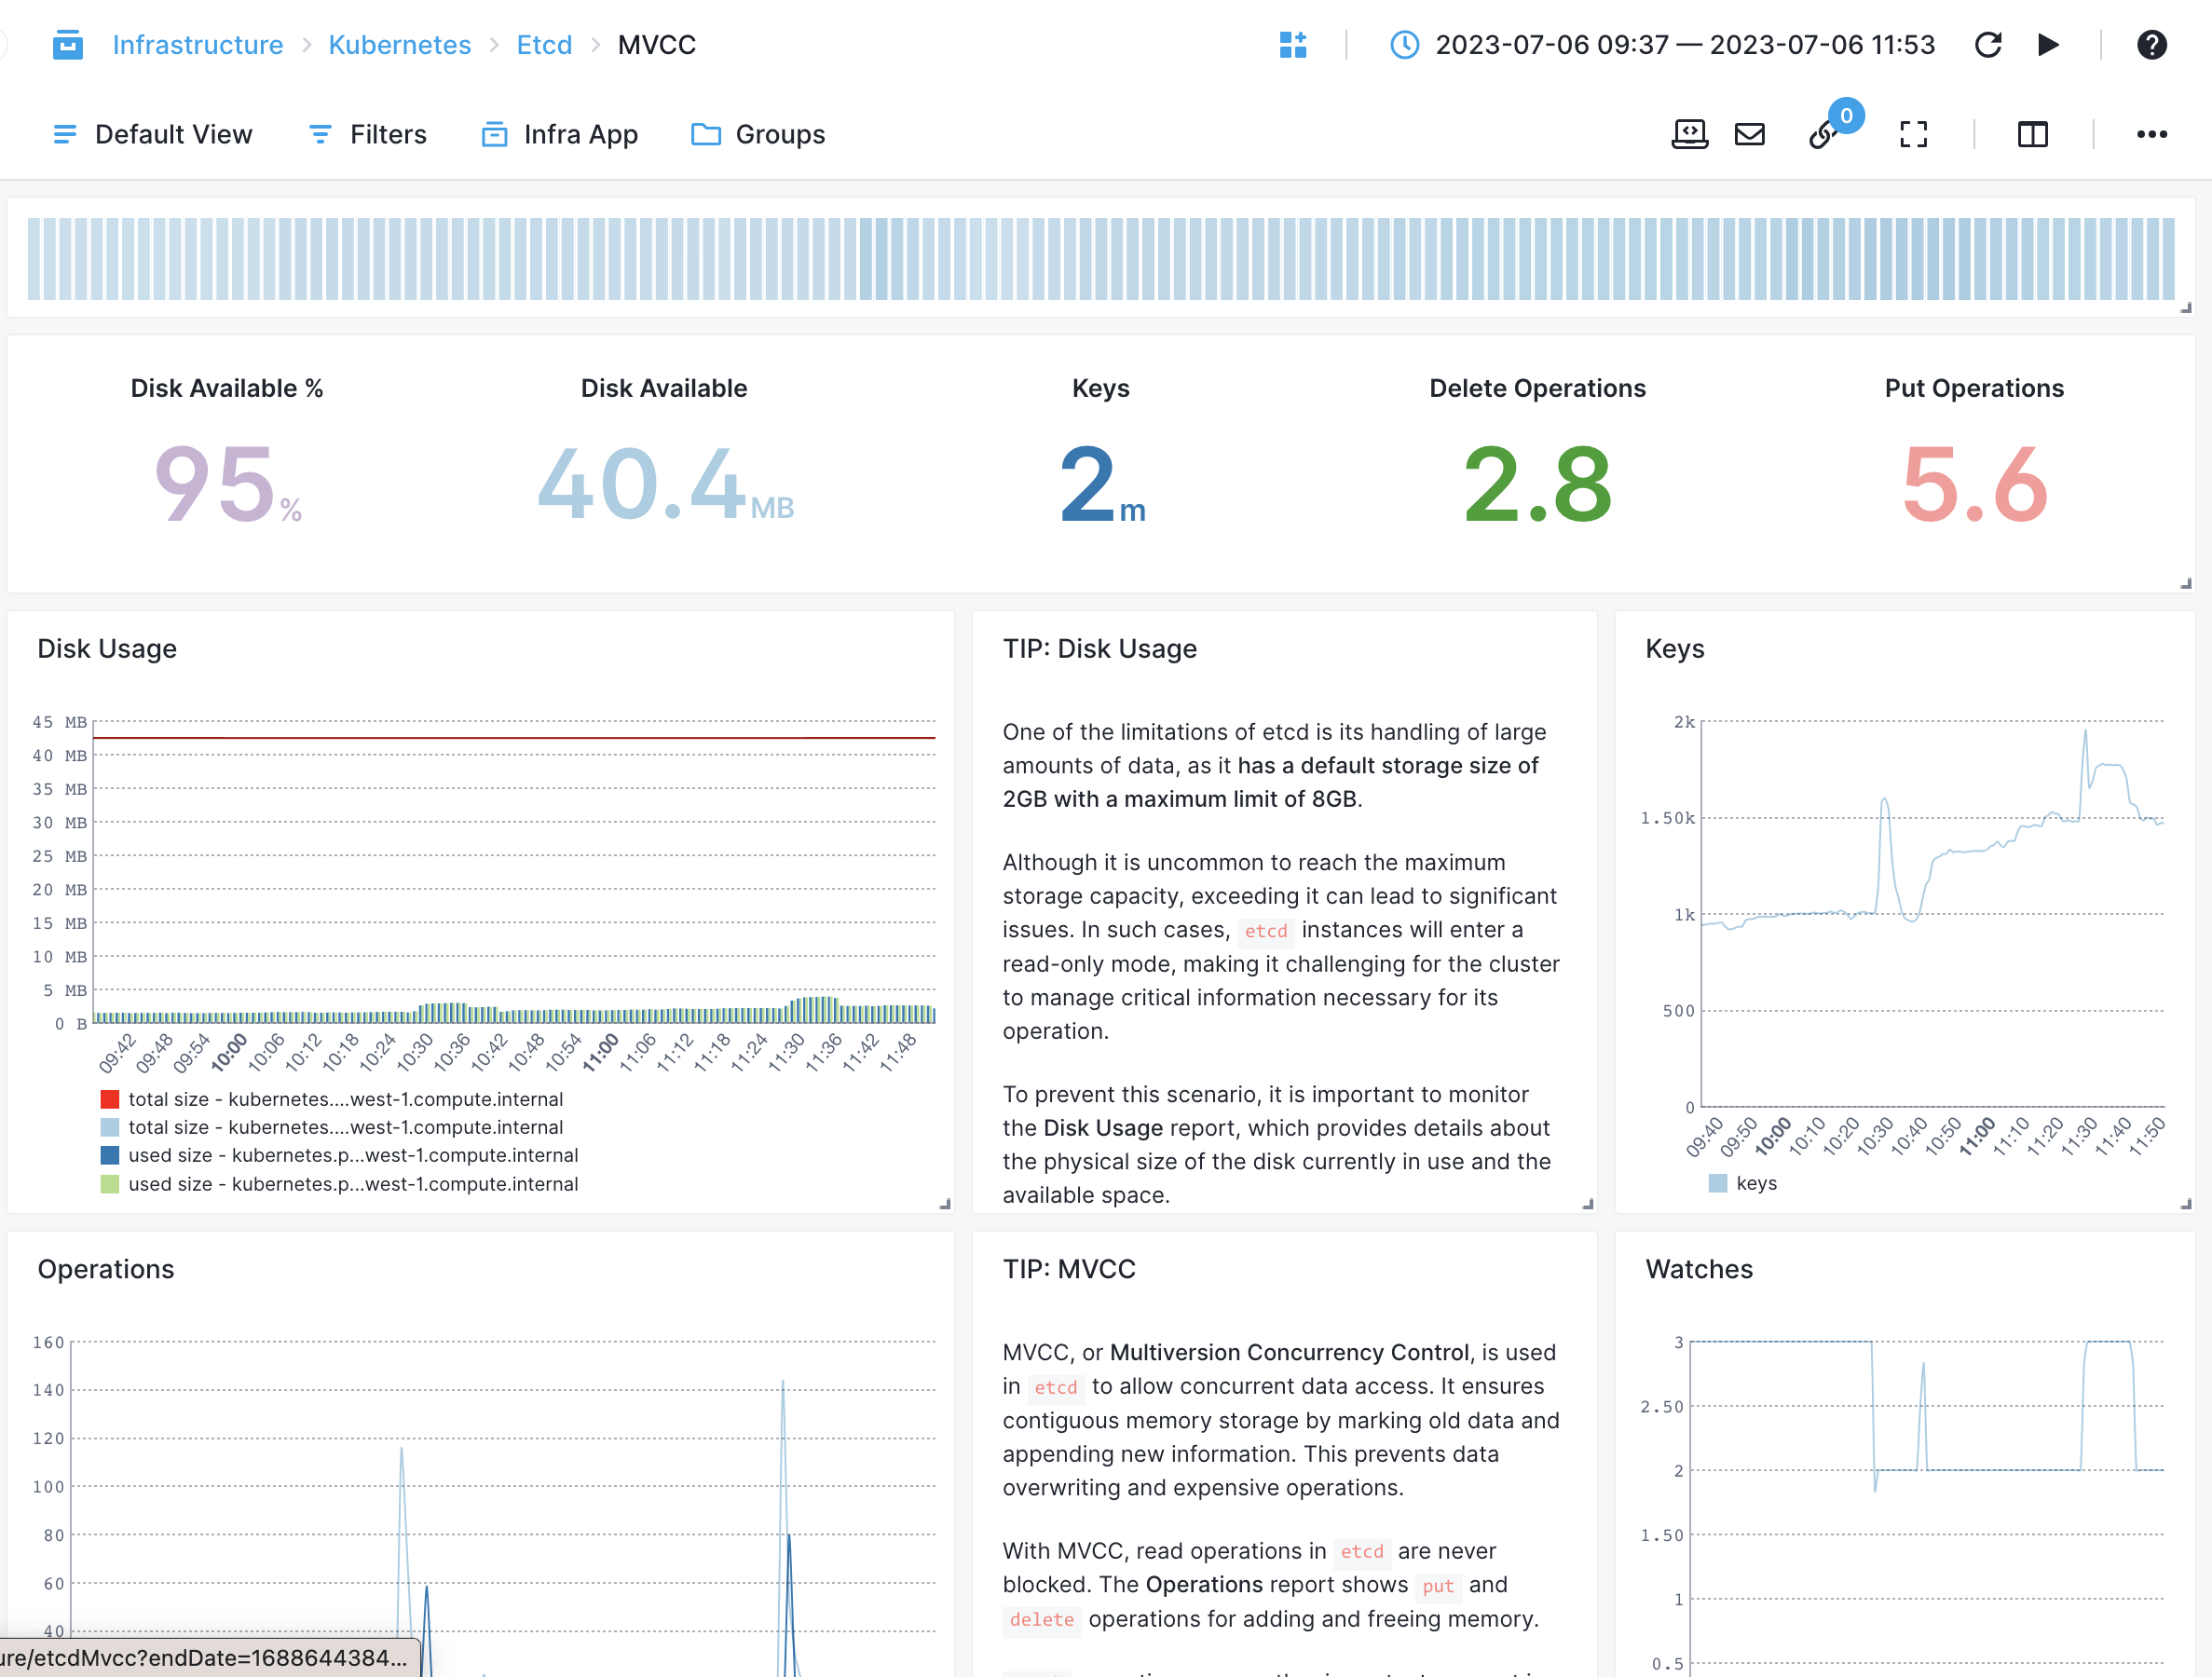
- Leader Changes - Tracks the number of times the etcd cluster leadership changes
- Disk Space Usage - Monitors the amount of disk space used by etcd
- WAL Write Latency - Measures the latency of write operations to the etcd Write-Ahead Log (WAL)
- WAL Snapshot Latency - Measures the latency of taking snapshots of the etcd Write-Ahead Log (WAL)
- WAL Commit Latency - Measures the latency of committing changes from the etcd Write-Ahead Log (WAL) to the database
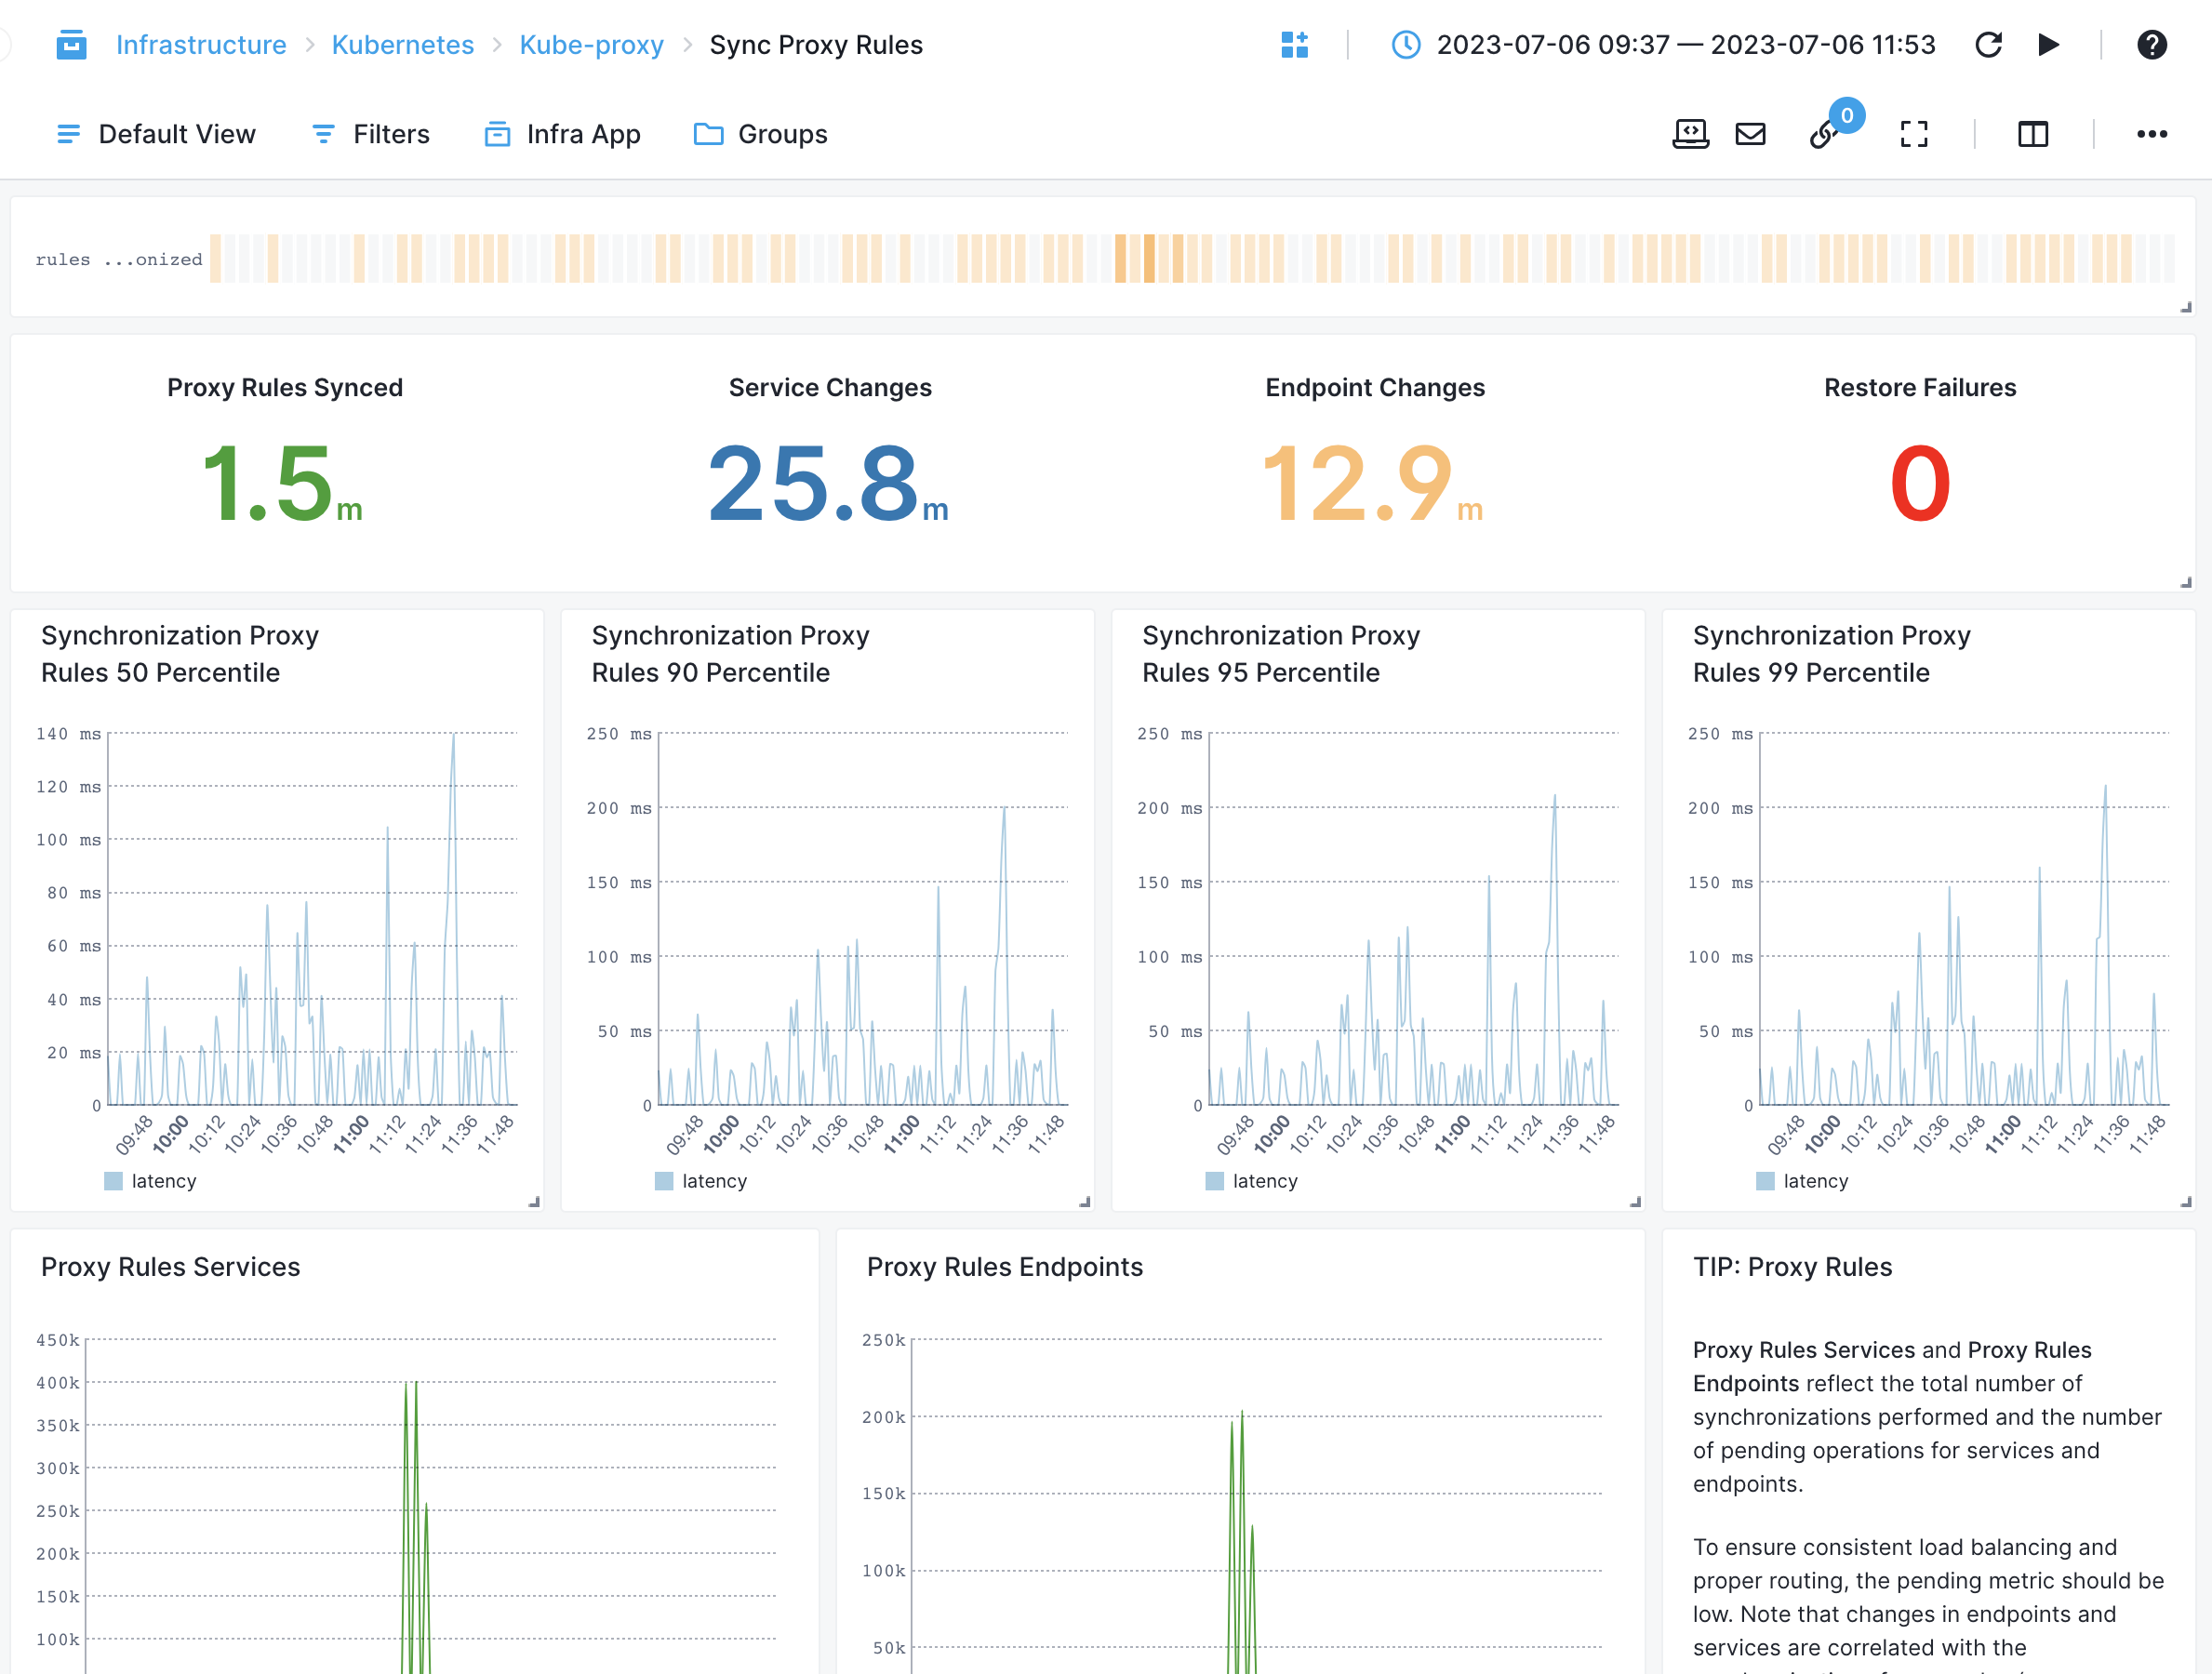
kube-proxy
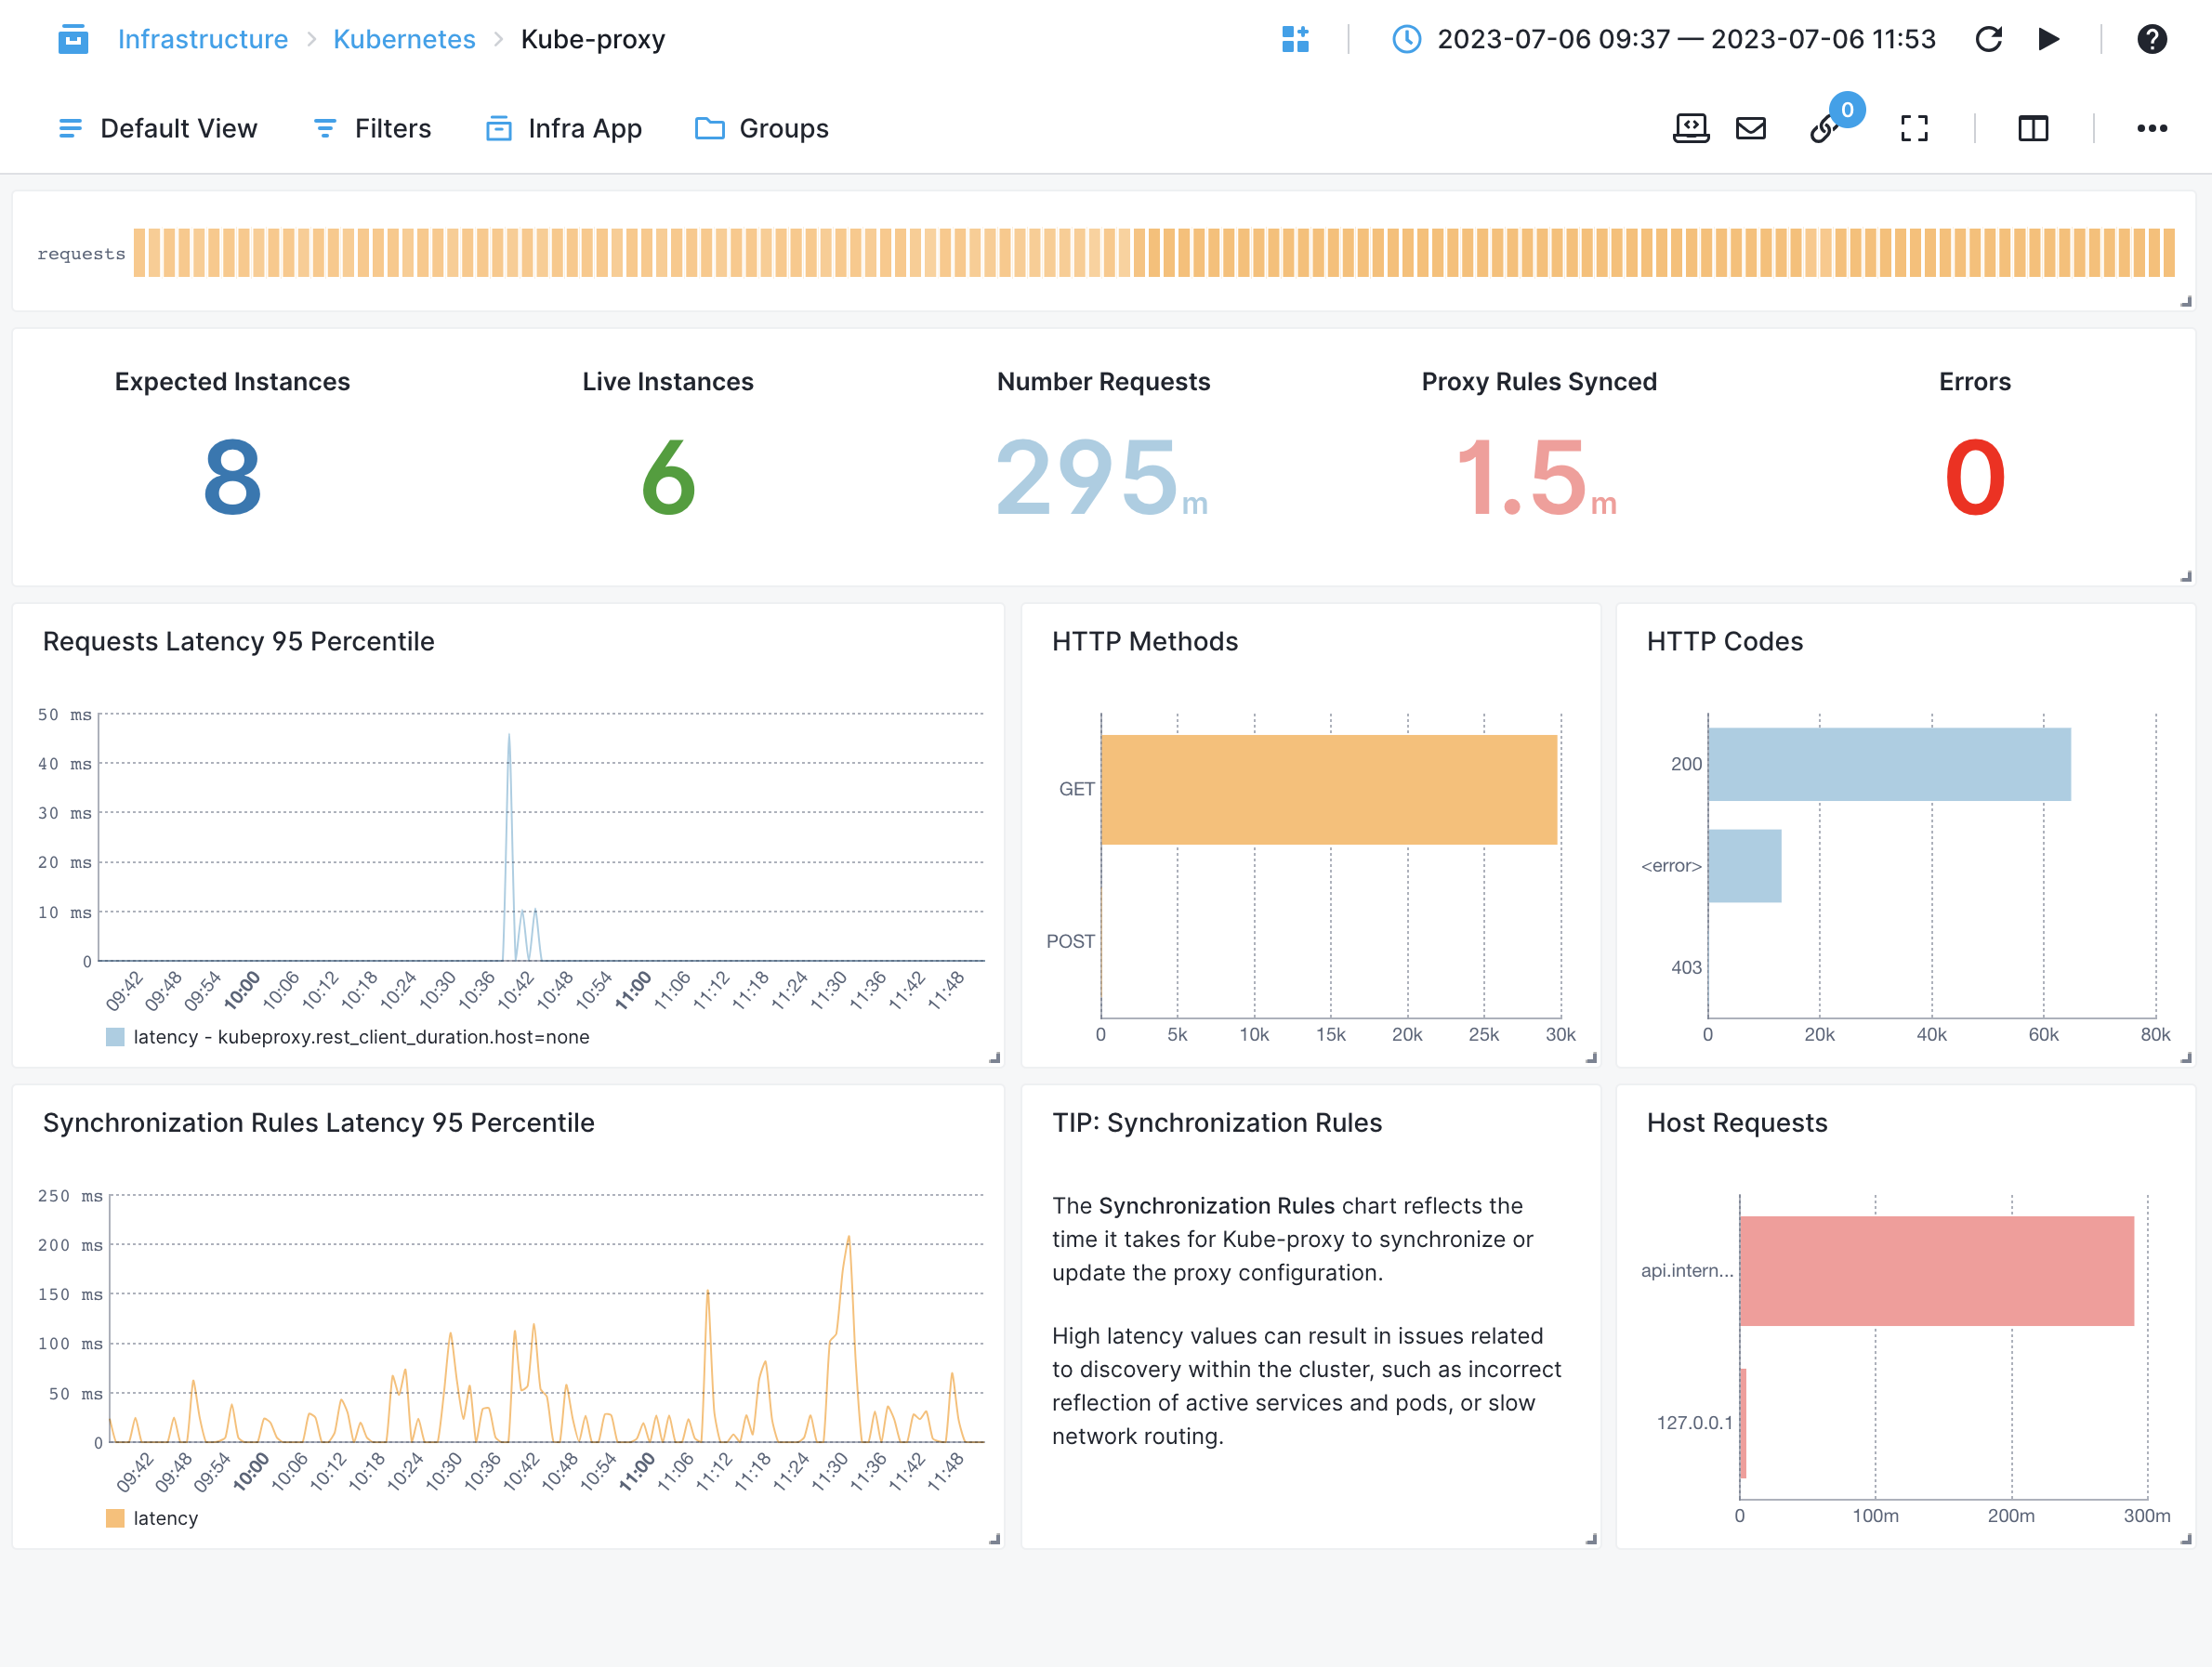
- Service Changes - Tracks the number of changes in services detected by kube-proxy
- Endpoint Changes - Tracks the number of changes in endpoints detected by kube-proxy
- Synchronization of Proxy Rules - Measures the time taken to synchronize proxy rules for services
- Request Latency by Host, HTTP Method, Path - Measures the latency of requests proxied by kube-proxy, categorized by host, HTTP method or Path
Scheduler
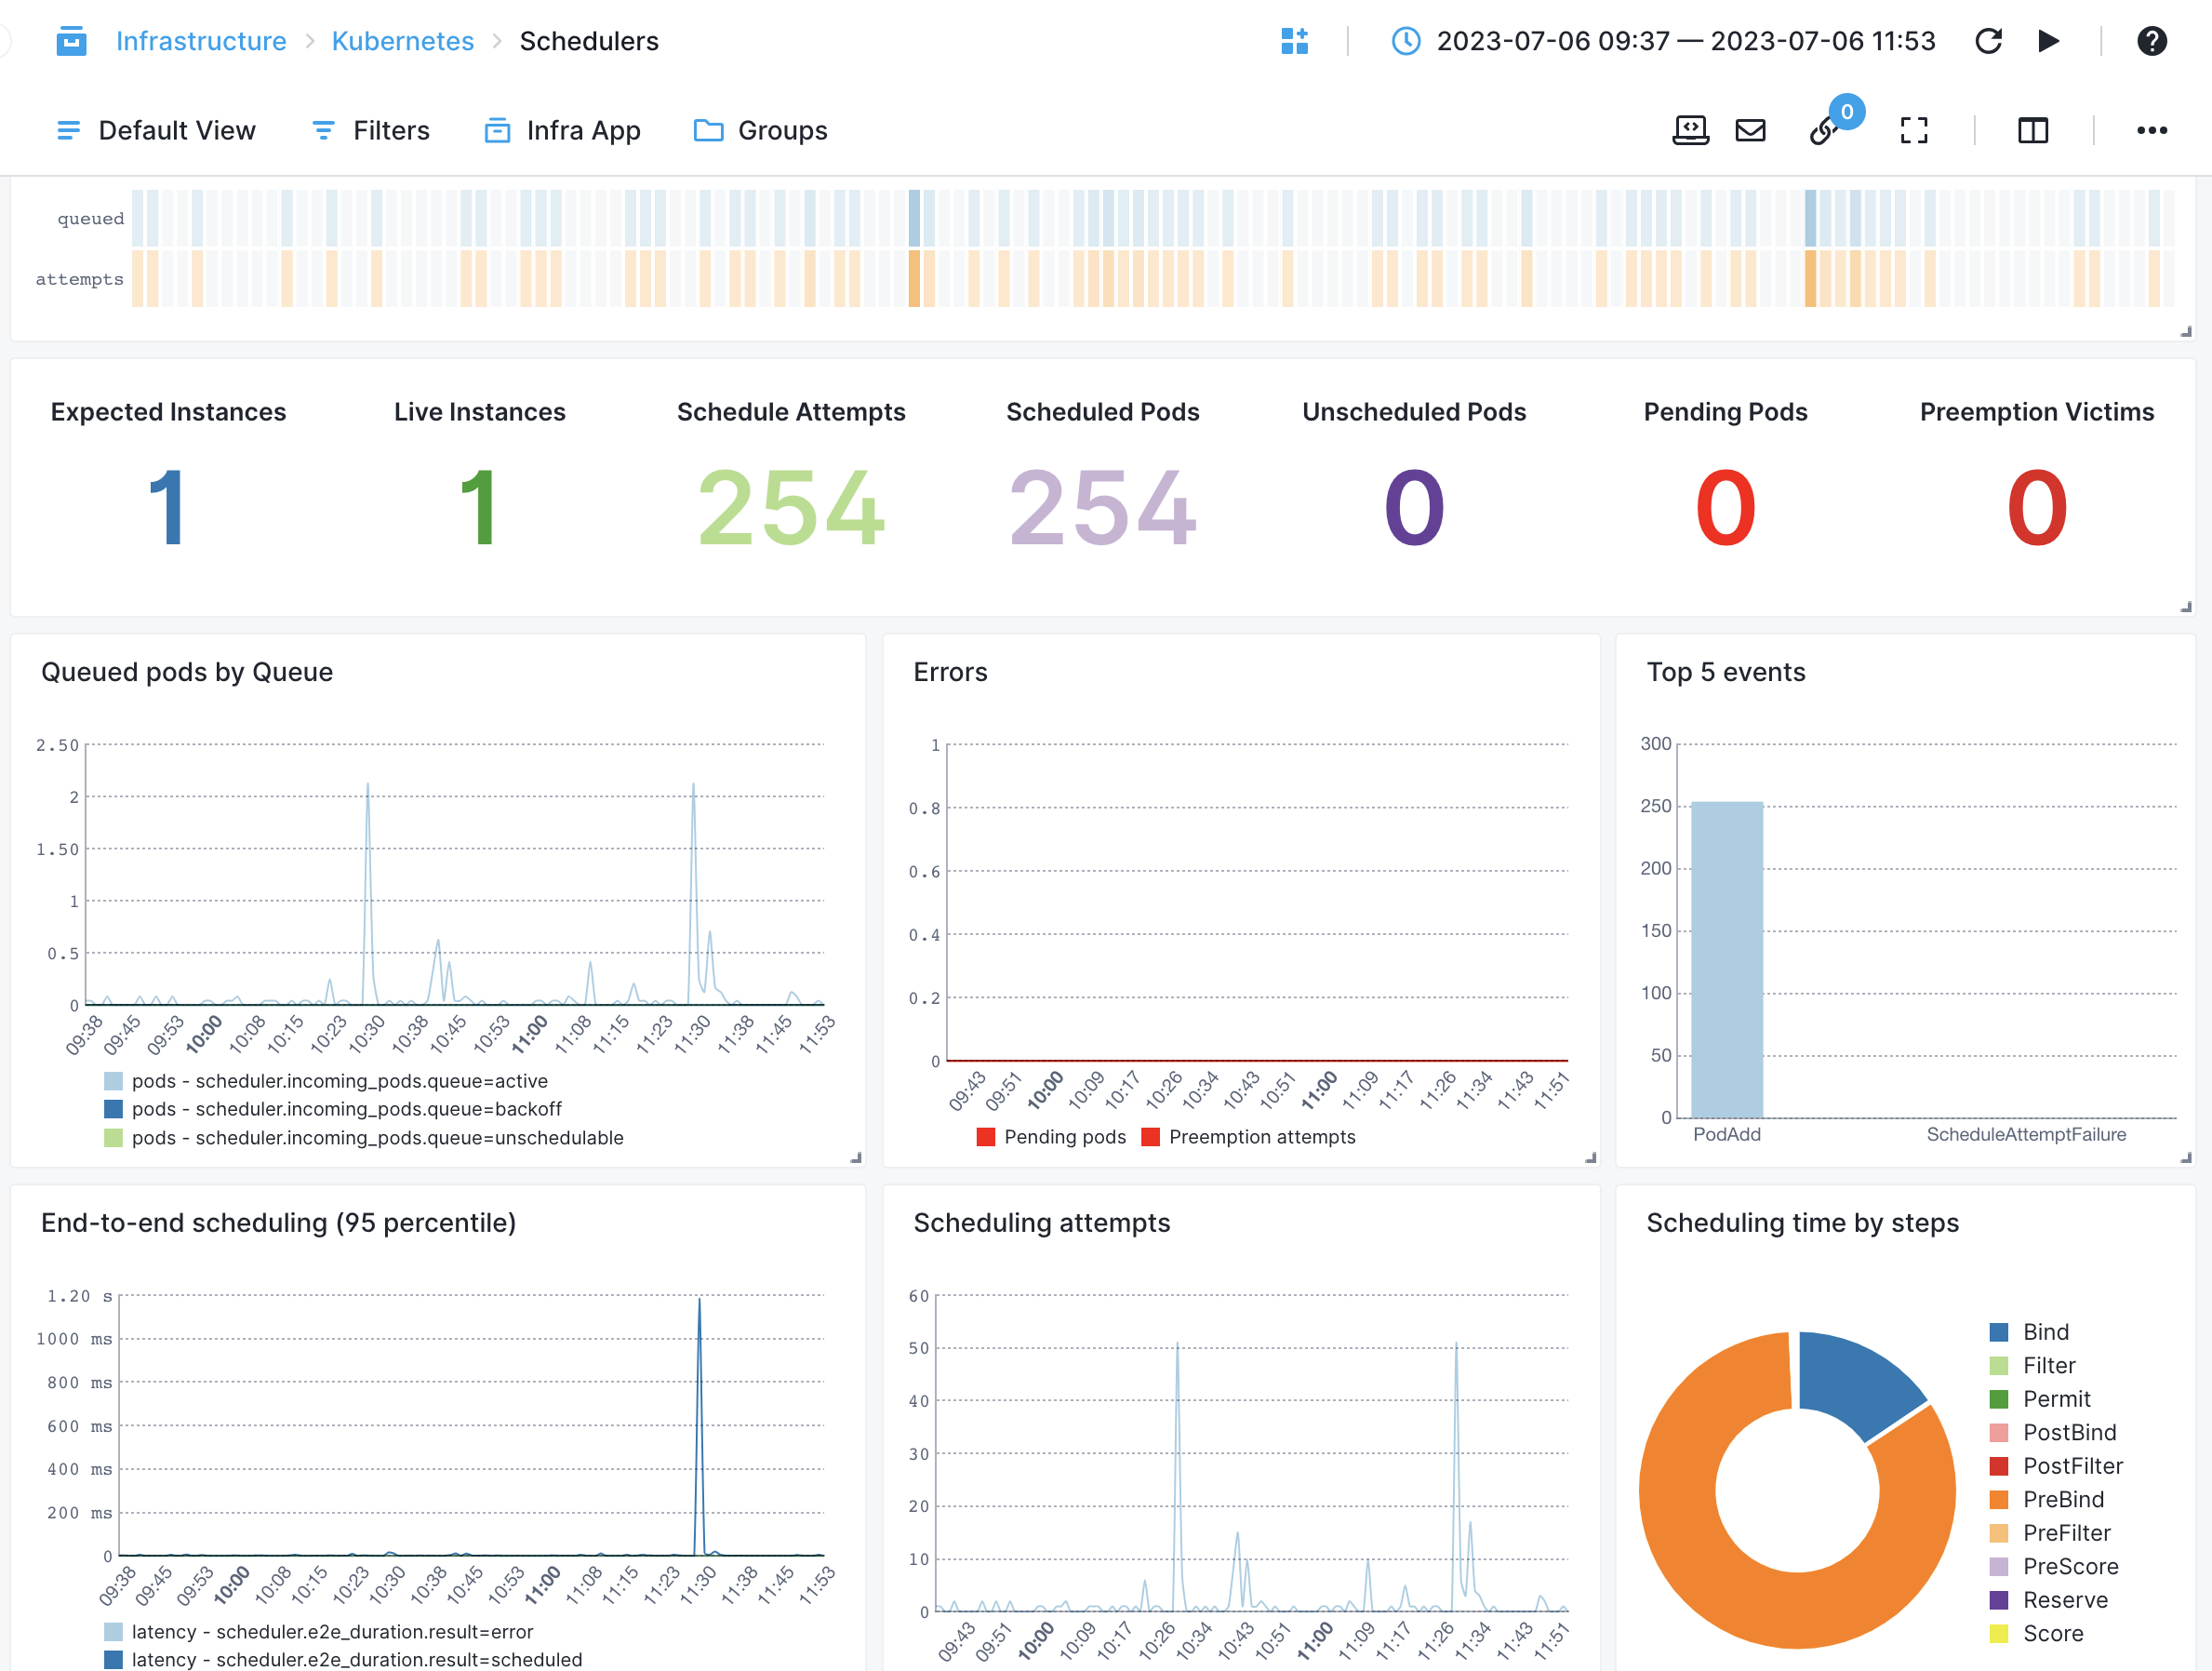
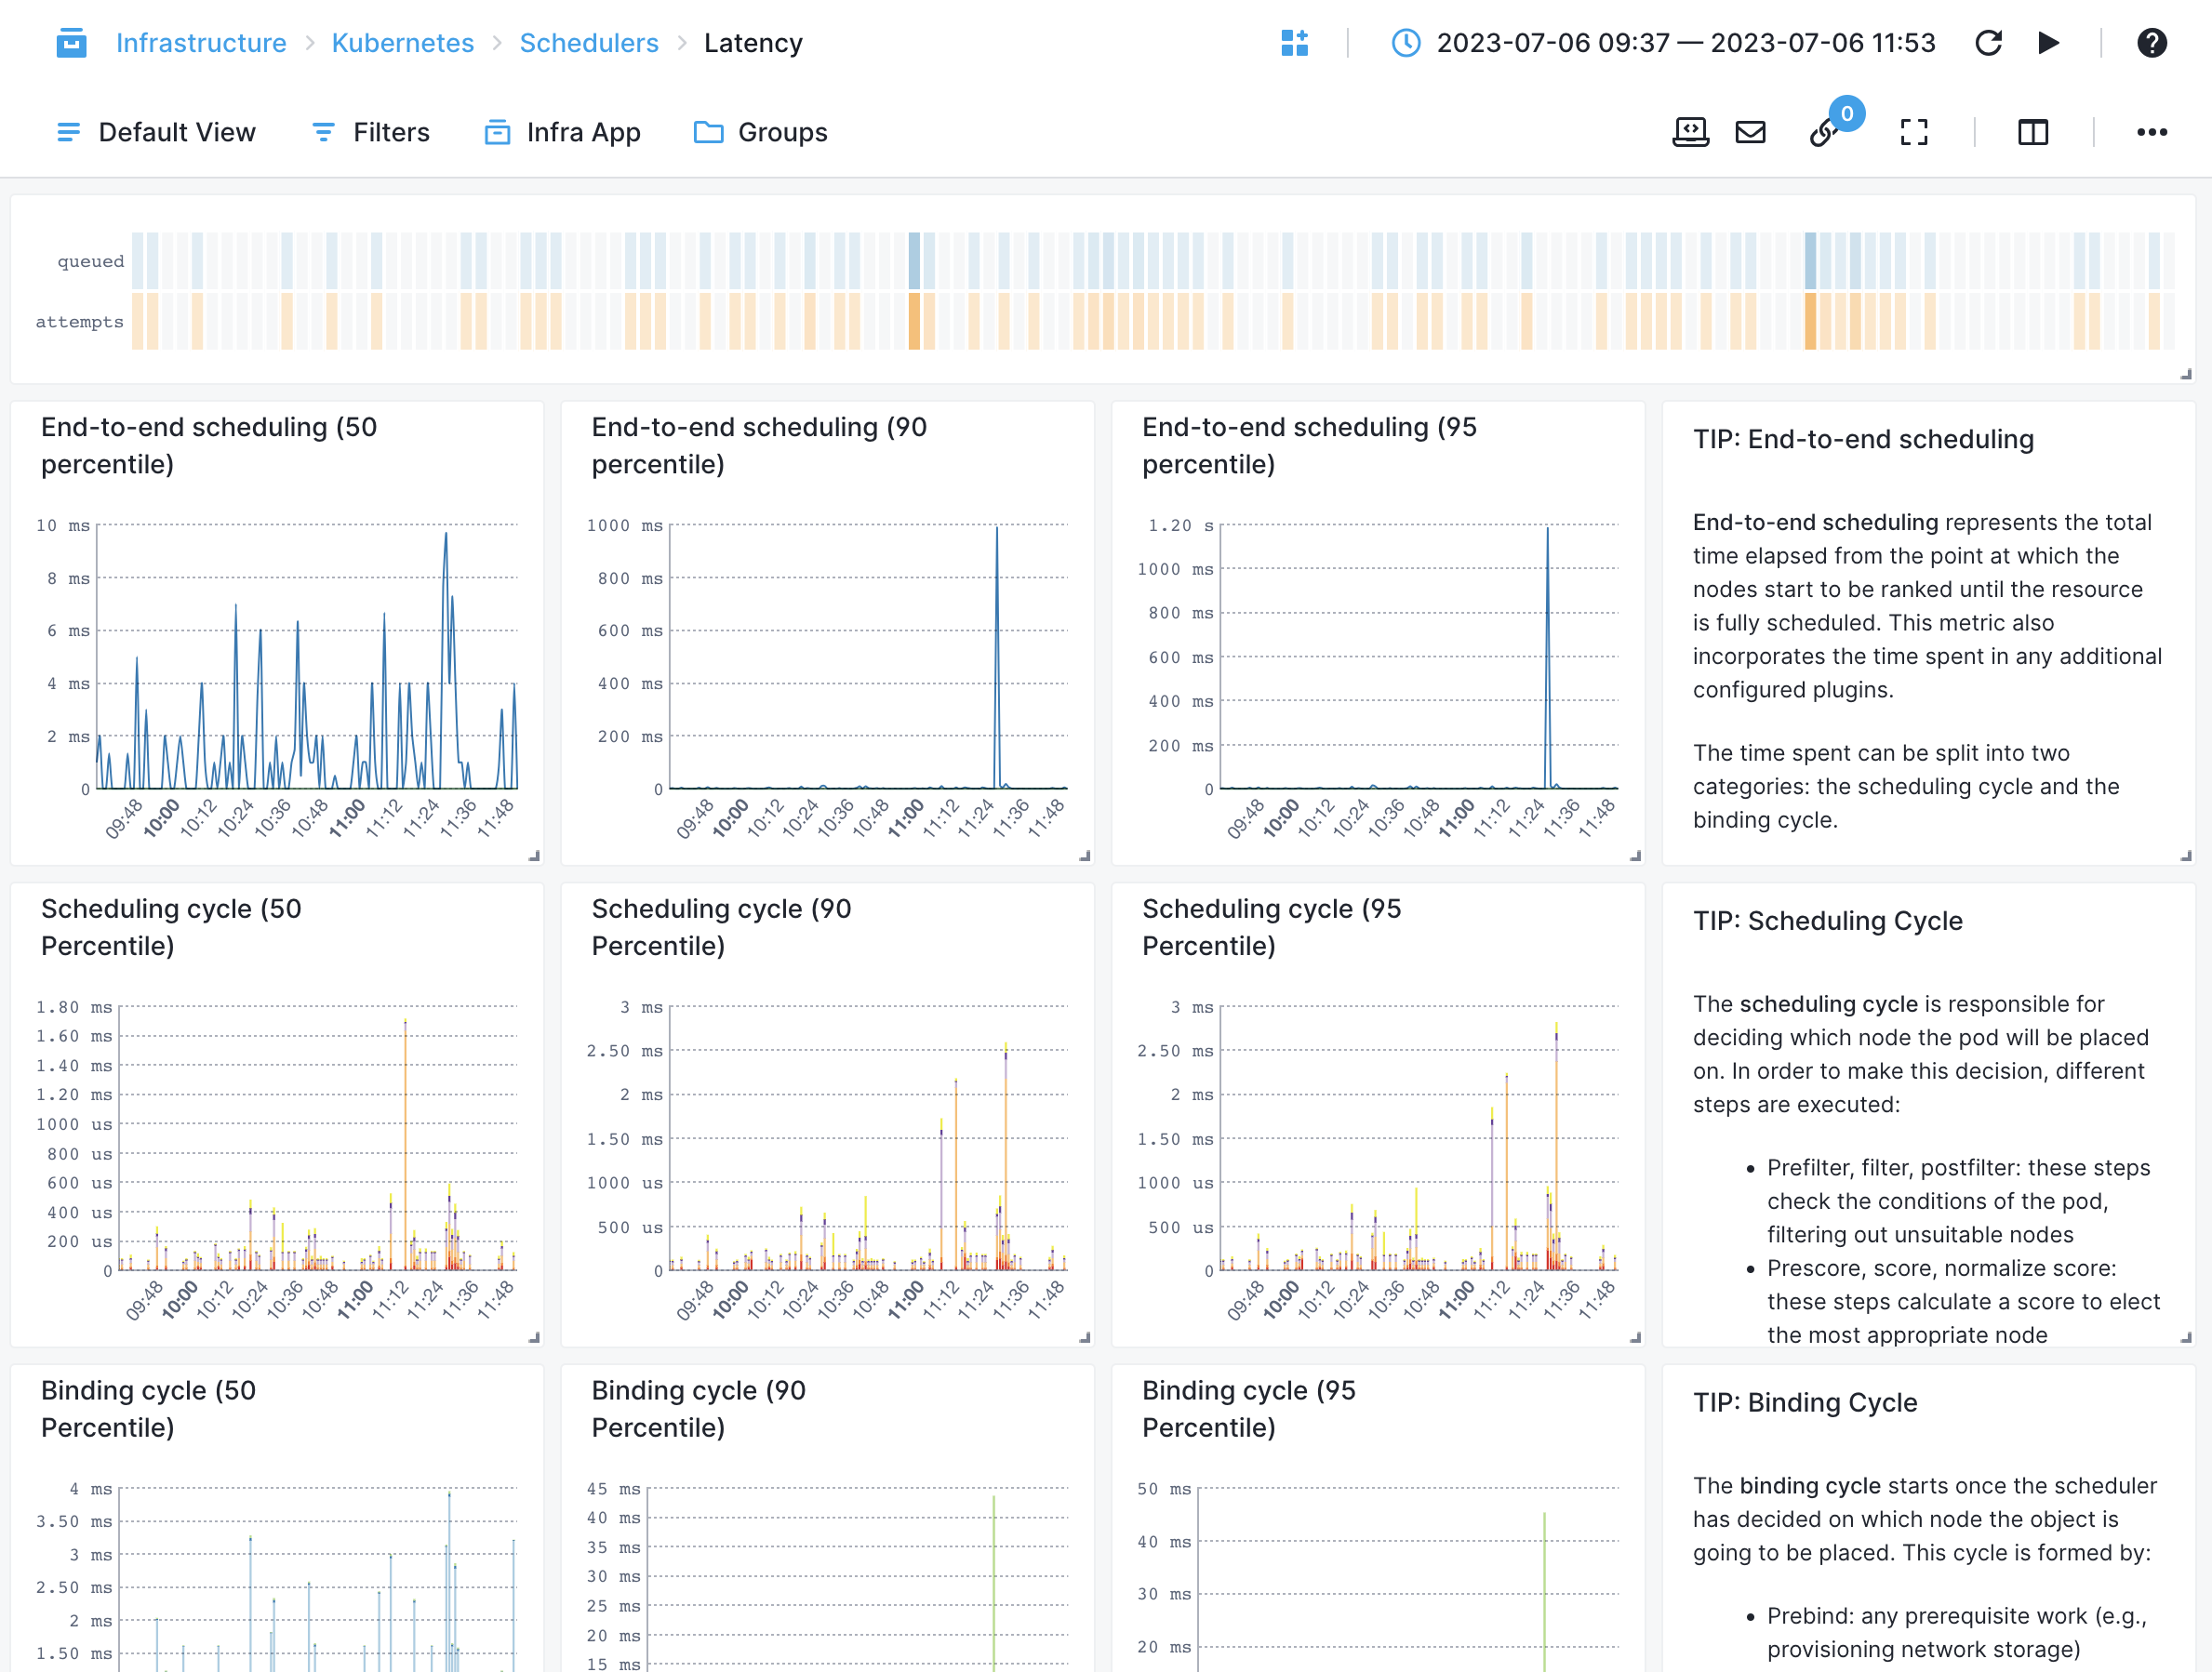
- Scheduling Latency by Attempts - Measures the scheduling latency for pods based on the number of attempts made
- Failed Scheduling Attempts - Monitors the number of failed pod scheduling attempts
- Queued Pods by Queue - Tracks the number of pods currently in the scheduler's queue, categorized by the queue name
- Unschedulable Pods - Tracks the number of pods that cannot be scheduled due to resource constraints
Workload Metrics
Pods
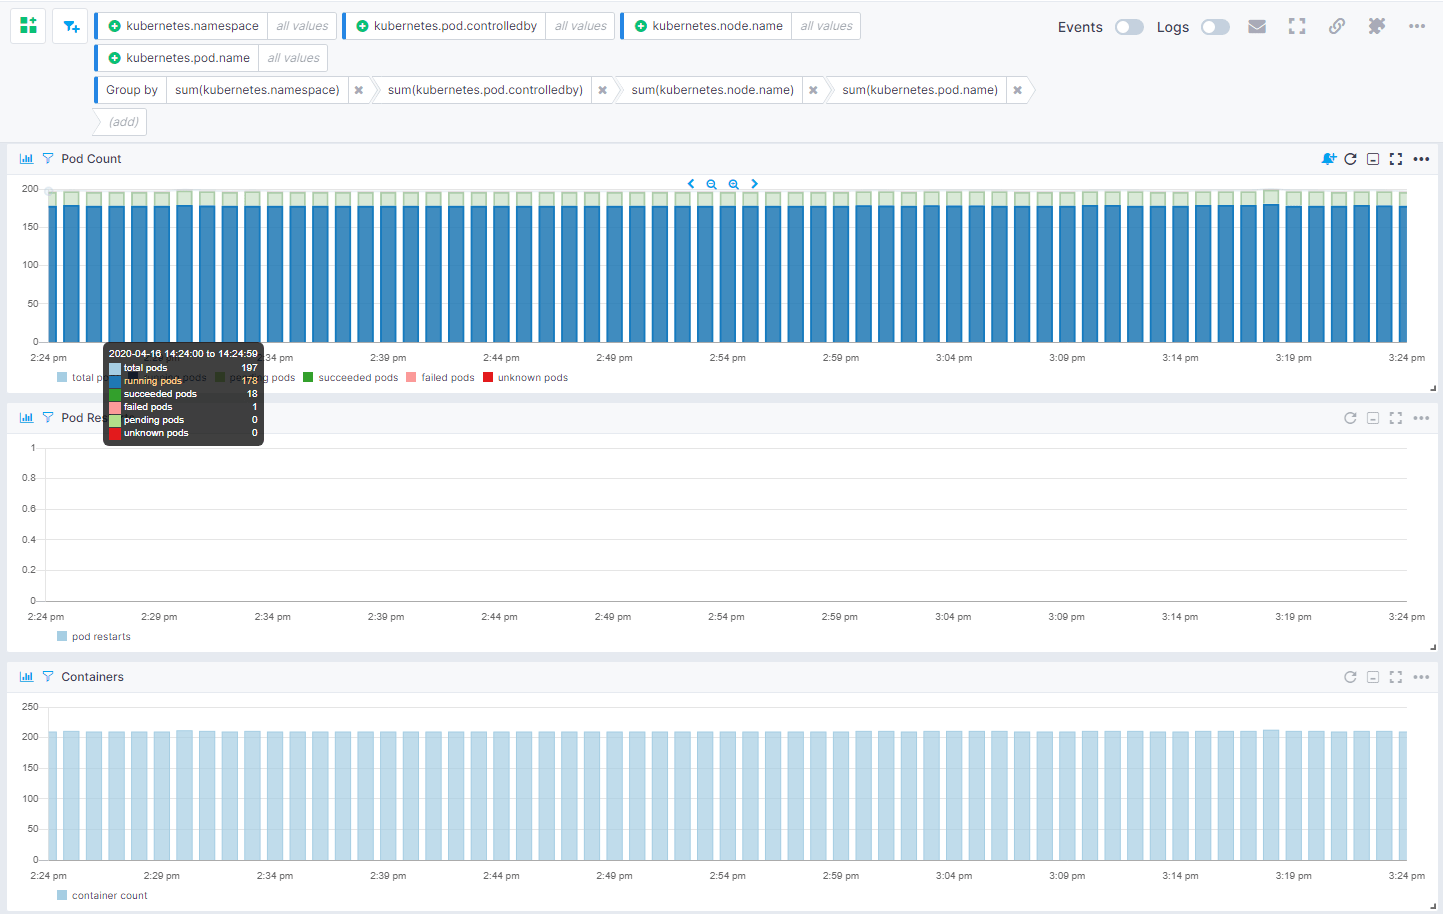
- Pod count - The total nodes in the cluster
- Pod restarts - The total number of pods scheduled across nodes
- Containers count - The total number ofcontainers
- Succeeded pods - The number of pods that are successfully scheduled
- Failed pods - The number of failed pods
- Unknown pods - The number of pods that are in unknown state
- Pending pods - The number of pods in pending state
- Running pods - Reflects the current number of running pods
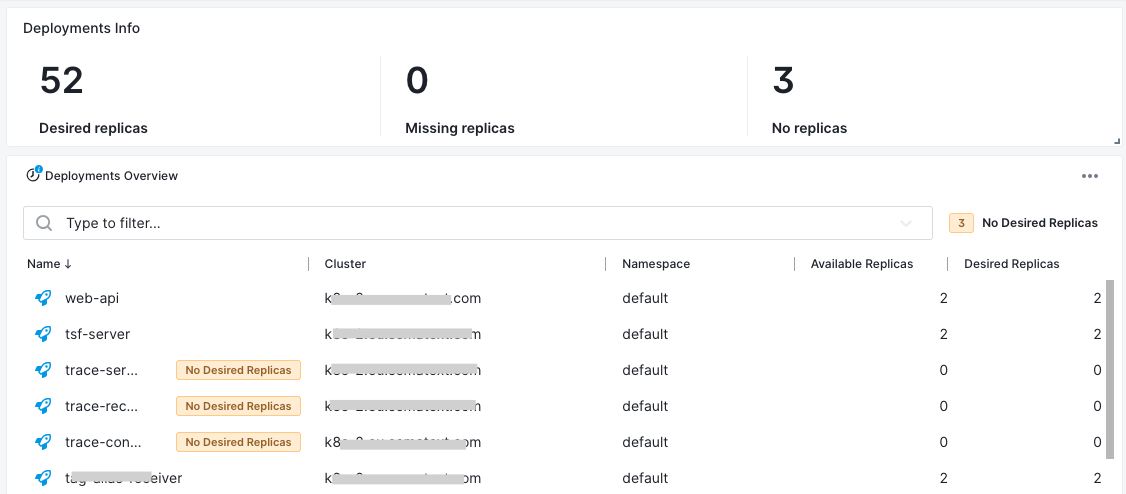
Deployments
- Current replicas - The number of active deployment replicas
- Available replicas - The number of pod instances targeted by the deployment
- Desired replicas - The number of non-terminated pods targeted by the deployment that have the desired template specification
DaemonSets
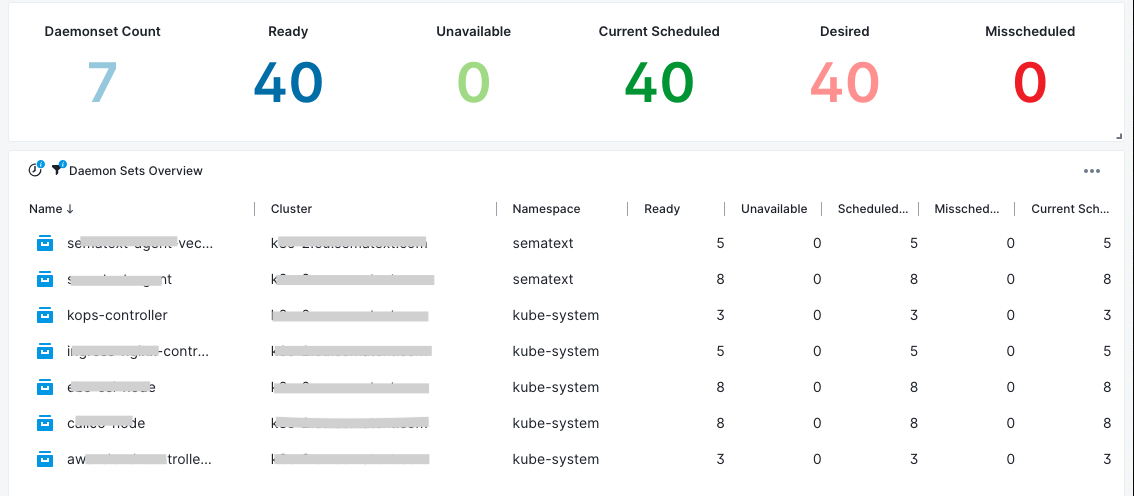
- Available DaemonSets - Number of nodes that should be running the daemon pod and have one or more of the daemon pod running and ready
- Scheduled DaemonSets - Number of nodes that are running at least one daemon pod and are supposed to run the daemon pod
- Desired DaemonSets - Number of nodes that should be running the daemon pod (including nodes correctly running the daemon pod)
StatefulSets
- Desired Replicas - Number of desired replicas
- Current Replicas - Number of Pods created by the StatefulSet controller from the StatefulSet version indicated by currentRevision
- Ready Replicas - Number of Pods created by the StatefulSet controller that have a Ready Condition

Jobs and CronJobs
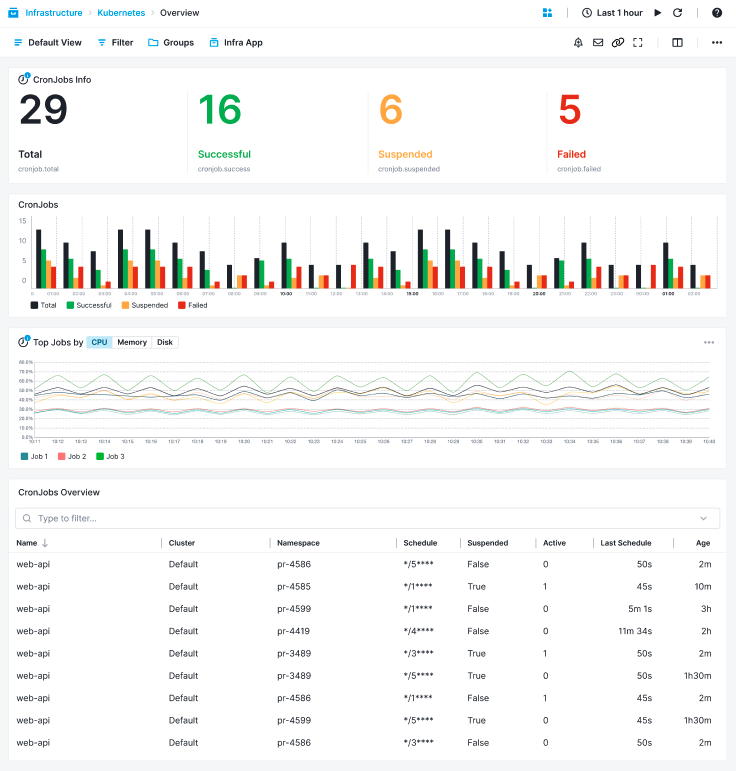
- Schedule - Cronjob schedule setup
- Last Scheduled - Cronjob last time scheduled timestamp
- Successful / Failed - Defines if the cronjob is successful or not
- Suspended - Defines if the cronjob is suspended or not
- Job Condition - Job finish condition, completed: 2, failed: 0 or suspended: 1
- Job Executions - Number of job executions
- Job Failures - Number of job failures
- CronJob Name - Name of cronjob thata the job belongs to
CPU, Memory, Storage and Network Metrics
CPU Metrics
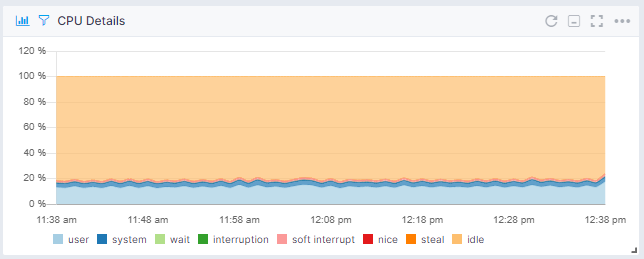
- Cpu usage - The container CPU usage in %
- Throttled time - The total amount of time that processes have been throttled in the container cgroup
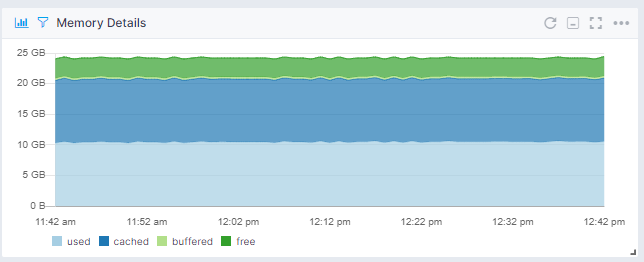
Memory Metrics
- Memory fail counter - The number of times that memory cgroup limit was exceeded
- Memory limit - Designates the max allowed memory limit for the container cgroup
- Memory pages in - The number of events each time the page is accounted to the container cgroup
- Memory pages out - The number of events each time a page is unaccounted from the container cgroup
- Memory pages fault - Represents the number of page faults accounted the cgroup
- Swap size - The number of bytes of swap usage
Storage Metrics
- Read bytes - The number of bytes read from the disk
- Read time - The total amount of time (in nanoseconds) between read request dispatch and request completion
- Read wait time - The total amount of time the read I/O operations for the container spent waiting in the scheduler queues
- Write bytes - The number of bytes written to disk
- Write time - The total amount of time (in nanoseconds) between write request dispatch and request completion
- Write wait time - Total amount of time the write I/O operations for the container spent waiting in the scheduler queues

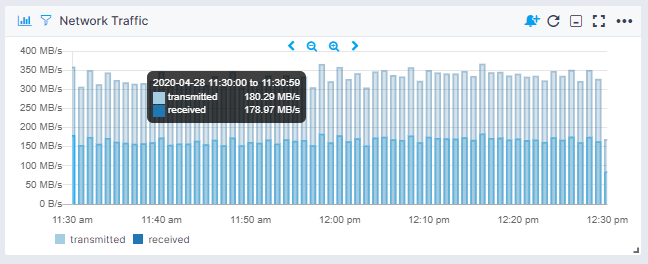
Network Metrics
- Received bytes - Received amount of bytes on the network interface
- Received packets - Received amount of packets on the network interface
- Received errors - Received amount of errors on the network interface
- Dropped ingress packets - The amount of dropped inbound packets on the network interface
- Transmitted bytes - Transmitted amount of bytes on the network interface
- Transmitted packets - Transmitted amount of packets on the network interface
- Transmitted errors - Transmitted amount of errors on the network interface
- Dropped egress packets - The amount of dropped outbound packets on the network interface
Kubernetes Alerts
As soon as you create an Infra App, Sematext automatically creates a set of default alert rules based on pre-defined conditions in important Kubernetes metrics. That way you get notified when Pods are restarted, there are missing replicas in your Kubernetes deployments, etc. Below you can see a list of default alert rules for Kubernetes monitoring:
- High CPU limit usage: Receive notifications when CPU limit usage is exceeded, preventing CPU overloads
- CPU limit usage reached: Detect when CPU utilization is high and close to the CPU limits. Potentially the system will throttle the CPU usage when it is over the limit and we want to avoid that
- High etcd leader change: Monitor leadership changes in your Kubernetes etcd cluster
- Kubelet Volume Manager unavailable: Stay informed about issues with the Kubernetes kubelet volume manager
- Kubelet Volume Manager “actual” value is zero: Receive alerts when the kubelet volume manager's “actual” value is zero
- API Server 4XX errors: Detect 4XX errors in your Kubernetes API server
- API Server 5XX errors: Be aware of 5XX errors in your Kubernetes API server
- Node under pressure: Receive alerts when Kubernetes nodes are under excessive load
- Node CPU capacity anomalous: Be alerted to unusual CPU capacity issues on Kubernetes nodes
- Node memory capacity anomalous: Stay informed about memory capacity issues on Kubernetes nodes
- Missing replicas for deployments: Detect missing replicas for your Kubernetes deployments
- Missing Pod replica in StatefulSet: Get notified when pod replicas are missing in Kubernetes StatefulSets
- Pod status is failed: Receive alerts when pods in Kubernetes are in a "failed" state
- Pod status is unknown: Be alerted to pods in an "unknown" state in Kubernetes
- Pod status is pending: Monitor pending pods in Kubernetes
- Pod restart amount reached: Detect when pods are restarted beyond a specified threshold
- Pod status is “CrashLoopBackOff”: Be alerted to pods in a "CrashLoopBackOff" state in Kubernetes
- Pod status is “ImagePullBackOff”: Receive notifications when pods are in an "ImagePullBackOff" state in Kubernetes
- Pod state is waiting: Triggered when a pod remains in a waiting state for an extended period
- High Pod waiting state: Triggered when a pod remains in a waiting state for an unusually long time
You can create additional alerts on any metric.
Troubleshooting
If you are having trouble sending metrics, try out the latest version of the Sematext Agent. Additionally, make sure to check out the Agents Information panel for any errors, and refer to our Sematext Monitoring FAQ for useful tips.
Cluster Roles / RBAC Rules
In case you have trouble getting data in Kubernetes Master Components reports (e.g. Kubelet, Scheduler, kube-proxy, Etcd, CoreDNS) or some of the Workloads reports (e.g. DaemonSets, StatefulSets), make sure that RBAC is enabled in your cluster. Also you'll need to update your RBAC rules configuration:
kubectl Installation
Helm Installation
Also, please make sure that your agent is up to date.
Why we need hostNetwork access and how to turn it off if desired
Check out our page about hostnetwork.
Setting TLS Certificate Paths
While monitoring Kubernetes master components, the Sematext Agent will automatically retrieve certificates from the host machine.
However, if the necessary paths are not present within the common paths, some additional configuration will be needed to enable querying of the metrics endpoints.
If the default TLS paths are not applicable, you can specify the correct paths using the Kubernetes environment variables. These configurations can be directly placed within the DaemonSet configuration as shown below: