Registration is open - Live, Instructor-led Online Classes - Elasticsearch in March - Solr in April - OpenSearch in May. See all classes


Synthetics

See All Integrations

Synthetics

Monitor API Metrics and Uptime with Synthetics

Monitor availability and performance!

monitoringAPIweb

  • Ensure minimal downtime
  • Simulate business-critical user journeys
  • Actively monitor APIs, Web URLs, websites, and much more
  • Starts as low as $5/month

Get Started

Already have an account?
Sign in to get started.

Monitor API Metrics and Uptime with Synthetics

What you get

Find Performance Issues Faster

  • No agent installation is required
  • Monitors will be periodically scheduled to run from specified locations in an isolated environment
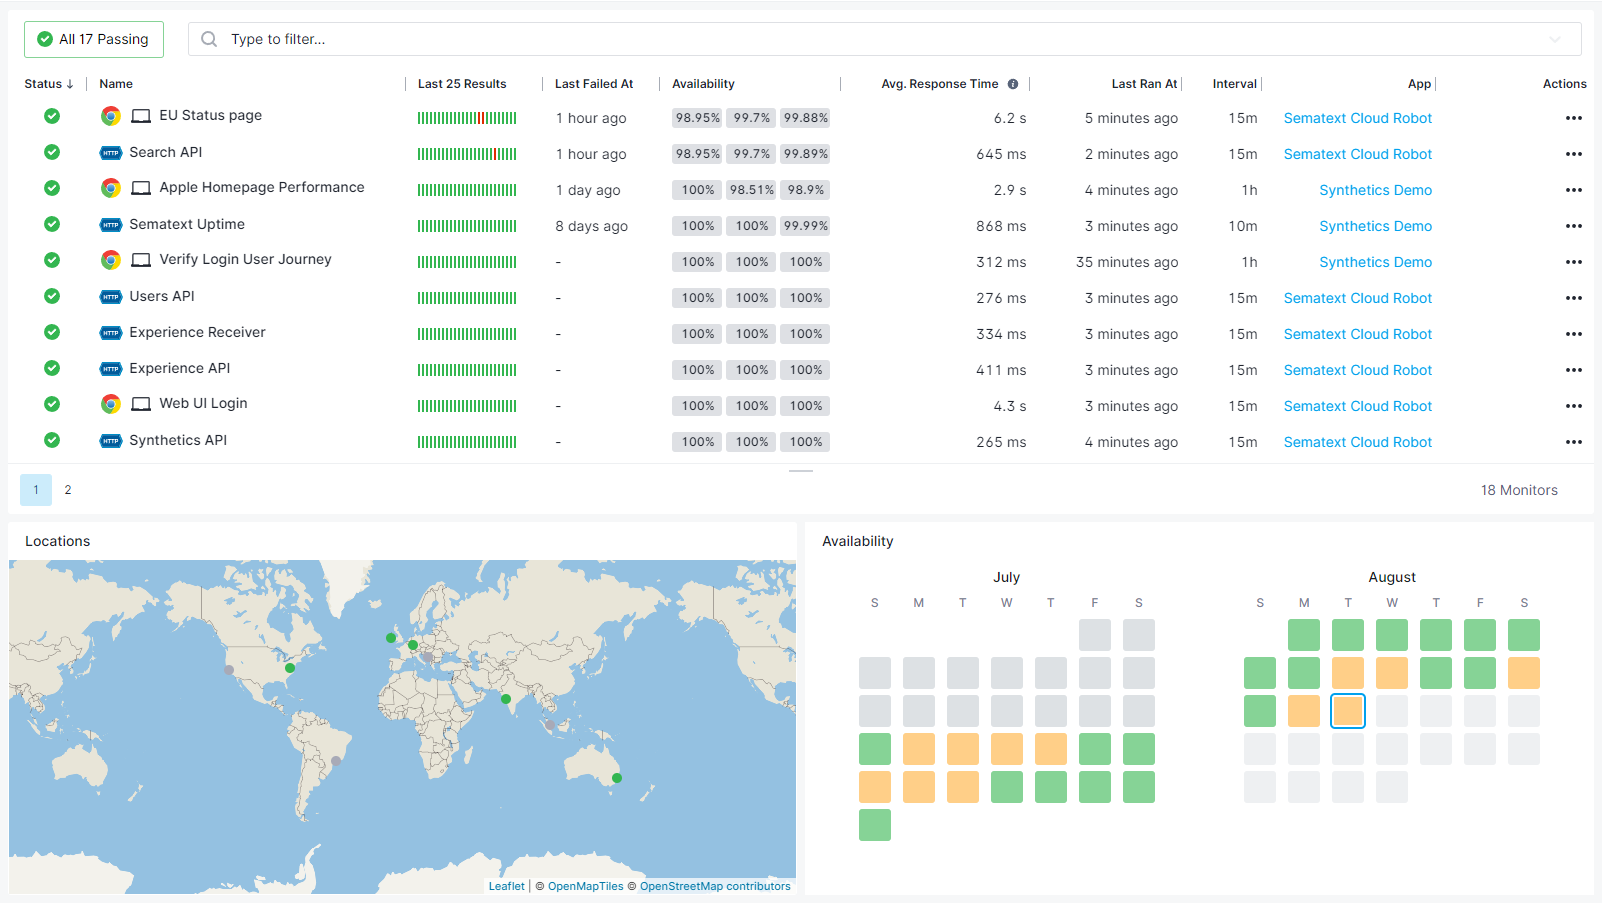
  • An HTTP monitor sends an HTTP request to the specified URL with configured request settings and records the timings and response details
  • Browser monitors can be used to monitor websites and user journeys by writing a script that simulates user actions
Find Performance Issues Faster( https://cdn.sematext.com/images/metrics-chart-error.png )

Installation

Get Started in Seconds

  • You point the Monitor at a URL. As simple as that!
  • No agents are required
  • Synthetics monitors can be scheduled to run from 8 different locations
  • Monitors have a list of conditions that decide if a run failed
Get Started in Seconds( https://cdn.sematext.com/images/install-agent.png )

Metrics

Real-Time Visibility into Your APIs and Websites

Key metrics include response times, DNS lookup times, Socket connect time, TLS handshake times, TTFB, TTFP, download times, including Web Vitals. Apart from performance metrics you also get page-load metrics that specify back-end and front-end times, including DOM load times and FP, FCP, LCP, and much more.
View the Synthetics docs for a detailed list of metrics!

    Real-Time Visibility into Your APIs and Websites( https://cdn.sematext.com/images/metrics-chart-red.png )

    Errors

    Troubleshooting Made Easy with Browser Errors

    The browser writes error logs in the console while loading the web pages. These can be JavaScript errors, network errors, and similar errors. Syntehtics collects these errors so you can debug run failures and troubleshoot issues.
    View the Synthetics Console Errors docs for a detailed explanation!

      Troubleshooting Made Easy with Browser Errors( https://cdn.sematext.com/images/logs-chart-red.png )

      Web vitals

      Gain Key Insights with Web Vitals

      Web Vitals are a set of performance metrics that are considered essential for improving user experience. They include Largest Contentful Paint (LCP), Total Blocking Time (TBT), Cumulative Layout Shift (CLS), First Contentful Paint (FCP), Time To First Byte (TTFB).
      View the Synthetics Web Vitals docs for a detailed explanation!

        Gain Key Insights with Web Vitals( https://cdn.sematext.com/images/logs-chart-red.png )

        Status pages

        Share the Status and Response Time of Your Services

        • Display the status of your services to your customers
        • Share status updates with your customers during planned maintenance or outages
        • Create a dashboard of service status to share across internal teams
        Share the Status and Response Time of Your Services( https://cdn.sematext.com/images/status-pages-visual+(1).png )

        Dashboards

        Benefit from Pre-Built Dashboards

        • Benefit from out-of-the-box dashboards with performance metrics and error logs
        • Add or remove components and charts in existing reports to customize dashboards
        • Add a new report page with your favorite metrics, charts, components, and filters
        • Combine metrics and logs to cut troubleshooting time in half
        Benefit from Pre-Built Dashboards( https://cdn.sematext.com/images/customized_dashboards_grey.png )

        Alerts

        Notify Your DevOps Team About Critical Issues

        • Get alerted on both metrics and user journeys
        • Invite team members. There is no limit on the number of users!
        • Share logs and metrics with your team using role-based access control
        Notify Your DevOps Team About Critical Issues( https://cdn.sematext.com/images/alerts-square-%20integration.png )

        Correlation

        Compare Any Two Reports in a Single View

        With Split Screen you can compare any two reports. Split Screen is available across the whole product and you can open any report with events, logs, or metrics for easy correlation.

          Compare Any Two Reports in a Single View( https://cdn.sematext.com/images/chart-correlation.png )

          Sematext Logs provides us a flexible, extensible and reliable means of monitoring all of our environments in real time

          Zach David Zach David
          Test Automation Lead – Healthgrades

          Just looking at the default graphs it was clear I can reduce my serverless resource usage on Vercel by 90%, by reducing the allocated memory. Sematext simply turns your logs in actionable data, out of the box. Costs, performance, it's all there

          Andrei Vreja Andrei Vreja
          Maker, iForge

          Sematext shows one unified view for all of our Docker log, events, and metrics!

          Ben Reichter Ben Reichter
          DevOps Engineer, Tozny

          Sematext is great for monitoring SolrCloud, with out of the box dashboards and easy to setup alerts

          Chris George Chris George
          Manager, VIPConsult

          We looked into running our own Elastic Stack, and quickly realized that was a job and specialty within itself. We are a small startup and every dollar counts. Wasting precious and expensive sysadmin time on managing things far out of our project scope really isn’t an option

          Zach Aufort Zach Aufort
          CEO, BlockGen