Logs
After following the SDK-specific instructions, your logs will automatically have useful metadata in every log.
Common fields include:
service.name- Your applications's nameservice.version- Your applications's versiondeployment.environment- Where it's running (dev, prod, etc.)os.host- Server namecontainer.name- Docker container nametrace.idandspan.id- Identifiers that connect a log entry with a specific trace or span. These fields are useful because they allow you to start from a trace or span and then find the related logs to see detailed context about what happened during that request.
Once data is in, you can explore it via the built-in reports:
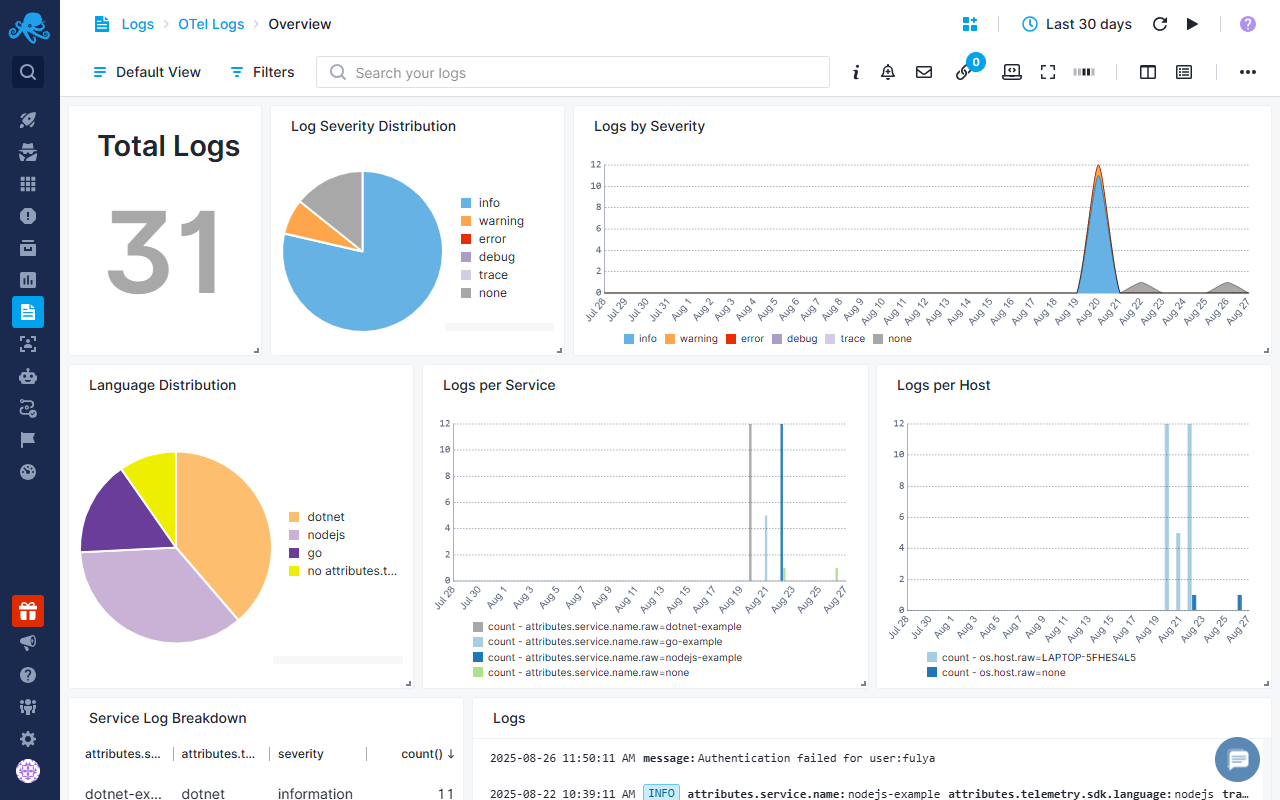
Overview Report
Overview report provides a view of your system's state/status/health with visual analytics including total log counts, severity distribution (info, warning, error, debug, trace), SDK breakdown, service-by-service activity monitoring, host distribution analysis, and timeline visualizations showing activity patterns over time. You can drill down from these visualizations to investigate issues and understand how your system behaves across services and environments.
Explore Report
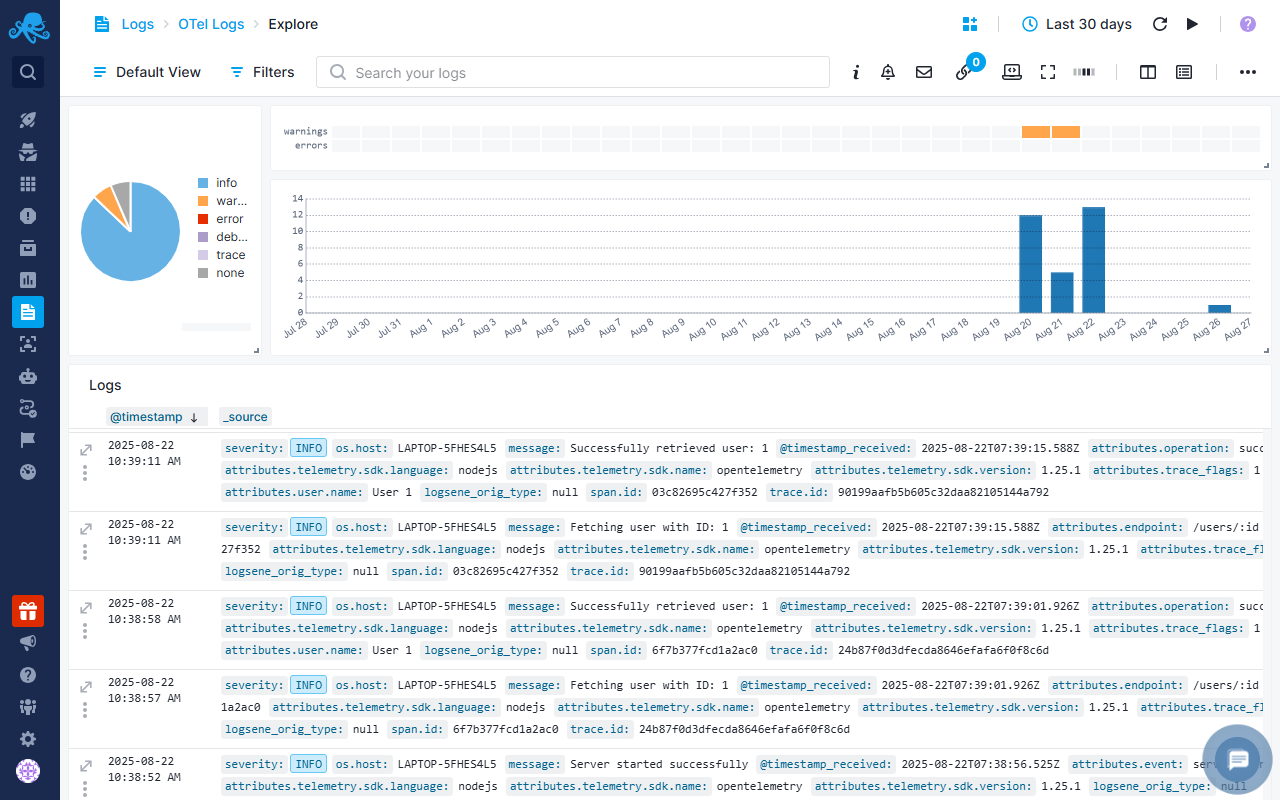
Explore report lets you see raw logs. Here you can use Quick Actions such as creating alerts, adding logs to dashboards, or applying filters. You can save common queries as Saved Views for faster access later. You can also correlate logs with Events such as deployments, scaling actions, or configuration changes to understand when and why issues started. This makes troubleshooting faster because you can connect changes in your system directly with the log activity they caused.
Default Log Alerts
Moreover, the pre-configured alert rules will notify you about:
- Anomaly alerts: Alerts when there are abnormal spikes or dips in error and warning logs
- Service Heartbeat Alert: Alerts when a service stops sending logs for an extended period, indicating the service may have crashed, been terminated, or lost connectivity.
- Infrastructure Resource Exhaustion Alert: Alerts on critical resource exhaustion events by detecting keywords indicating system limits have been reached. Triggers immediately on memory, disk, or connection pool depletion to enable rapid intervention before complete service failure.
- Authentication Attack Detection Alert: Alerts on potential brute force or credential stuffing attacks by monitoring failed authentication attempts.
- Database Connectivity Issues: Alerts on database connection problems and query failures that could indicate database server issues, network problems, or connection pool exhaustion. Early detection prevents cascading application failures when database connectivity is degraded.
Event Correlation
Sending events to Sematext Cloud alongside your OpenTelemetry logs helps you understand the context behind changes in your system. Events can include deployments, service restarts, configuration changes, scaling actions, or other operational milestones; deployments, commits, and merges can be correlated with the relevant Git commit or merge hash. By correlating these events with logs, you can quickly identify the root cause of issues and see how system activity aligns with key changes.
We recommend using the Sematext API to send events whenever these operational changes occur. Include key metadata such as environment and version.
This enables you to: - Quickly determine if a spike in error logs corresponds with a recent deployment or configuration change. - Investigate issues by checking whether log patterns align with operational events. - Understand trends in your system by visualizing event-driven log activity over time.
For example, if an error surge happens after a new release, the event log helps you immediately pinpoint the deployment responsible, reducing troubleshooting time and helping maintain system reliability.
Once your events are in Sematext Cloud, you can view them by toggling on the Events heatbar in your OpenTelemetry Logs App’s Explore report. Hovering over the heatbar shows the number of events that occurred within a specific timeframe. Clicking on a section opens a flyout where you can see detailed event information and directly correlate with your logs.
The recording below shows how events can help when you receive an anomaly alert about a sudden spike in errors in your logs. - Filter for errors in your OpenTelemetry Logs App - Toggle on the Events heatmap to see recent changes - Notice two new events in the last few minutes - Open the details and see a deployment that likely caused the spike
Troubleshooting
If you have trouble sending logs or metrics, try out the latest version of Sematext Agent. Also, make sure Sematext Agent is configured to send logs and metrics to your OpenTelemetry Logs or Monitoring App.