Service Discovery
The centerpiece of Service Discovery is Sematext Agent. When Sematext Agent is installed and running on a server/node/instance it scans for services that can be monitored by Sematext supported integrations. It also discovers logs you can ship to Sematext and monitor. To visualize discovered services and their connections, see Network Map. To see application-level service dependencies from distributed traces, see Service Map.
The discovered services and logs are displayed under Fleet & Discovery > Discovery > Services. From there, one can set up both monitoring and log shipping via the UI without any additional installation or configuration. Moreover, this is where auto-monitoring of supported integrations can be enabled, allowing Sematext Agent to automatically start monitoring newly discovered instances of the service for which you've set up monitoring. For example, if you have set up monitoring for Elasticsearch and enabled automatic monitoring then any new Elasticsearch nodes that are added to the cluster will automatically get monitored.
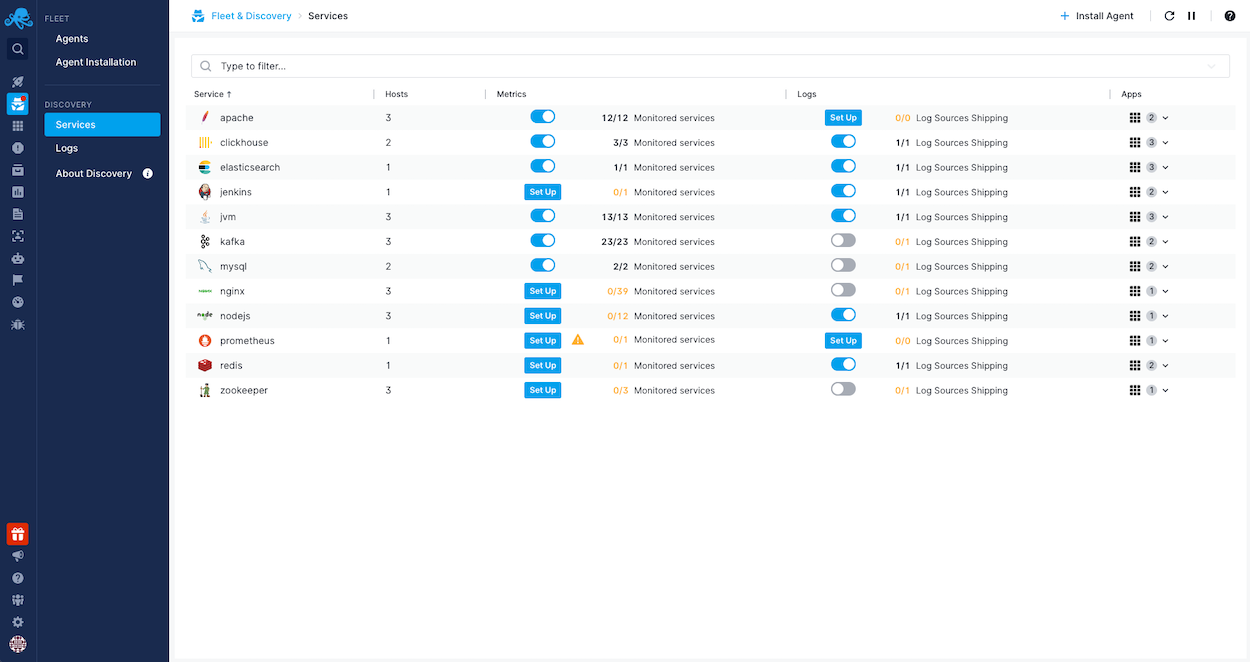
Autodiscovery-based Monitoring
Autodiscovered services can be monitored in two ways:
Auto-monitoring
This is the recommended way of setting up monitoring of services with Sematext. It relieves you from having to manually start the monitoring of additional instances of a service that is already being monitored with Sematext. For example, if you are running one Nginx instance today, and tomorrow you start the second one, use the auto-monitoring option in Sematext to have the Sematext Agent start monitoring the second Nginx as soon as it is discovered. Of course, for this to work, you have to have Sematext Agent installed and running, which means that ideally you would have Sematext Agent baked into images you use for your servers/nodes/instances. You can enable or disable automatic monitoring for any service type at any point via the Discovery UI. If you decide to stop monitoring, a single click in the UI will stop it.
Manually
Bare Metal / Virtual Machine Monitoring
In bare-metal/virtual machine setups you can use the manual Agent installation instructions available in Sematext Cloud for manual agent installation. This means installing a Sematext Agent package for RedHat or Debian or some other distribution. This is the sort of install you will want to bake into images you use for your servers/nodes/instances.
Containers
In containerized environments you can just add MONITORING_TOKEN as an environment variable to your container. Sematext Agent will automatically match it to the type of service running inside the container and will set up a monitoring agent container specifically for that service. If a service requires authentication for monitoring, you will also need to provide credentials, e.g., as environment variables with username or password for monitoring MySQL or as a Kubernetes Secret. Again, just follow the manual monitoring installation instructions in Sematext Cloud to set this up.
Which integrations allow Autodiscovery?
Sematext Agent can automatically discover and start monitoring the following service types:
- Cassandra
- ClickHouse
- Couchbase
- Elasticsearch
- HAProxy
- Jenkins
- JVM
- Kafka
- MySQL
- Nginx+
- OpenSearch
- Redis
- Solr
- Spark
- Storm
- Tomcat
- Varnish Cache
- ZooKeeper
Additionally, Sematext Agent will also discover the following services, but at the moment it can't automatically start monitoring them:
- Node.js [1]
- Flink
- NATS
- PostgreSQL
- RabbitMQ
How do I start using Service Discovery?
Simply go to Fleet & Discovery > Services (EU).
You will be presented with instructions to install Sematext Agent in case you haven't done this already.
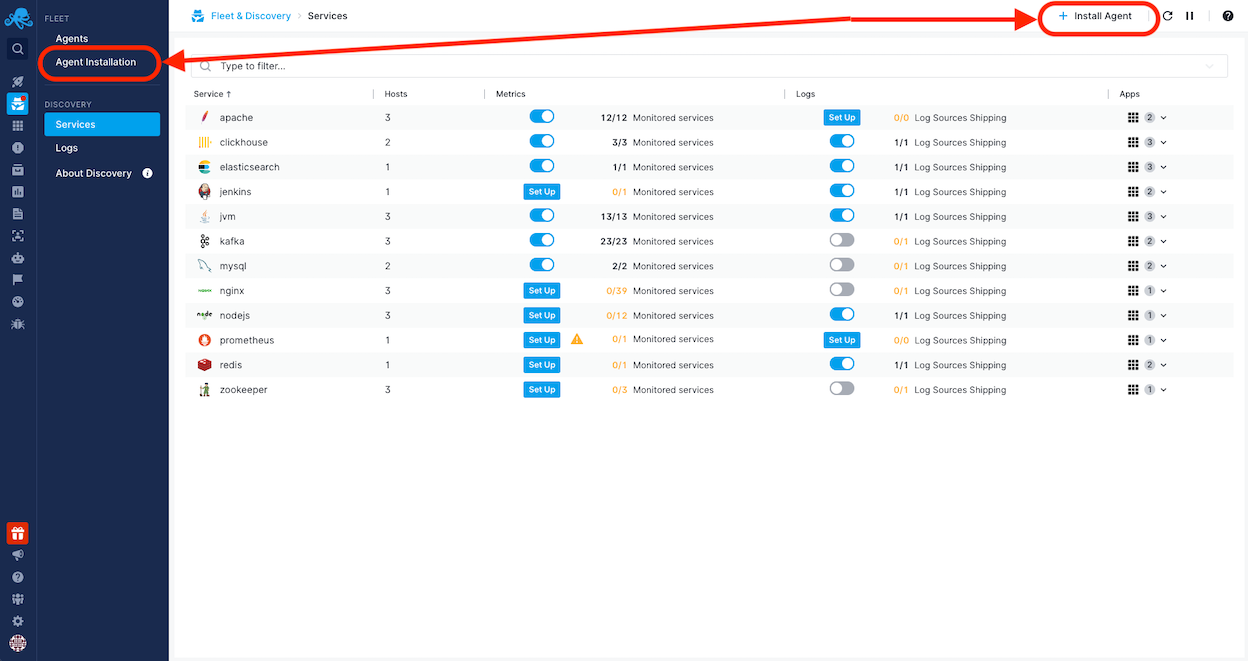
On each host, Kubernetes, Swarm, or Docker Enterprise cluster where Sematext Agent is installed, it will instantly start discovering services that can be monitored. Discovered services will be displayed in Services.
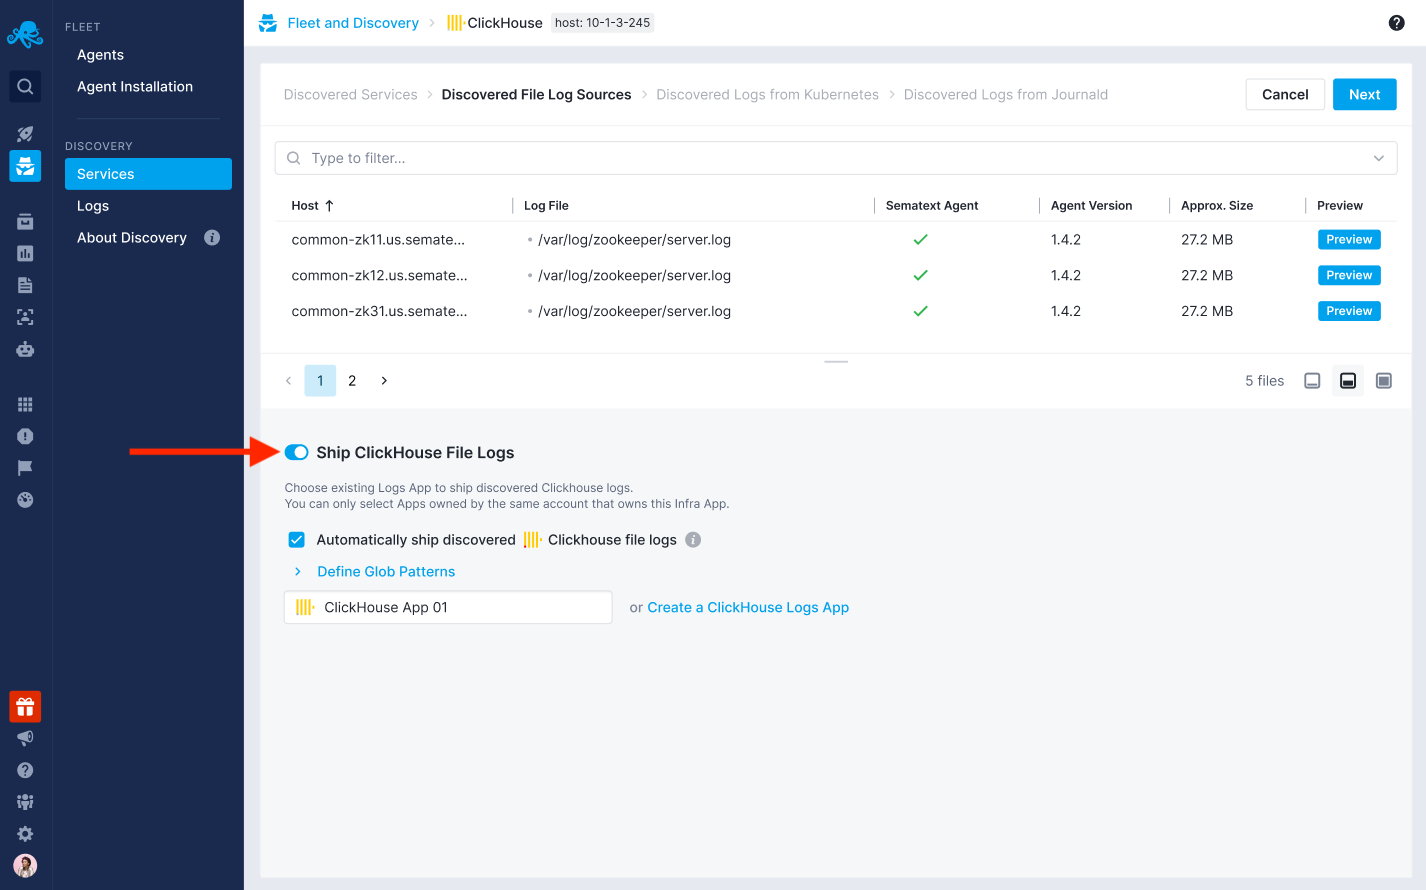
Clicking the setup button in the Metrics or Logs column of each service will open the setup wizard.
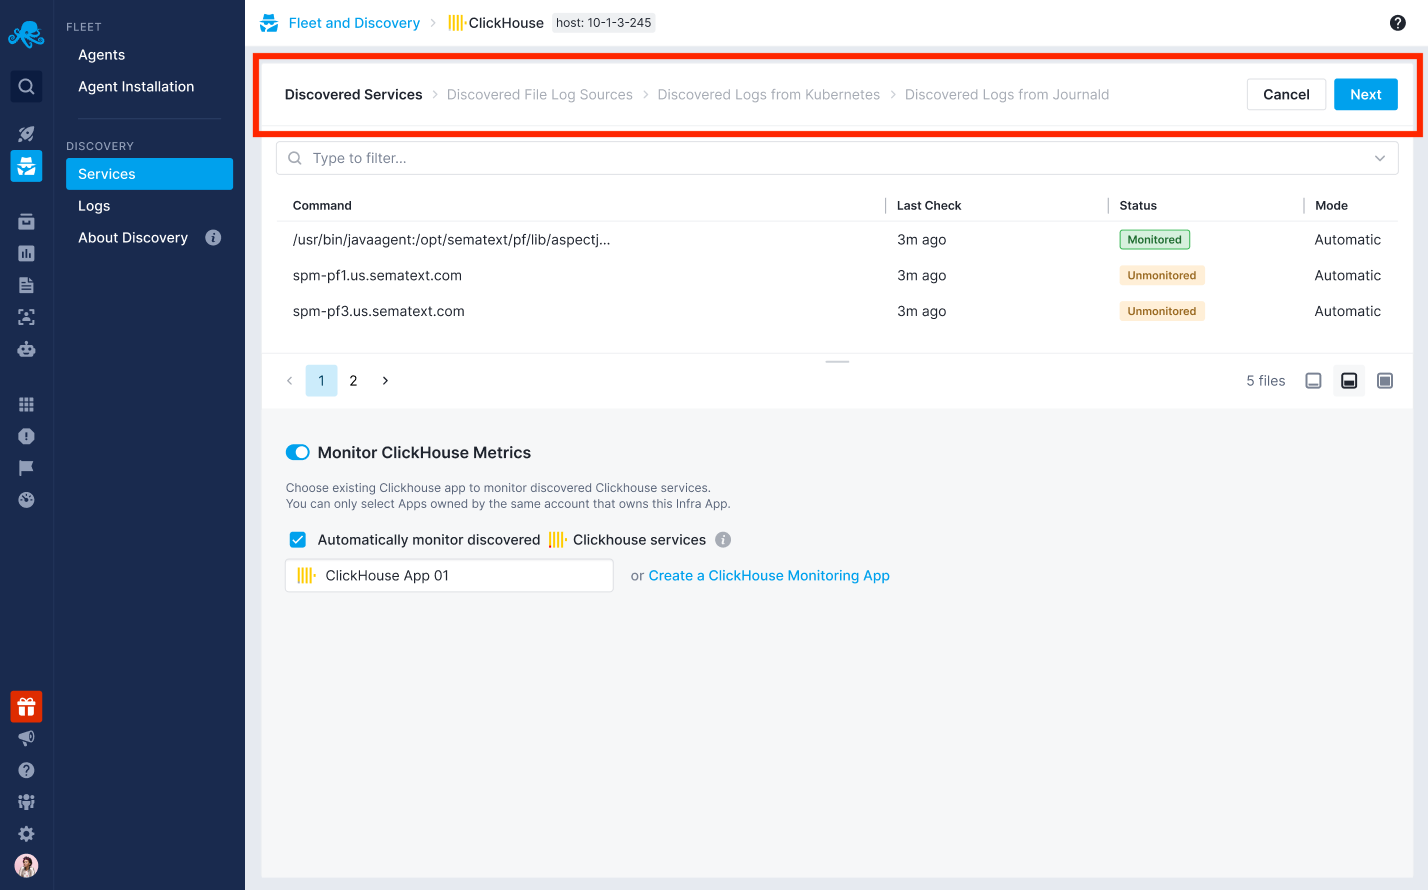
From there, you can follow the provided instructions to enable automatic monitoring and automatic log shipping for that specific service. You can also choose to use existing Monitoring and Logs Apps or create new ones.
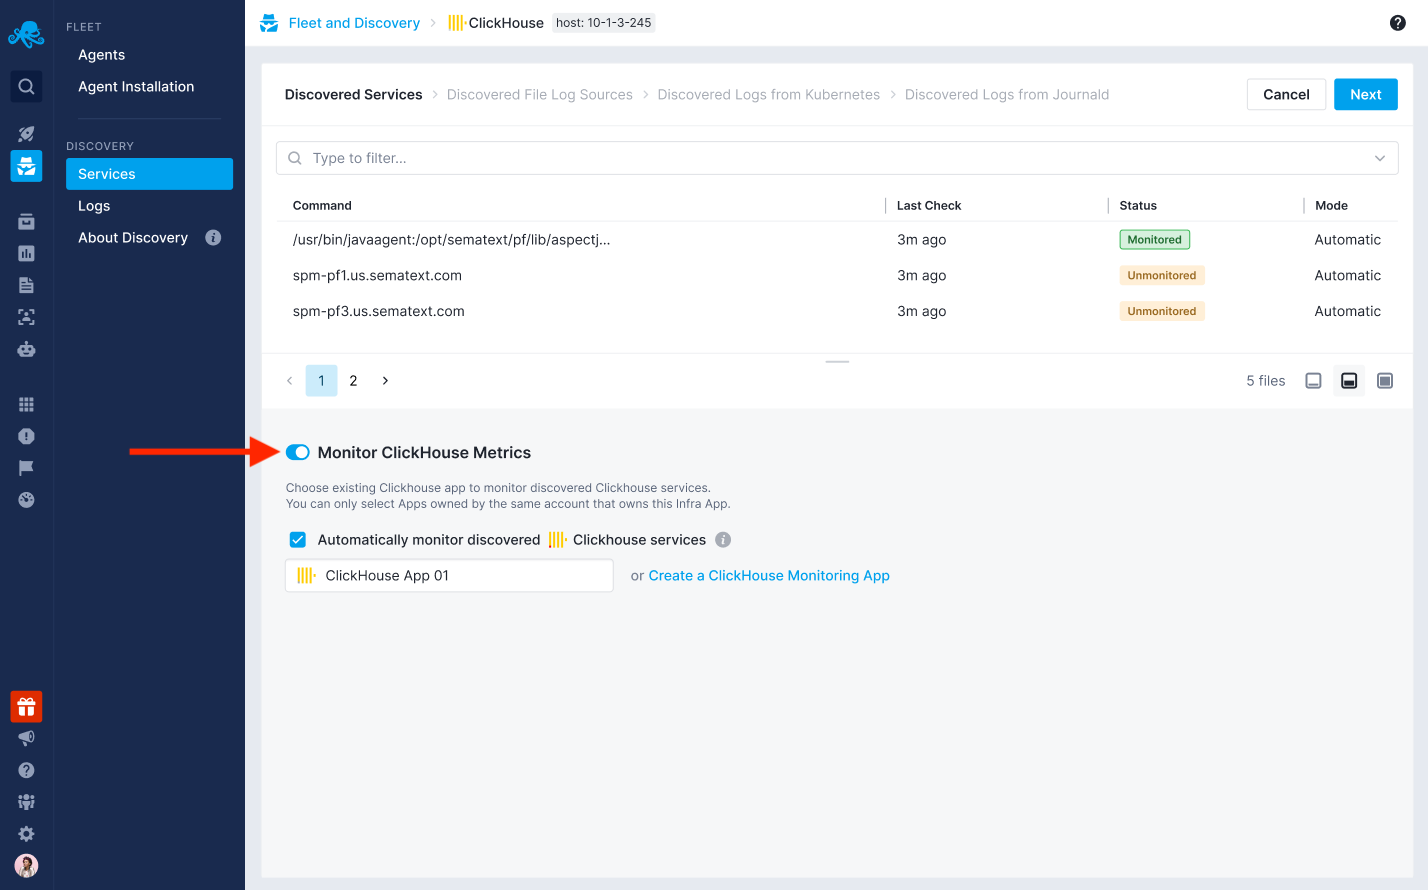
Manual Monitoring is also available by following the Agent installation instructions:

This will also enable the automatic connection of those Apps which will enable you to correlate their data via Split Screen.
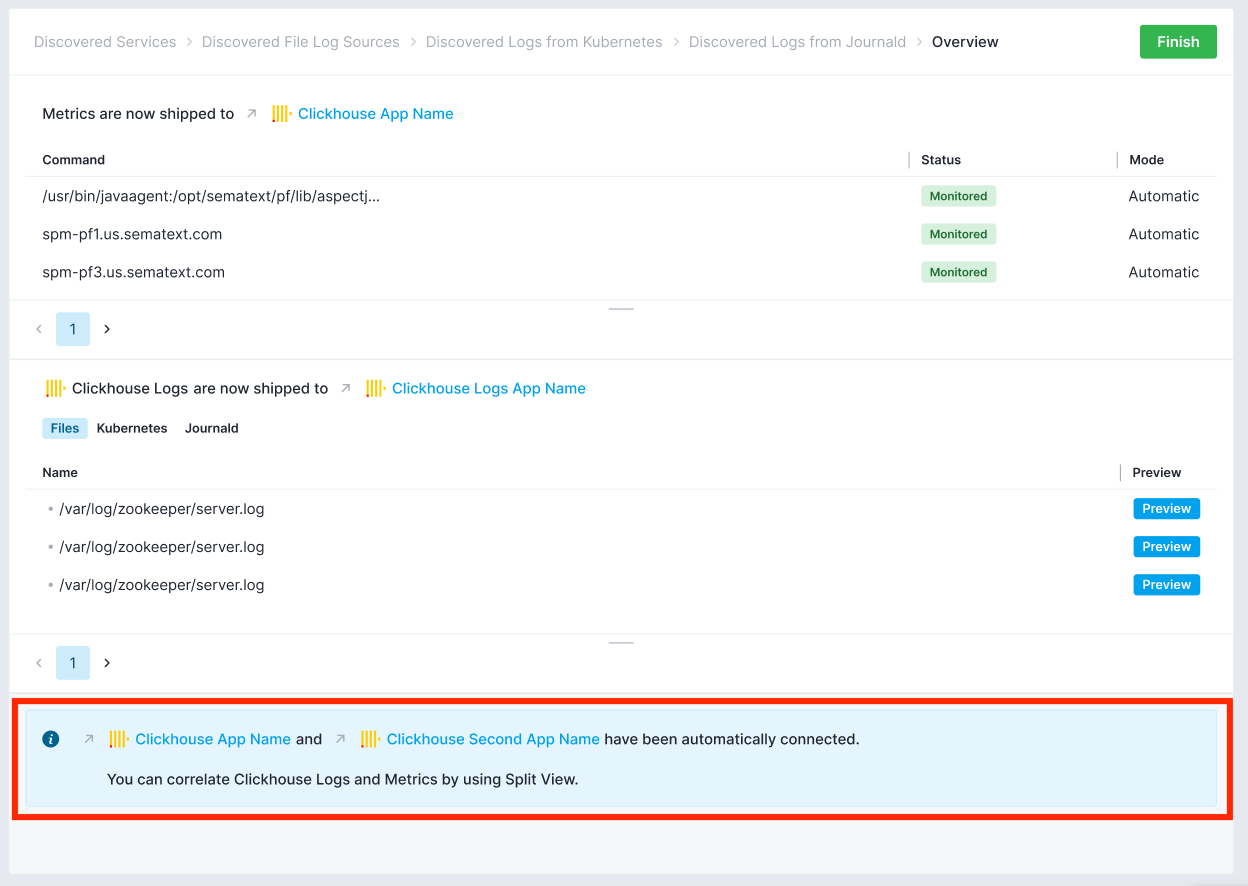
In most cases Sematext Agent knows how to start monitoring the discovered services without requiring you to take any additional actions. This means service metrics and logs will start appearing a few seconds after you enable automatic monitoring in the relevant Monitoring and/or Logs Apps. In other cases you may have to provide credentials so monitoring agents can connect to the service you wish to monitor. In either case, the Discovery screen will guide you and provide the exact instructions.
How does Sematext Service Discovery work in bare-metal/virtual machine environments?
It is enough to install sematext-agent RPM/DEB package and set up one of your Infra App tokens by following the instructions. This will start Sematext Agent which will automatically start scanning for known service types. Separately, it will connect to the Sematext backend to fetch info about any automatic monitoring rules you may have defined.
In bare-metal/virtual machine environments, Sematext Agent will automatically start monitoring discovered services only if configured to do so via the Fleet & Discovery > Services screen.
How does Sematext Service Discovery work in container environments?
The Sematext Agent container gets distributed to every Kubernetes, Docker Swarm, or Docker Enterprise node. Sematext Agent uses eBPF to watch for services starting, as well as stopping, so it can start and stop monitoring agent containers and pods.
In container environments, Sematext Agent will create a monitoring container if it finds MONITORING_TOKEN environment variable or label in your service. Additionally, this is true if you enabled automatic monitoring for specific service types in the UI. In Kubernetes setups MONITORING_TOKEN can be placed in the pod annotations.
Example: Steps required to monitor a containerized application, like Elasticsearch, manually:
- Create a new Monitoring App, and open the container env instructions.
- Following the instructions in the UI, deploy a Sematext Agent container, either as a standalone container, as Kubernetes DaemonSet, or as global Swarm Service.
- Add the Elasticsearch
MONITORING_TOKENas a label or environment variable to your Elasticsearch container. - Restart your Elasticsearch container to apply the label/environment variable.
Example: Steps required to monitor a containerized application, like Elasticsearch, automatically:
- Visit the Fleet & Discovery screen. Open instructions to install Sematext Agent in a container env.
- Following the instructions in the UI to deploy a Sematext Agent container as a standalone container, Kubernetes DaemonSet, or as global Swarm Service.
- From the
Fleet & Discovery > ServicesUI, click on any discovered service and enable automatic monitoring option.
As soon as Sematext Agent discovers the Elasticsearch container with a MONITORING_TOKEN set, or the automatic monitoring option enabled, it will set up the monitoring agent container which will start to collect the Elasticsearch metrics.
Which Sematext Agent version do I need?
Ensure you are using the latest available agent version. For more information, please visit our release notes.
Can I have a mix of manually and automatically monitored services?
Yes. In case of bare-metal/virtual machine environments, follow the classic installation instructions to set up a "manually" monitored service agent. Sematext Agent will recognize it as being manually set up and won't apply any of the automatic monitoring rules. Automatic monitoring can be specified on the service type level in the Discovery UI. It will be applied for any instance of that service except those that already have a manually configured agent.
In container environments you add the MONITORING_TOKEN environment variable, or label, to the container of the service you wish to monitor manually. Automatic monitoring can again be enabled in the UI and Sematext Agent will again "know" which service instances have a manually configured agent and which should get automatic monitoring rule applied.
In all environments this makes it possible to use different monitoring tokens, and thus different Sematext Apps for the same service type running on the same machine or in the same Kubernetes/Swarm cluster.
Switching from manual to automatic monitoring
The switch from manual to automatic monitoring is done by first removing the agent you set up manually, then enabling automatic monitoring in the user interface.
In bare-metal/virtual machine setups there are two types of agents - in-process (with javaagent) and standalone.
If you are using the in-process variant, do the following:
- remove
-javaagentdefinition from the startup script of your service and restart the service - from the directory
/opt/spm/spm-monitor/conf, remove the config file whose name contains an App token used by this specific service
If you are using the standalone variant:
- from the directory
/opt/spm/spm-monitor/conf, remove the config file whose name contains an App token used by this specific service - restart the agent with `sudo service sematext-agent restart
In container environments it's much simpler - remove the environment variable named MONITORING_TOKEN from your containers:
- if using
docker runcommand to start your service, remove MONITORING_TOKEN from the command line - if using
docker-compose.ymlto start your service, remove MONITORING_TOKEN from that file - if using kubernetes, remove MONITORING_TOKEN from service deployment manifest
- if using helm remove
sematext.com/monitoring-tokenfrom values.yml
After this is done make sure to redeploy your service to apply the change.
Sematext Agent will notice the change in few minutes and, if you enabled automatic monitoring in the UI, it will start automatically creating and managing monitoring agents for services you adjusted in this way.
Additional Configuration for Sematext Agent
For special cases, such as defining different sets of credentials in Kubernetes, additional steps are required to properly configure service discovery.
- Defining monitoring agent credential sets in Kubernetes
- Providing MySQL JDBC driver in container environments
- JMX Attaching
- Removing stale Sematext Agent resources after deinstallation