OpenTelemetry
OpenTelemetry is an observability framework that helps you collect data from your applications and servers. It can gather logs, metrics, and traces in one place. Sematext Cloud works with OpenTelemetry to store and display this data.
This page explains how to integrate OpenTelemetry metrics and logs in your application and how to use the Sematext Agent to ship logs and metrics from the application that's been instrumented with OpenTelemetry to Sematext Cloud. With the support for OpenTelemetry Tracing, you will be collecting metrics, logs, and traces in a single platform, giving you the ability to correlate them easily and understand how metrics trends, log events, and traces relate to each other across your applications.
With logs, you can monitor your applications and infrastructure, troubleshoot issues faster, detect anomalies, and connect logs to events such as deployments or restarts. Metrics provide insights into system and application performance, while traces let you analyze request flows and latency across services. Together, they give you the full picture in one platform. Features like Split Screen and Connected Apps in Sematext Cloud let you view and correlate this data side by side for faster and deeper root-cause analysis.
Install Sematext Agent
- Create an OpenTelemetry Logs or Monitoring App. This will let you install the agent and control access to your monitoring and logs data.
- Set up log and metrics exporting in your application. Follow the SDK-specific instructions provided in the UI. Choose your language and integrate OpenTelemetry metrics and logging into your code.
- Install the Sematext Agent using the instructions shown in the App creation flow. The Agent works as an OpenTelemetry collector and ships logs from your application that has been instrumented with an OpenTelemetry SDKs to Sematext Cloud.
OpenTelemetry metrics and logging is supported in
Python,Node.js,.NET,Java. The SDK setup instructions for these languages are shown after you create an OpenTelemetry Logs App.
Metrics
OpenTelemetry metrics can be collected in two main ways: zero-code instrumentation and manual instrumentation. Zero-code instrumentation automatically collects common metrics such as request rate, latency, and error counts from supported frameworks and libraries without requiring any changes to your application code. It is quick to set up and ideal for gaining standard visibility out of the box. Manual instrumentation, on the other hand, gives developers full control over what metrics to collect and how to label them. It involves adding OpenTelemetry API calls directly in the code to emit custom metrics that reflect specific business or application logic. In short, zero code instrumentation provides convenience and standardization, while manual instrumentation offers flexibility and precision.
✅ Zero-Code (Automatic) Instrumentation - Recommended
- What it is: Automatic metric collection with no code changes required
- What you get: Pre-built dashboards, alerts, and reports that work out-of-the-box
- Maintenance: Fully supported and maintained by our platform team
🛠️ Manual Instrumentation - Custom Implementation Required
- What it is: Hand-coded metric collection and custom business logic metrics
- What you get: Complete control over what metrics are collected
- Important: You need to ensure that manually shipped OpenTelemetry metric names match the ones expected by zero-code instrumentation to take full advantage of built-in reports and default alert rules. Otherwise, you will need to create custom reports and alerts based on your custom metrics.
Metrics collected through zero-code instrumentation and used in out-of-the-box reports and alerts are listed below. If your SDK doesn’t support OpenTelemetry zero-code instrumentation, or if you choose to use manual instrumentation for full control over your metrics, we recommend that the metrics you ship from your application code match those in the list below to take advantage of out-of-the-box reports and alerts. However, if you prefer to ship additional metrics and create custom reports you can always use the Chart Builder or define your own alert rules.
| Metric Name Key (Type) (Unit) |
Description |
|---|---|
| HTTP Server Request Duration Count otel.http_server_request_duration.count (long counter) |
Count of HTTP server request durations |
| HTTP Server Request Duration Sum otel.http_server_request_duration.sum (double counter) (milliseconds) |
Sum of HTTP server request durations |
| HTTP Server Request Duration Max otel.http_server_request_duration.max (double gauge) (milliseconds) |
Maximum HTTP server request duration |
| HTTP Server Request Duration Bucket otel.http_server_request_duration.bucket (long counter) |
Histogram bucket for HTTP server request durations |
| HTTP Client Request Duration Max otel.http_client_request_duration.max (double gauge) (milliseconds) |
Maximum HTTP client request duration |
| HTTP Client Request Duration Sum otel.http_client_request_duration.sum (double counter) (milliseconds) |
Sum of HTTP client request durations |
| HTTP Client Request Duration Count otel.http_client_request_duration.count (long counter) |
Count of HTTP client request durations |
| HTTP Client Request Duration Bucket otel.http_client_request_duration.bucket (long counter) |
Histogram bucket for HTTP client request durations |
| Database Client Connection Count otel.db_client_connection_count (long counter) |
Count of database client connections |
| Database Client Connection Timeouts otel.db_client_connection_timeouts (long counter) |
Count of database client connection timeouts |
| Database Client Connection Wait Time Sum otel.db_client_connection_wait_time.sum (double counter) (milliseconds) |
Sum of database client connection wait times |
| Database Client Connection Wait Time Count otel.db_client_connection_wait_time.count (long counter) |
Count of database client connection wait time measurements |
| Database Client Connection Max otel.db_client_connection_max (long gauge) |
Maximum database client connections |
| Database Client Connection Pending Requests otel.db_client_connection_pending_requests (long gauge) |
Number of pending database client connection requests |
| Database Client Connection Create Time Sum otel.db_client_connection_create_time.sum (double counter) (milliseconds) |
Sum of database client connection creation times |
| Database Client Connection Create Time Count otel.db_client_connection_create_time.count (long counter) |
Count of database client connection creation time measurements |
| Database Client Connection Use Time Sum otel.db_client_connection_use_time.sum (double counter) (milliseconds) |
Sum of database client connection use times |
| Database Client Connection Use Time Count otel.db_client_connection_use_time.count (long counter) |
Count of database client connection use time measurements |
| JVM Memory Used otel.jvm_memory_used (long gauge) (bytes) |
JVM memory currently used |
| JVM Memory Committed otel.jvm_memory_committed (long gauge) (bytes) |
JVM memory committed |
| JVM Thread Count otel.jvm_thread_count (long gauge) |
Number of JVM threads |
| JVM Class Loaded otel.jvm_class_loaded (long counter) |
Number of JVM classes loaded |
| JVM Class Count otel.jvm_class_count (long gauge) |
Current number of JVM classes |
| JVM GC Duration Sum otel.jvm_gc_duration.sum (double counter) (milliseconds) |
Sum of JVM garbage collection durations |
| JVM GC Duration Max otel.jvm_gc_duration.max (double gauge) (milliseconds) |
Maximum JVM garbage collection duration |
| JVM Memory Used After Last GC otel.jvm_memory_used_after_last_gc (long gauge) (bytes) |
JVM memory used after last garbage collection |
| JVM CPU Recent Utilization otel.jvm_cpu_recent_utilization (double gauge) (ratio) |
Recent JVM CPU utilization |
| Process CPU Count otel.process_cpu_count (long gauge) |
Number of process CPUs |
| Process CPU Time otel.process_cpu_time (double counter) (seconds) |
Process CPU time |
| Process Memory Usage otel.process_memory_usage (long gauge) (bytes) |
Process memory usage |
| Process Thread Count otel.process_thread_count (long gauge) |
Number of process threads |
| Process Runtime .NET GC Collections Count otel.process_runtime_dotnet_gc_collections_count (long counter) |
.NET garbage collection count |
| Process Runtime .NET GC Objects Size otel.process_runtime_dotnet_gc_objects_size (long gauge) (bytes) |
.NET garbage collection objects size |
| Process Runtime .NET Assemblies Count otel.process_runtime_dotnet_assemblies_count (long gauge) |
Number of .NET assemblies loaded |
| Process Runtime .NET Exceptions Count otel.process_runtime_dotnet_exceptions_count (long counter) |
.NET exceptions count |
| Process Runtime CPython CPU Utilization otel.process_runtime_cpython_cpu_utilization (double gauge) (ratio) |
CPython CPU utilization |
| Process Runtime CPython CPU Time otel.process_runtime_cpython_cpu_time (double counter) (seconds) |
CPython CPU time |
| Process Runtime CPython Thread Count otel.process_runtime_cpython_thread_count (long gauge) |
Number of CPython threads |
| Process Runtime CPython Context Switches otel.process_runtime_cpython_context_switches (long counter) |
CPython context switches count |
| Process Runtime CPython Memory otel.process_runtime_cpython_memory (long gauge) (bytes) |
CPython memory usage |
| System Memory Usage otel.system_memory_usage (long gauge) (bytes) |
System memory usage |
| System Memory Utilization otel.system_memory_utilization (double gauge) (ratio) |
System memory utilization |
| System CPU Utilization otel.system_cpu_utilization (double gauge) (ratio) |
System CPU utilization |
| System Disk IO otel.system_disk_io (long counter) (bytes) |
System disk I/O |
| System Disk Operations otel.system_disk_operations (long counter) |
System disk operations count |
| System Network IO otel.system_network_io (long counter) (bytes) |
System network I/O |
| System Network Packets otel.system_network_packets (long counter) |
System network packets count |
| System Network Errors otel.system_network_errors (long counter) |
System network errors count |
| System Network Dropped Packets otel.system_network_dropped_packets (long counter) |
System network dropped packets count |
| System Network Connections otel.system_network_connections (long gauge) |
Number of system network connections |
| System Thread Count otel.system_thread_count (long gauge) |
Number of system threads |
Reports
OpenTelemetry Monitoring integration reports help you monitor your services and understand how they behave. The first set consists of generic reports under the main category, which support metrics from multiple SDKs and provide a high-level view of service performance. These reports help you quickly identify potential issues and can be grouped or filtered by service for more detailed investigation. The second set consists of SDK-specific reports, which capture metrics unique to each service and provide insights tailored to the particular behavior and characteristics of that programming language. Together, these reports offer both a broad overview and SDK-specific visibility, helping you understand and optimize your applications.
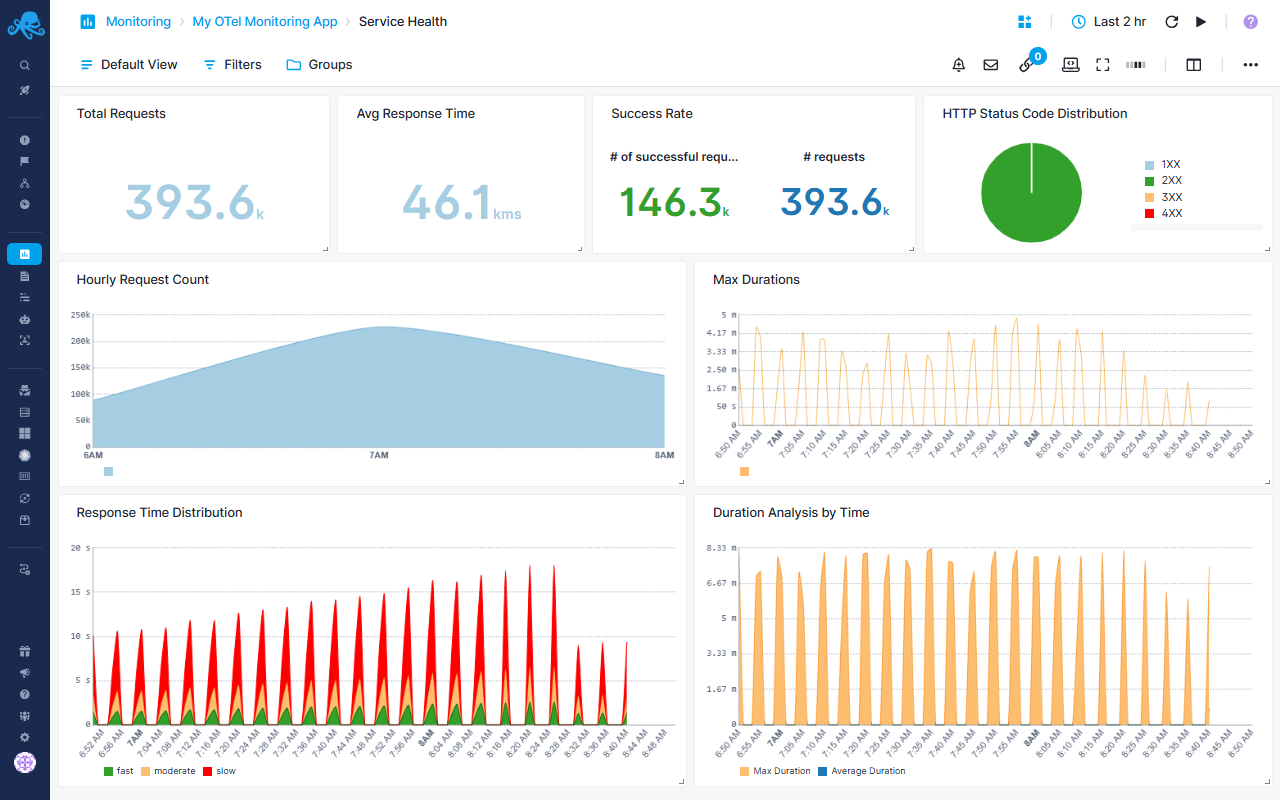
Service Health Report
Provides HTTP service monitoring focused on request performance, reliability, and traffic patterns using OpenTelemetry metrics.
Operational Health Metrics
- Total Requests - Volume of incoming traffic to track usage patterns
- Average Response Time - Calculate from duration sum/count to identify performance trends
- Success Rate - Ratio of 2XX responses vs total requests to measure reliability
Performance Analysis
- Hourly Request Count - Traffic patterns over time to identify peak hours and unusual spikes
- Max Durations - Outlier detection for slowest requests
- Duration Analysis - Compare max vs average response times to spot performance degradation
Response Time Distribution
- Categorizes requests into fast (<750ms), moderate (1-7.5s), and slow (>7.5s) buckets
- Helps identify if slowdowns affect all requests or specific segments
- Enables capacity planning by understanding response time patterns
Error Tracking
- HTTP Status Distribution pie chart breaks down 1XX, 2XX, 3XX, 4XX, and 5XX responses
- Quickly spot error rate increases or unusual redirect patterns
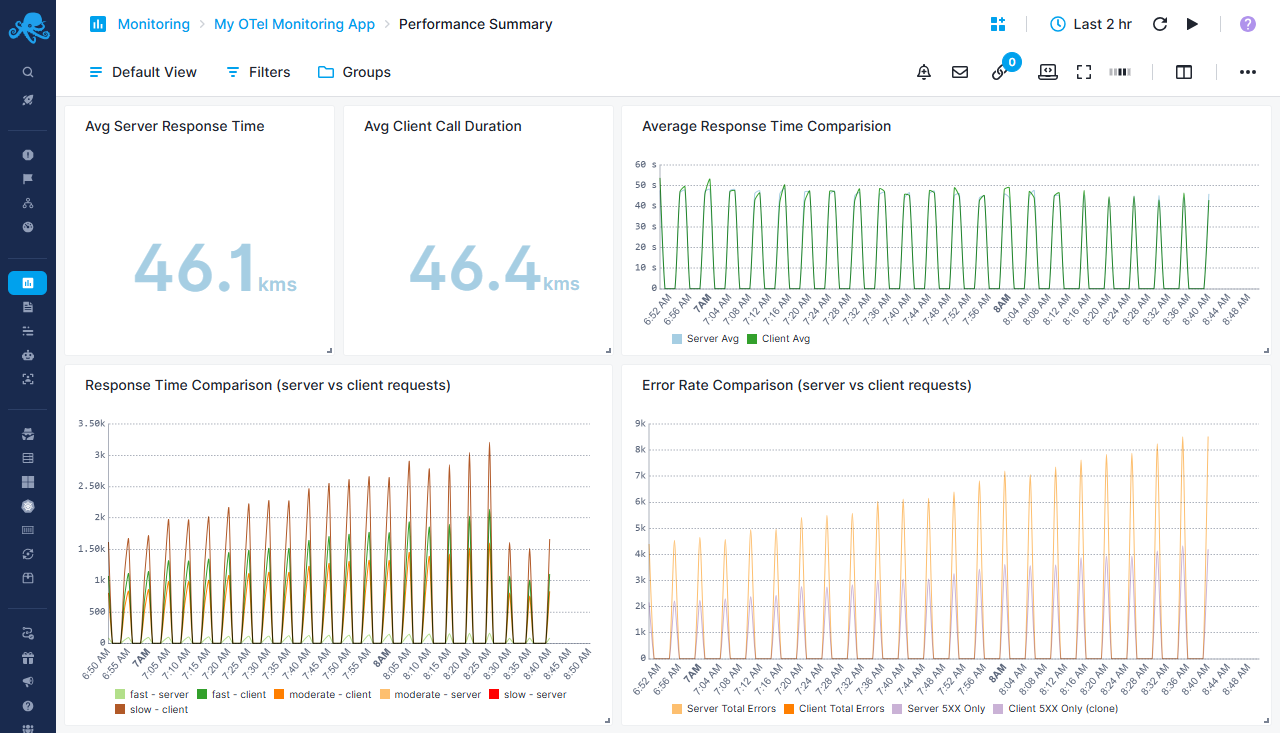
Performance Summary Report
Request duration and latency analysis across all services
Performance Comparison Metrics
- Avg Server Response Time - Calculated server-side request processing time in milliseconds
- Avg Client Call Duration - Outbound HTTP request duration from client perspective in milliseconds
- Average Response Time Comparison - Side-by-side trend chart comparing server vs client average response times over time
Response Time Distribution Analysis
- Response Time Comparison (server vs client requests) - Categorizes both server and client requests into three performance tiers:
- Fast (<750ms) - Optimal performance range displayed in green tones
- Moderate (1-7.5s) - Acceptable performance range in orange tones
- Slow (>7.5s) - Concerning performance requiring attention in red/brown tones
- Enables identification of whether latency originates from server processing or client-side calls
Error Analysis
- Error Rate Comparison - Tracks total errors (4XX + 5XX) for both server and client requests
- Server 5XX vs Client 5XX - Isolates server errors to distinguish infrastructure issues from client-side problems
- Helps pinpoint whether errors stem from internal services or external dependencies
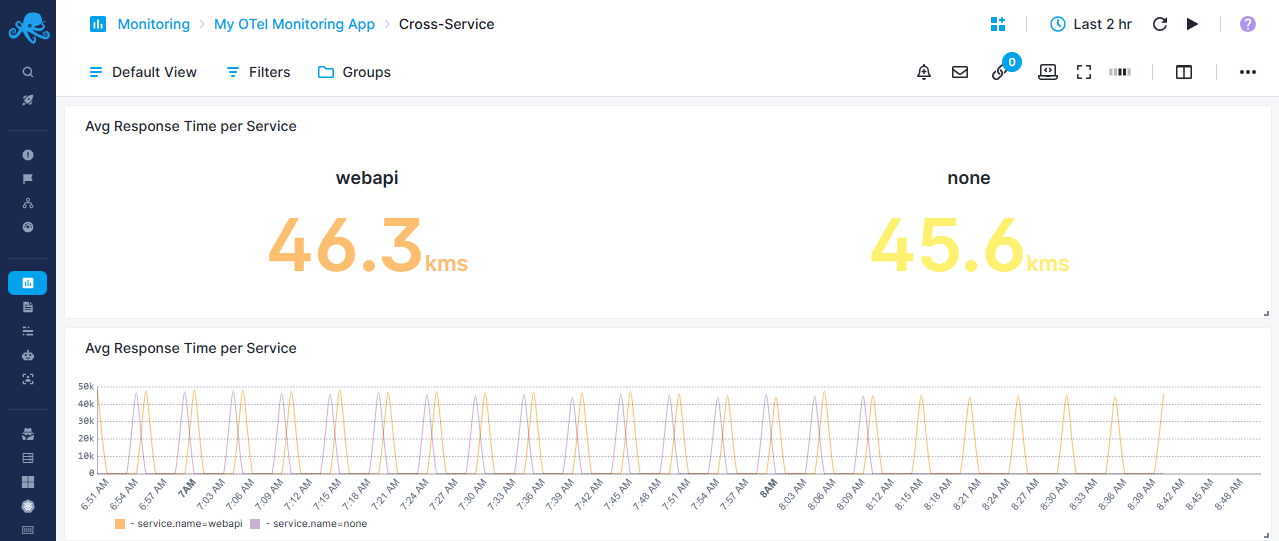
Cross-Service Report
Compare HTTP performance between different services
Service Performance Metrics
- Avg Response Time per Service - Big number display showing average response time grouped by service name
- Calculated from duration sum/count metrics, converted to milliseconds
- Enables quick identification of slowest services
Service Comparison Chart
- Avg Response Time per Service - Time-series chart displaying response time trends for each service
- Grouped by
service.nametag to track individual service performance - Helps identify service degradation patterns and compare relative performance
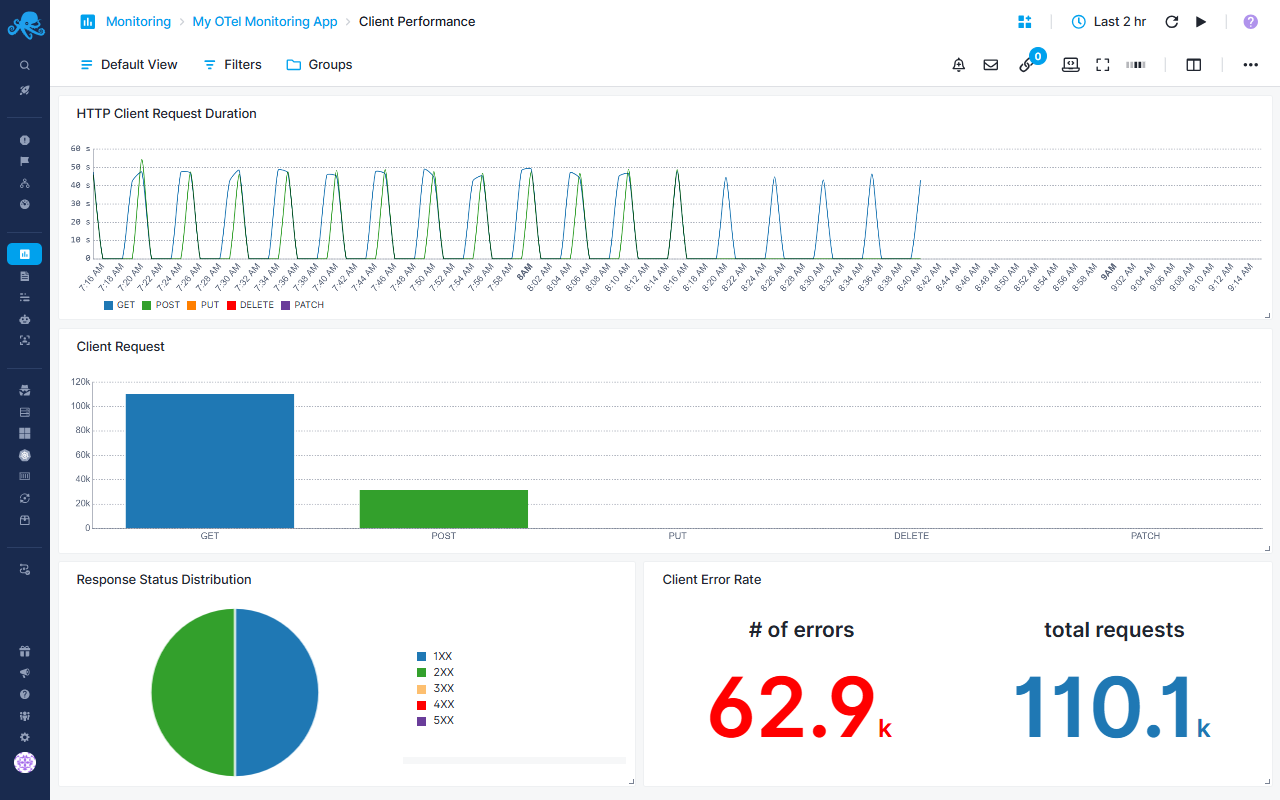
Client Performance Report
Monitor outbound HTTP requests made by your services
Request Duration by Method
- HTTP Client Request Duration - Tracks average response time for each HTTP method
- Calculated as (sum/count) × 1000 for millisecond precision
Request Volume Analysis
- Client Request bar chart - Shows request count distribution across HTTP methods
- Helps understand which operations dominate client-side traffic
Status Code Tracking
- Response Status Distribution pie chart - Breaks down client responses by status category
Error Rate Monitoring
- Client Error Rate - Displays both error count (4XX + 5XX) and total requests
- Enables calculation of error percentage for client-side calls
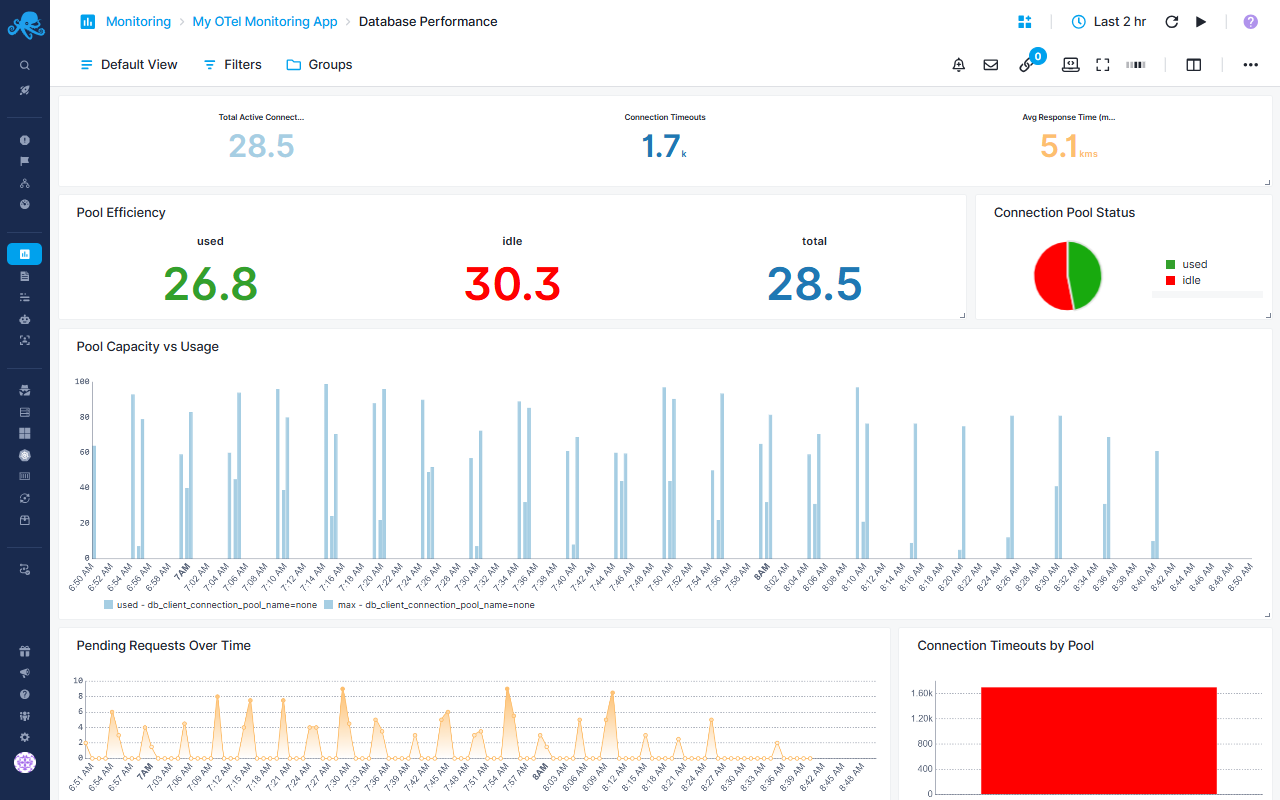
Database Performance Report
Monitor database connection pool health and query performance
Connection Pool Overview
- Total Active Connections - Current number of active database connections
- Connection Timeouts - Count of connection timeout events
- Avg Response Time - Average wait time for connection acquisition in milliseconds
Pool Efficiency Metrics
- Pool Efficiency - Displays used, idle, and total connections
- Connection Pool Status pie chart - Visual breakdown of used vs idle connections
Capacity Management
- Pool Capacity vs Usage - Stacked bar chart comparing used connections against max pool size
- Grouped by connection pool name for multi-database monitoring
- Helps identify pools approaching capacity limits
Performance Bottlenecks
- Pending Requests Over Time - Area chart tracking queued connection requests by pool
- Connection Timeouts by Pool - Bar chart highlighting which pools experience timeout issues
Connection Lifecycle Metrics
- Connection Performance Metrics - Tracks three key timing phases:
- Create Time - Time to establish new database connections
- Wait Time - Time spent waiting in queue for available connection
- Use Time - Active connection usage duration
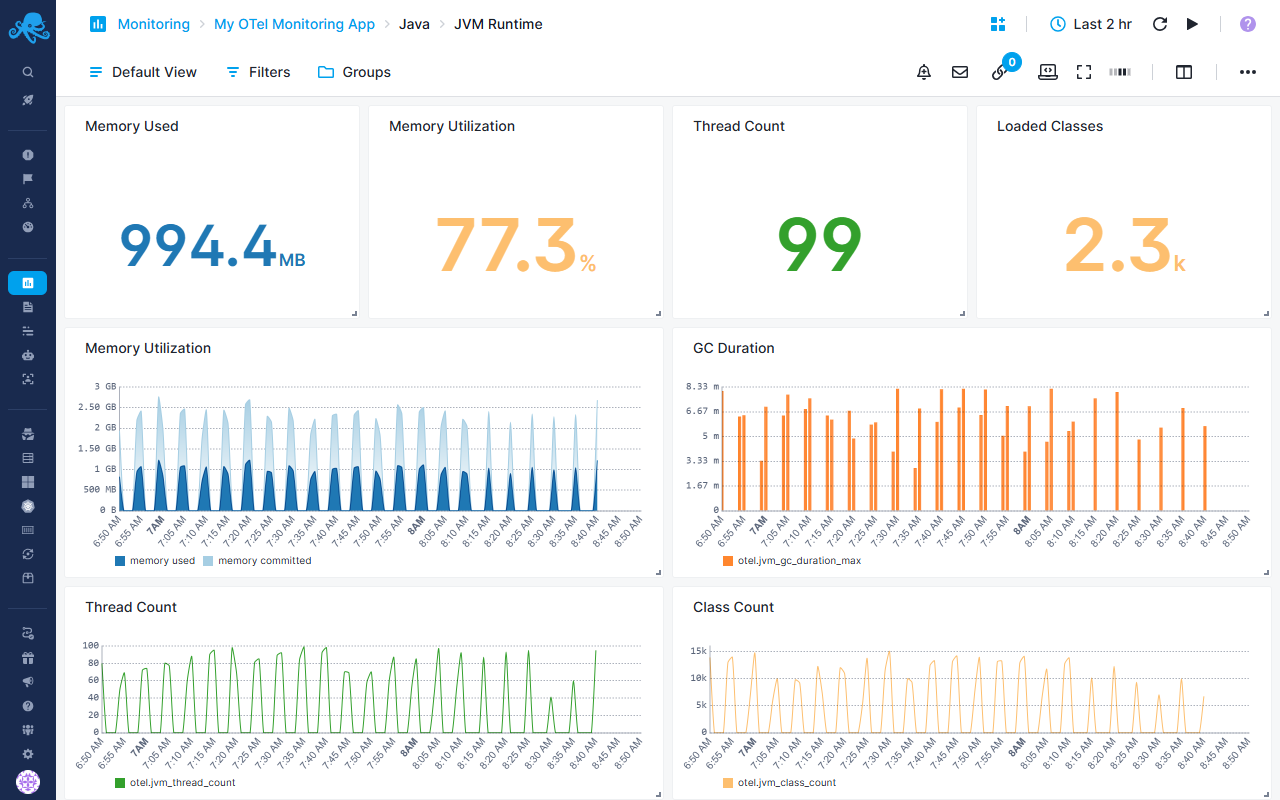
Java-specific JVM Runtime Report
Complete JVM runtime monitoring
Memory Metrics
- Memory Used - Current JVM memory consumption in bytes
- Memory Utilization - Percentage of committed memory being used
- Color-coded thresholds:
- Critical: >85% utilization
- Warning: >70% utilization
- Healthy: ≤70% utilization
Resource Tracking
- Thread Count - Maximum number of active JVM threads
- Loaded Classes - Current count of loaded classes in JVM
Detailed Charts
- Memory Utilization - Stacked area chart showing used vs commited memory
- GC Duration - Bar chart displaying maximum garbage collection pause times
- Thread Count - Line chart tracking thread count over time
- Class Count - Line chart monitoring total loaded classes
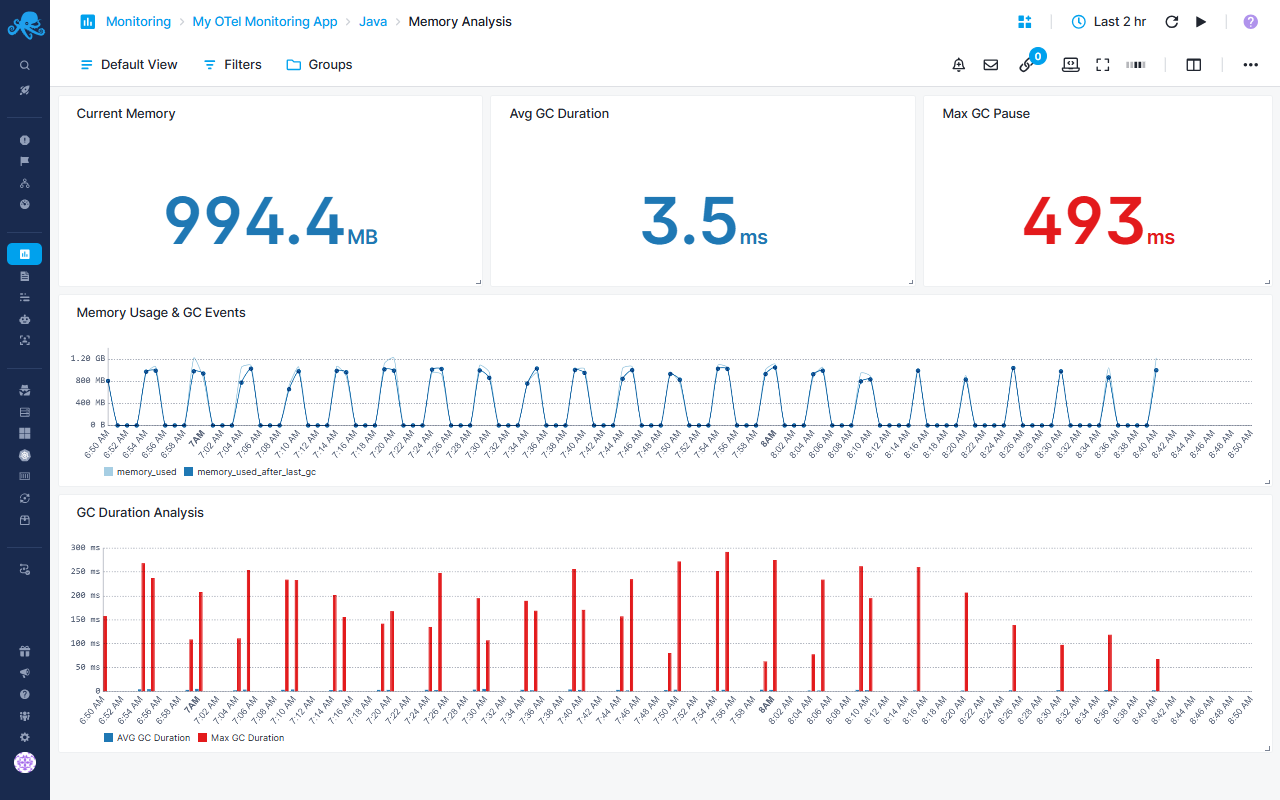
Java-specific Memory Analysis Report
JVM memory usage and garbage collection analysis
Current State Metrics
- Current Memory - Real-time memory usage in bytes (average aggregation)
- Avg GC Duration - Average garbage collection duration in milliseconds
- Max GC Pause - Longest garbage collection pause time (critical for latency-sensitive applications)
Memory & GC Correlation
- Memory Usage & GC Events - Dual-metric chart displaying average memory used vs memory after last GC
- Helps identify memory leak patterns and GC efficiency
GC Performance Analysis
- GC Duration Analysis - Compares average vs maximum GC duration
- Identifies GC pause outliers affecting application performance
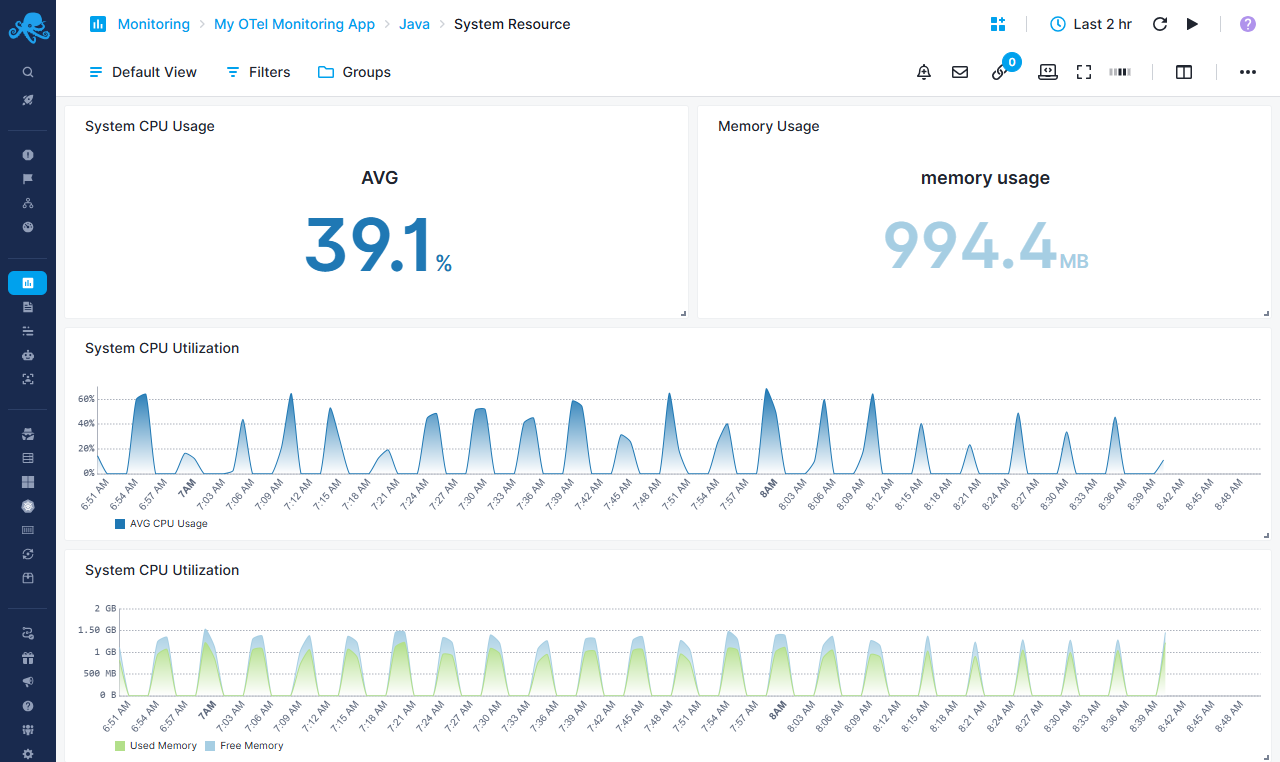
Java-specific System Resource Report
System-level resource consumption tracking
CPU Monitoring
- System CPU Usage - Displays both average and max CPU utilization percentages
- System CPU Utilization - Area chart with gradient showing average CPU usage trends
Memory Tracking
- Memory Usage - Dual metric displaying memory usage vs memory utilization as percentage of commited memory
- System CPU Utilization (Memory view) - Stacked area chart showing used vs free memory
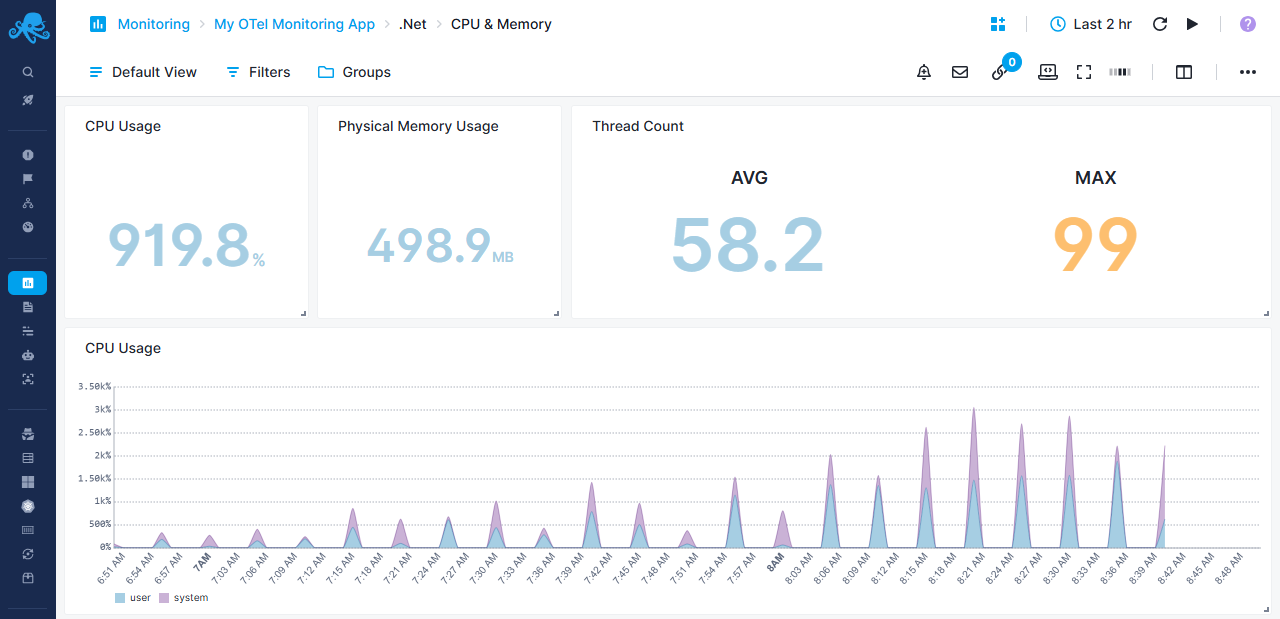
.Net-specific CPU & Memory Report
Track process CPU and memory utilization for .NET applications
Resource Usage Metrics
- CPU Usage - Calculated as (cpu_time / cpu_count) × 100 for percentage utilization
- Physical Memory Usage - RSS (Resident Set Size) in bytes showing actual RAM consumption
- Thread Count - Displays average and maximum thread counts
CPU Utilization Breakdown
- CPU Usage - Stacked area chart separating user CPU time and system CPU time
- Helps identify whether CPU is spent in application code vs system calls
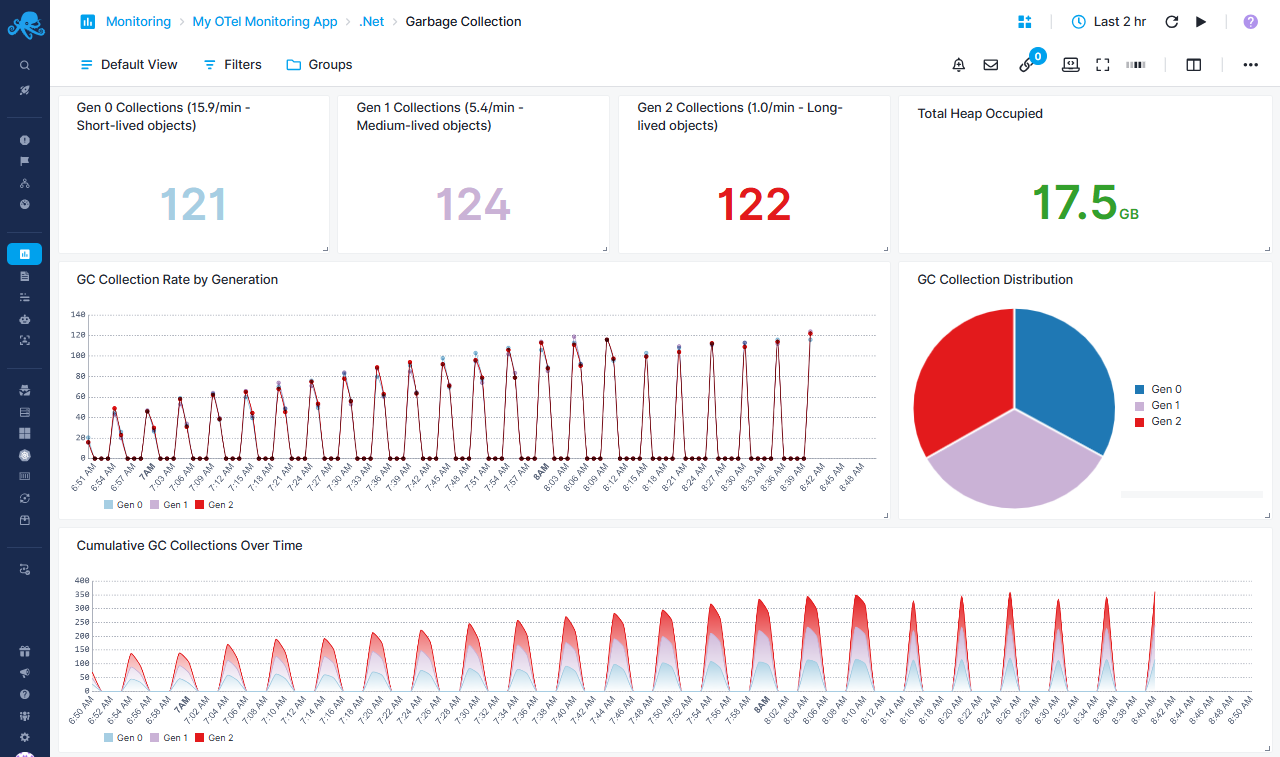
.Net-specific Garbage Collection Report
Monitor .NET garbage collection patterns and heap management
Generation Collection Rates
- Gen 0 Collections - Frequent, fast collections for short-lived objects (example: 15.9/min)
- Gen 1 Collections - Medium-lived objects (example: 5.4/min)
- Gen 2 Collections - Expensive collections for long-lived objects (example: 1.0/min)
- High Gen2 rates indicate potential memory issues or large object heap problems
- Total Heap Occupied - Current heap size in bytes
Collection Trends
- Cumulative GC Collections Over Time - Stacked area chart showing total collections by generation
Collection Rate Analysis
- GC Collection Rate by Generation - Line chart with points tracking collection frequency
- GC Collection Distribution pie chart - Proportional breakdown of collections across generations
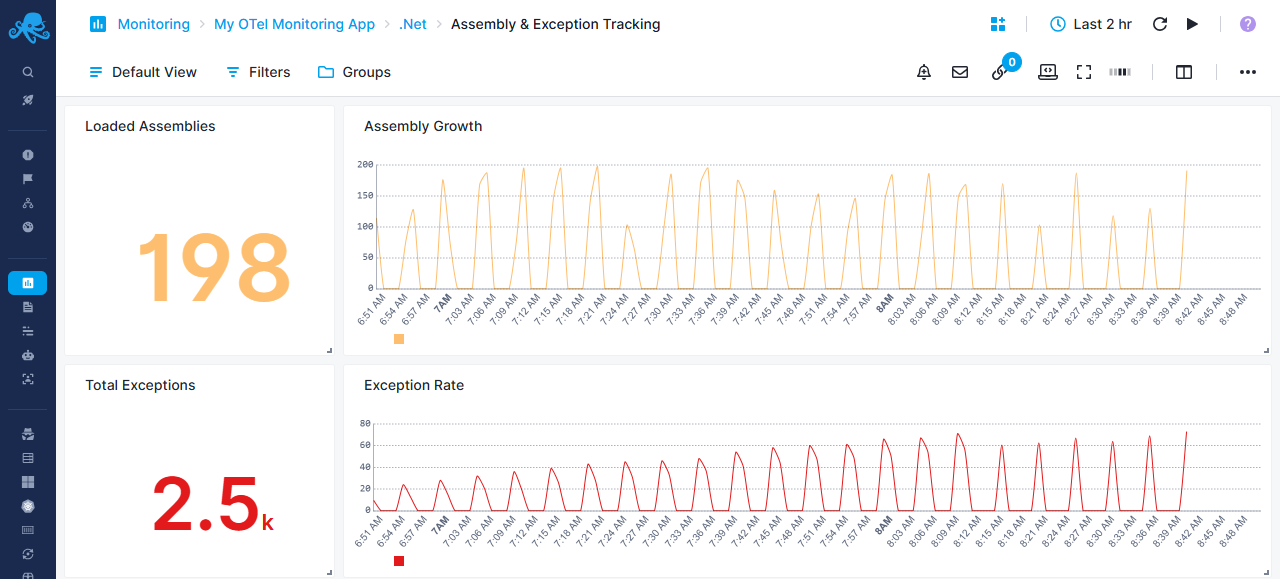
.Net-specific Asembly & Exceptions Report
Monitor assembly loading and exception patterns
Assembly Management
- Loaded Assemblies - Current count of loaded assemblies
- Useful for detecting assembly leak issues
- Assembly Growth - Line chart tracking assembly count over time
- Sudden increases may indicate dynamic loading issues
Exception Monitoring
- Total Exceptions - Cumulative exception count
- Exception Rate - Average exception rate over time
- Helps identify error hotspots and application stability issues
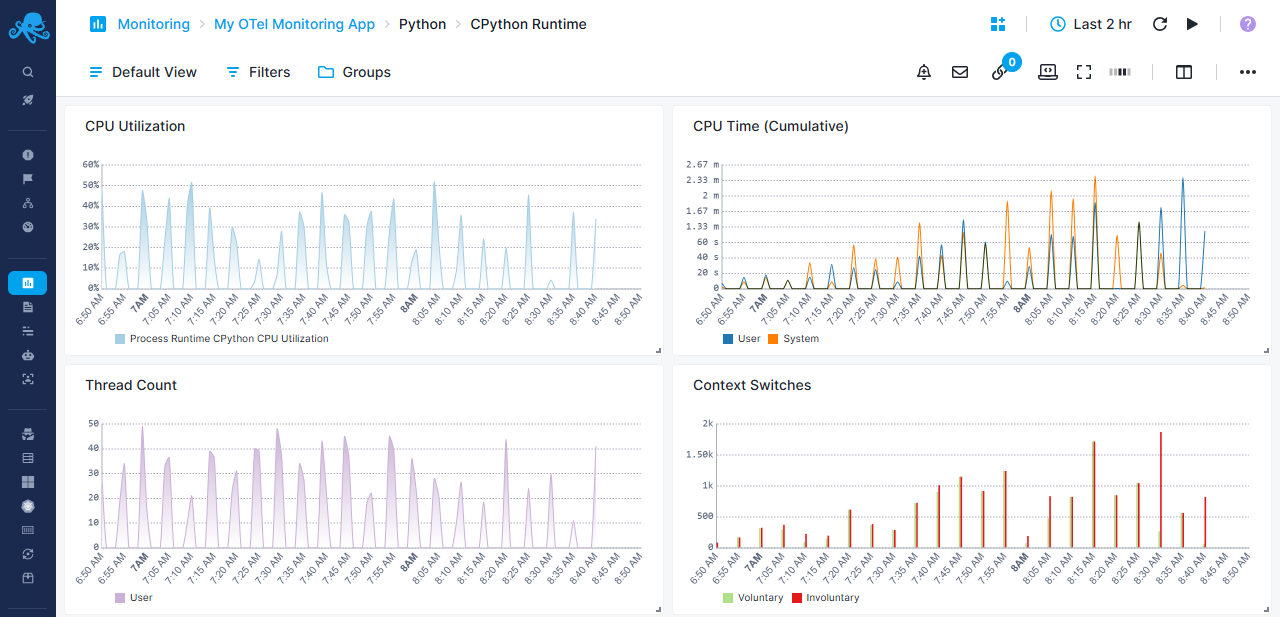
Python-specific CPython Runtime Report
CPython runtime performance monitoring
CPU Metrics
- CPU Utilization - Process CPU usage as percentage
- CPU Time (Cumulative) - Tracks total CPU time consumed
Thread & Context Management
- Thread Count - Average number of active Python threads
- Context Switches - Cumulative context switch tracking voluntary switches vs involuntary switches
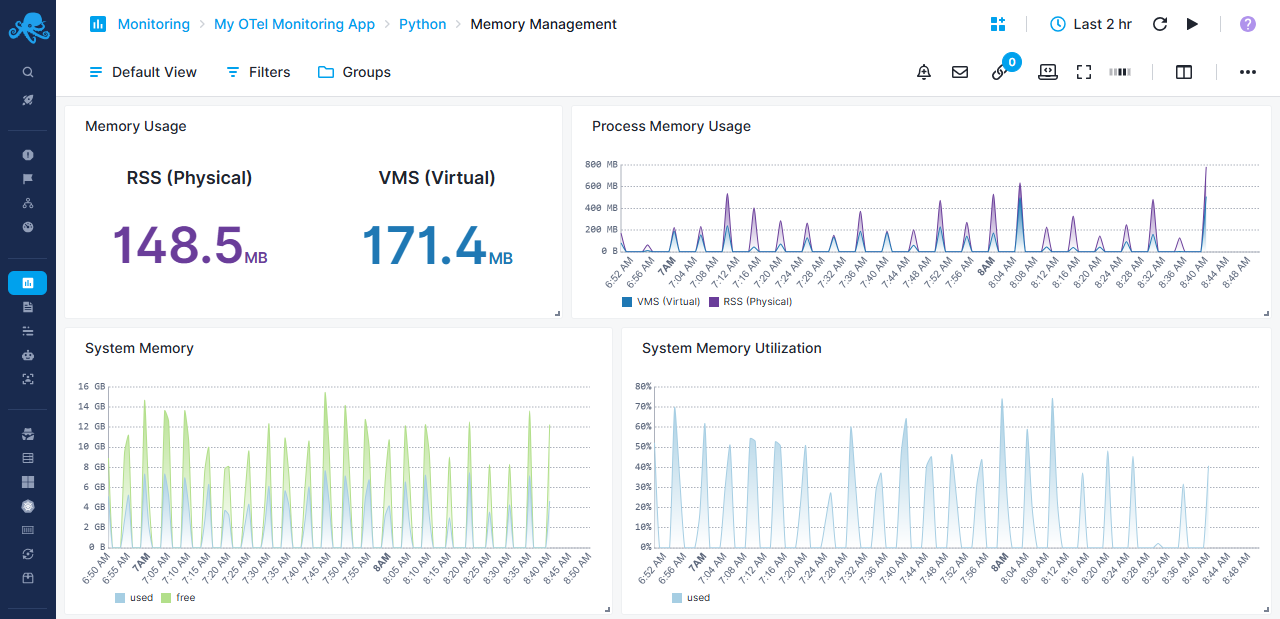
Python-specific Memory Management Report
Python process memory usage patterns
Memory Overview
- Memory Usage - Dual display showing pyhsical RAM usage vs virtual memory size
System Memory Analysis
- System Memory - Stacked area chart with gradient showing used memory vs free memory
- System Memory Utilization - Percentage view of memory usage
Process Memory Tracking
- Process Memory Usage - Stacked area chart comparing VMS vs RSS
- Helps identify memory leaks and allocation patterns
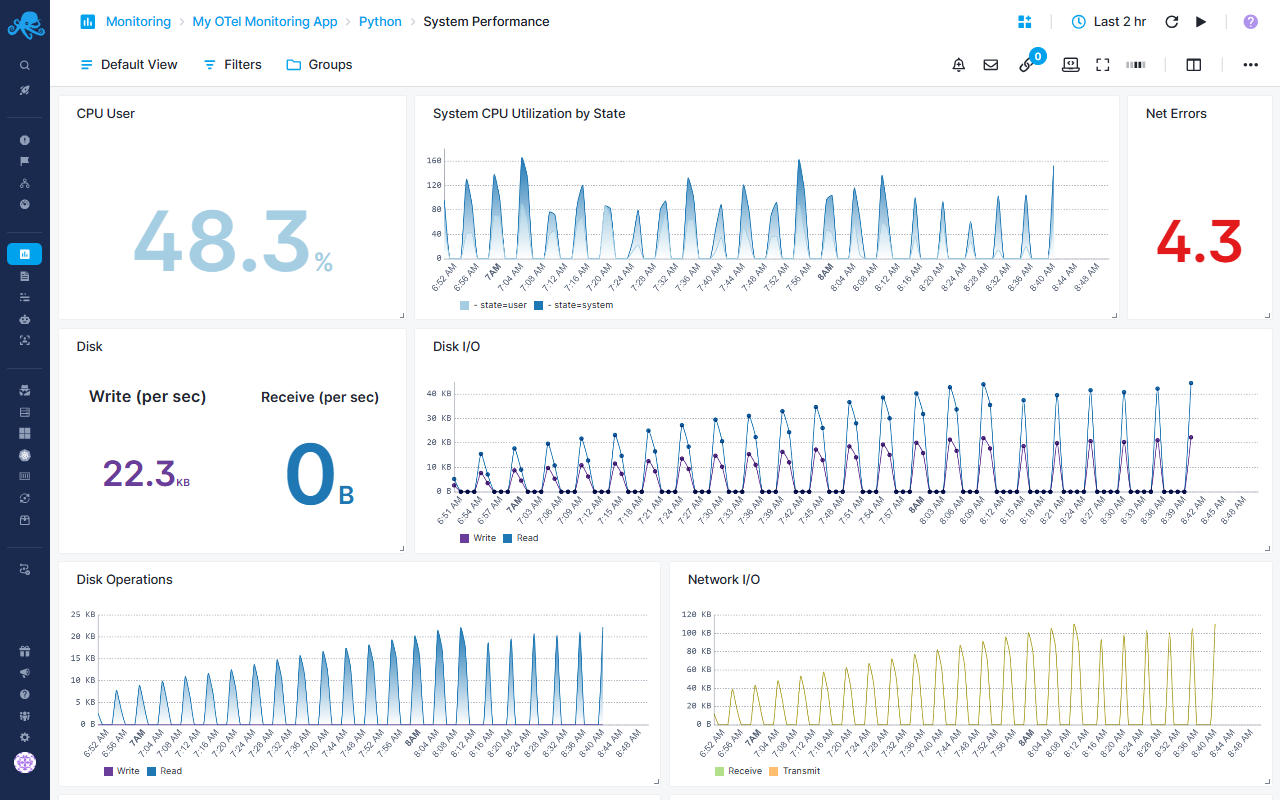
Python-specific System Performance Report
System-level performance and context switching
CPU Monitoring
- CPU User - System CPU usage for user processes as percentage
- System CPU Utilization by State - Area chart breaking down CPU usage by state (user, system, idle, etc.)
Disk Performance
- Disk - Tracks I/O operations: Write vs Receive
- Disk Operations - Stacked area chart with gradient for write/read operations
Network Monitoring
- Net Errors - Count of network errors
- Network I/O - Line chart tracking: Receive vs Transmit
- Network Packets - Line chart showing packet counts: Receive vs Transmit
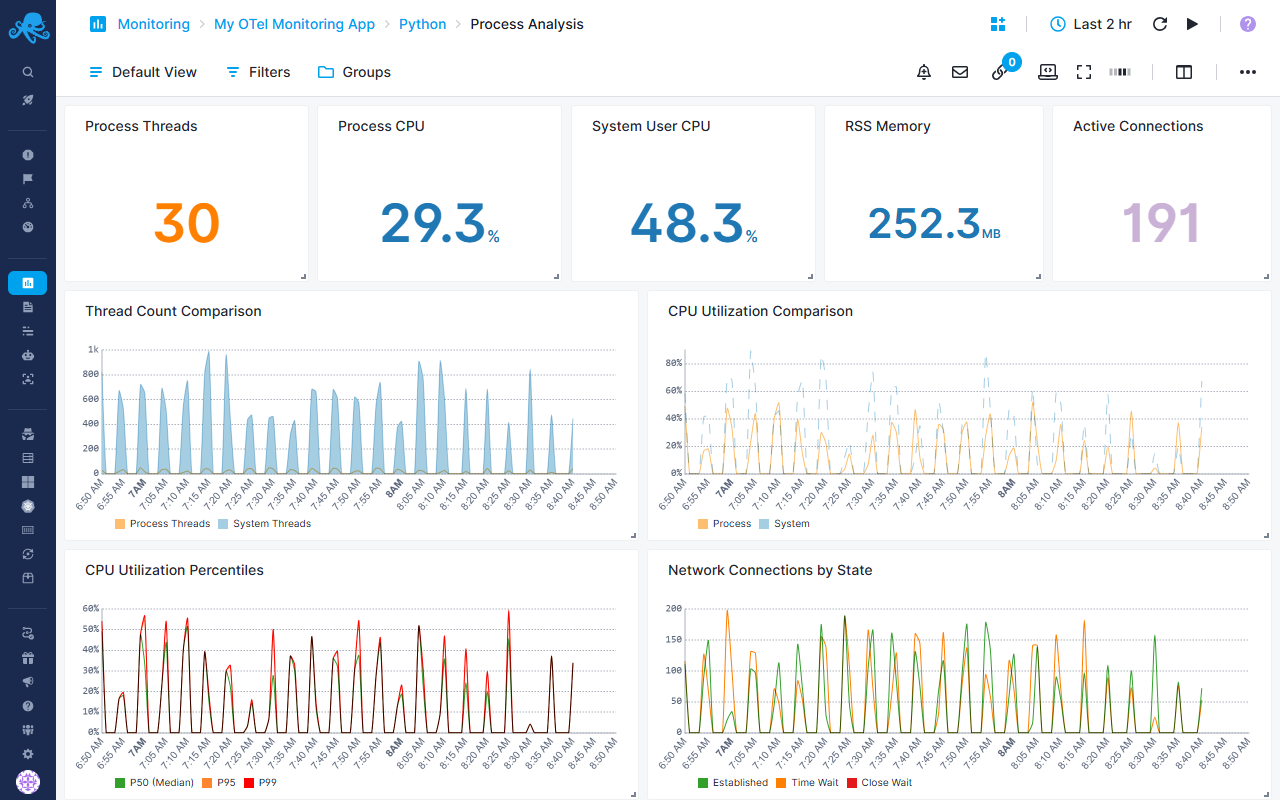
Python-specific Process Analysis Report
Process thread management and CPU analysis
Process Metrics
- Process Threads - Average thread count
- Process CPU - CPU utilization percentage
- System User CPU - System-wide user CPU percentage
- RSS Memory - Physical memory usage
- Active Connections - Number of established network connections
Comparative Analysis
- Thread Count Comparison - Compares: Process vs System Threads
- CPU Utilization Comparison - Overlays: Process CPU vs System CPU
CPU Percentiles
- CPU Utilization Percentiles - Multi-percentile view:
- P50 (Median)
- P95
- P99
- Helps identify CPU usage distribution and outliers
Network Connections
- Network Connections by State - Tracks connections:
- Established
- Time Wait
- Close Wait
- Useful for identifying connection leak or timeout issues
Default Metric Alerts
Pre-configured alert rules will notify you about:
- HTTP Server Error Rate Anomaly Alert: Alerts when services exhibit abnormal spikes in 4xx/5xx HTTP response codes, indicating application issues, bad requests, or service degradation.
- HTTP Client Error Rate Anomaly Alert: Alerts when services experience abnormal spikes in 4xx/5xx errors from outbound HTTP calls to dependencies. Indicates issues with downstream services, API misconfigurations, or authentication problems affecting external integrations.
- HTTP Client Latency Anomaly Alert: Alerts on unusual increases in outbound HTTP request response times, grouped by service and route. Detects performance degradation in downstream dependencies that often precedes complete failures and impacts user experience.
- HTTP Server Latency Anomaly Alert: Alerts on unusual increases in server-side request processing time, grouped by service and HTTP route. Detects performance degradation from application code issues, resource contention, or downstream dependency slowness that impacts user-facing response times.
- Database Connection Pool Timeout Alert: Alerts when database connection timeout events exceed 5 occurrences within a 10-minute period, indicating the database layer is struggling to handle connection requests. Early warning sign of database saturation or connectivity issues.
- Database Connection Pool Saturation Alert: Alerts when pending database connection requests exceed 10 within a 10-minute window, signaling that the connection pool is at or near capacity. Indicates insufficient database connection resources or slow query execution blocking connections.
- JVM Memory Pressure Alert: Alerts when JVM memory utilization exceeds 85% of committed memory for 5 minutes, indicating potential memory exhaustion. Warns of approaching out-of-memory conditions that could cause application crashes or severe performance degradation.
- JVM Long Garbage Collection Pauses Alert: Alerts when JVM garbage collection pauses exceed 1 second within a 5-minute window. Long GC pauses cause application freezes, request timeouts, and degraded user experience, often indicating memory pressure or inefficient memory usage patterns.
- High CPU Usage Alert: Alerts when process CPU utilization exceeds 70% over a 10-minute period. Indicates compute resource saturation that can lead to request queueing, increased latency, and potential service instability.
- Database Query Performance Degradation Alert: Alerts on anomalous increases in average database query execution time over a 10-minute window. Detects performance degradation from inefficient queries, missing indexes, lock contention, or database resource constraints before they cause widespread application slowdowns.
Logs
After following the SDK-specific instructions, your logs will automatically have useful metadata in every log.
Common fields include:
service.name- Your applications's nameservice.version- Your applications's versiondeployment.environment- Where it's running (dev, prod, etc.)os.host- Server namecontainer.name- Docker container nametrace.idandspan.id- Identifiers that connect a log entry with a specific trace or span. These fields are useful because they allow you to start from a trace or span and then find the related logs to see detailed context about what happened during that request.
Once data is in, you can explore it via the built-in reports:
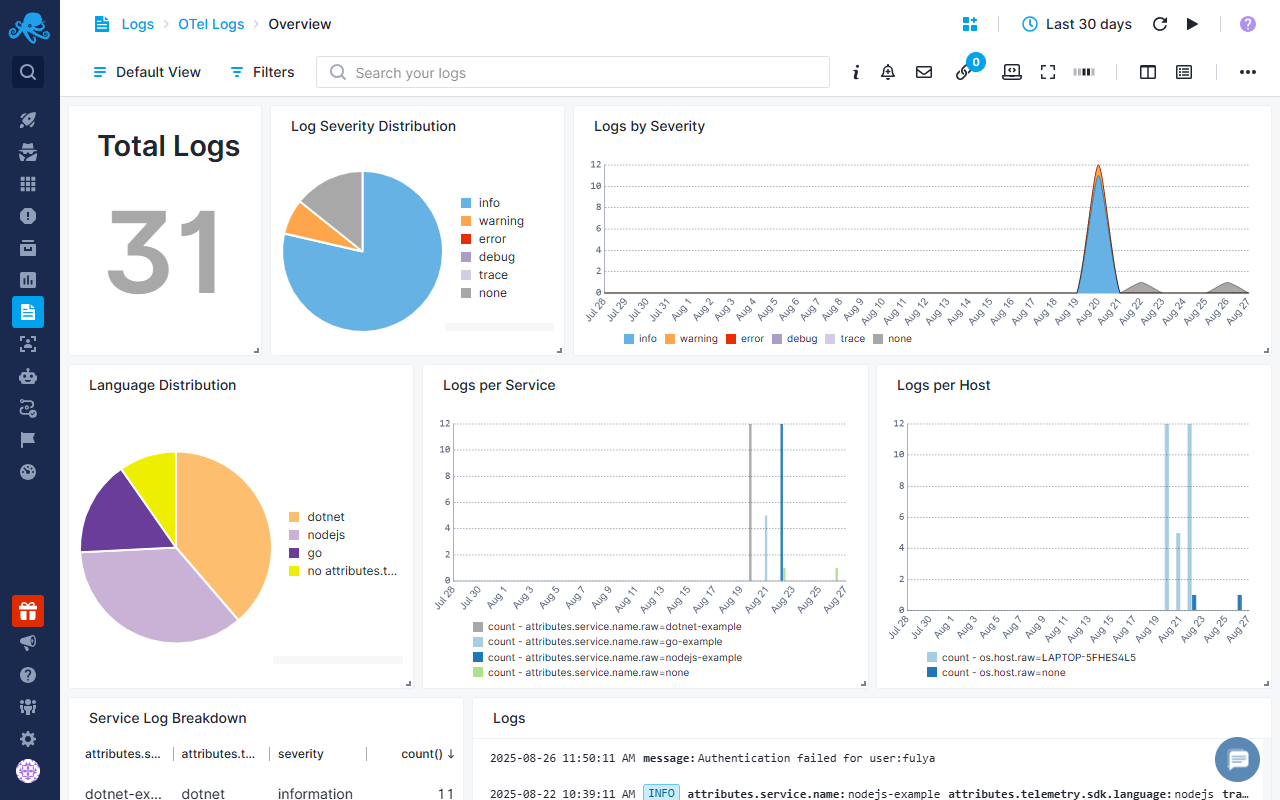
Overview Report
Overview report provides a view of your system's state/status/health with visual analytics including total log counts, severity distribution (info, warning, error, debug, trace), SDK breakdown, service-by-service activity monitoring, host distribution analysis, and timeline visualizations showing activity patterns over time. You can drill down from these visualizations to investigate issues and understand how your system behaves across services and environments.
Explore Report
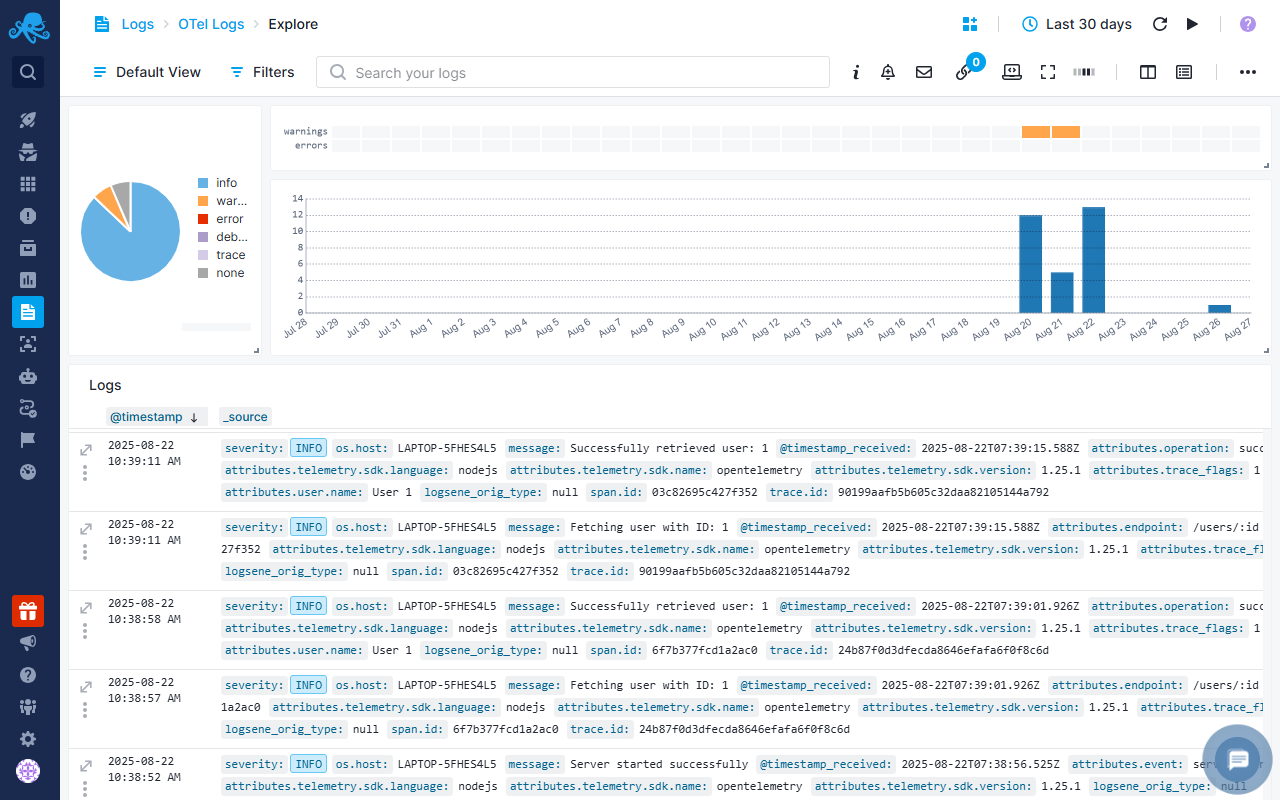
Explore report lets you see raw logs in the Logs Table. Here you can use Quick Actions such as creating alerts, adding logs to dashboards, or applying filters. You can save common queries as Saved Views for faster access later. You can also correlate logs with Events such as deployments, scaling actions, or configuration changes to understand when and why issues started. This makes troubleshooting faster because you can connect changes in your system directly with the log activity they caused.
Default Log Alerts
Moreover, the pre-configured alert rules will notify you about:
- Anomaly alerts: Alerts when there are abnormal spikes in error and warning logs
- Service Heartbeat Alert: Alerts when a service stops sending logs for an extended period, indicating the service may have crashed, been terminated, or lost connectivity.
- Infrastructure Resource Exhaustion Alert: Alerts on critical resource exhaustion events by detecting keywords indicating system limits have been reached. Triggers immediately on memory, disk, or connection pool depletion to enable rapid intervention before complete service failure.
- Authentication Attack Detection Alert: Alerts on potential brute force or credential stuffing attacks by monitoring failed authentication attempts.
- Database Connectivity Issues: Alerts on database connection problems and query failures that could indicate database server issues, network problems, or connection pool exhaustion. Early detection prevents cascading application failures when database connectivity is degraded.
Event Correlation
Sending events to Sematext Cloud alongside your OpenTelemetry logs helps you understand the context behind changes in your system. Events can include deployments, service restarts, configuration changes, scaling actions, or other operational milestones. By correlating these events with logs, you can quickly identify the root cause of issues and see how system activity aligns with key changes.
We recommend using the Sematext API to send events whenever these operational changes occur. Include key metadata such as environment and version.
This enables you to: - Quickly determine if a spike in error logs corresponds with a recent deployment or configuration change. - Investigate issues by checking whether log patterns align with operational events. - Understand trends in your system by visualizing event-driven log activity over time.
For example, if an error surge happens after a new release, the event log helps you immediately pinpoint the deployment responsible, reducing troubleshooting time and helping maintain system reliability.
Once your events are in Sematext Cloud, you can view them by toggling on the Events heatbar in your OpenTelemetry Logs App’s Explore report. Hovering over the heatbar shows the number of events that occurred within a specific timeframe. Clicking on a section opens a flyout where you can see detailed event information and directly correlate with your logs.
The recording below shows how events can help when you receive an anomaly alert about a sudden spike in errors in your logs. - Filter for errors in your OpenTelemetry Logs App - Toggle on the Events heatmap to see recent changes - Notice two new events in the last few minutes - Open the details and see a deployment that likely caused the spike
Troubleshooting
If you have trouble sending logs or metrics, try out the latest version of Sematext Agent. Also, make sure Sematext Agent is configured to send logs and metrics to your OpenTelemetry Logs or Monitoring App.