Quick Start
After you get logged into Sematext Cloud at https://apps.sematext.com (or https://apps.eu.sematext.com if using Sematext Cloud Europe), the first step is to create a Service Monitoring App or an Infrastructure Monitoring App.
Refer to Service Monitoring vs Infrastructure Monitoring for more details.
An App is an independent namespace for your data. For example, if you have a development and a production environment, it might make sense to have one App for each. You can create as many Apps as you want.
Creating an Infrastructure Monitoring App
Go to the All Apps page by clicking the Octi icon in the top left corner of the main navigation menu. From there, create an Infrastructure Monitoring App.
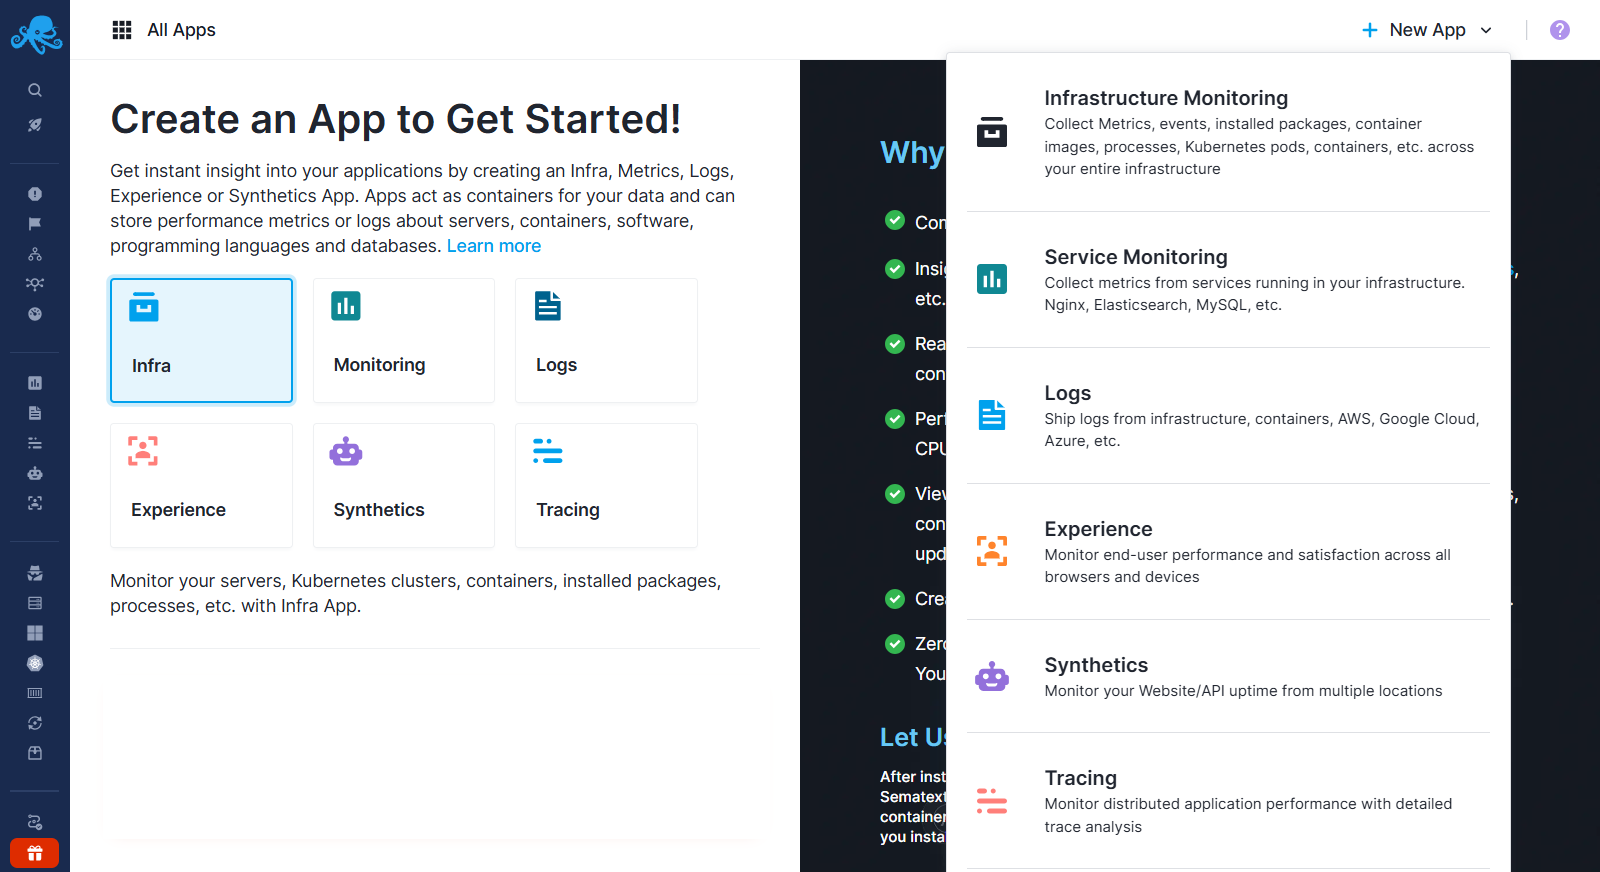
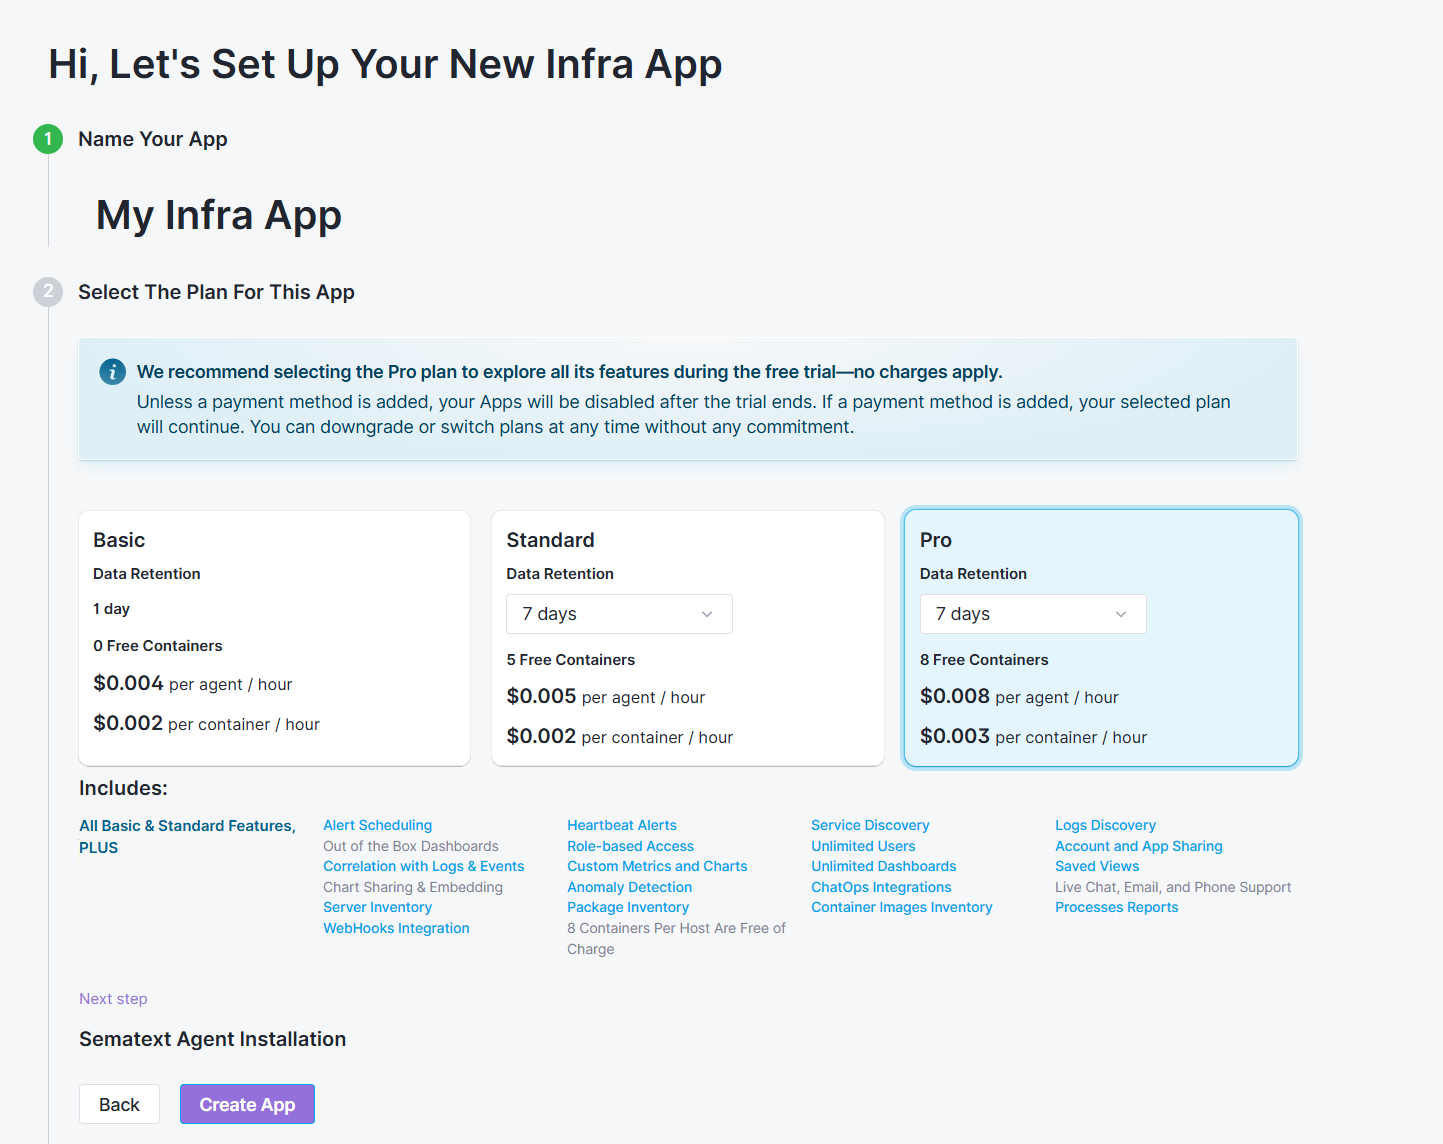
Add a name, select the plan, and click Create App.
Proceed with the next step to choose your environment and install Sematext Agent.
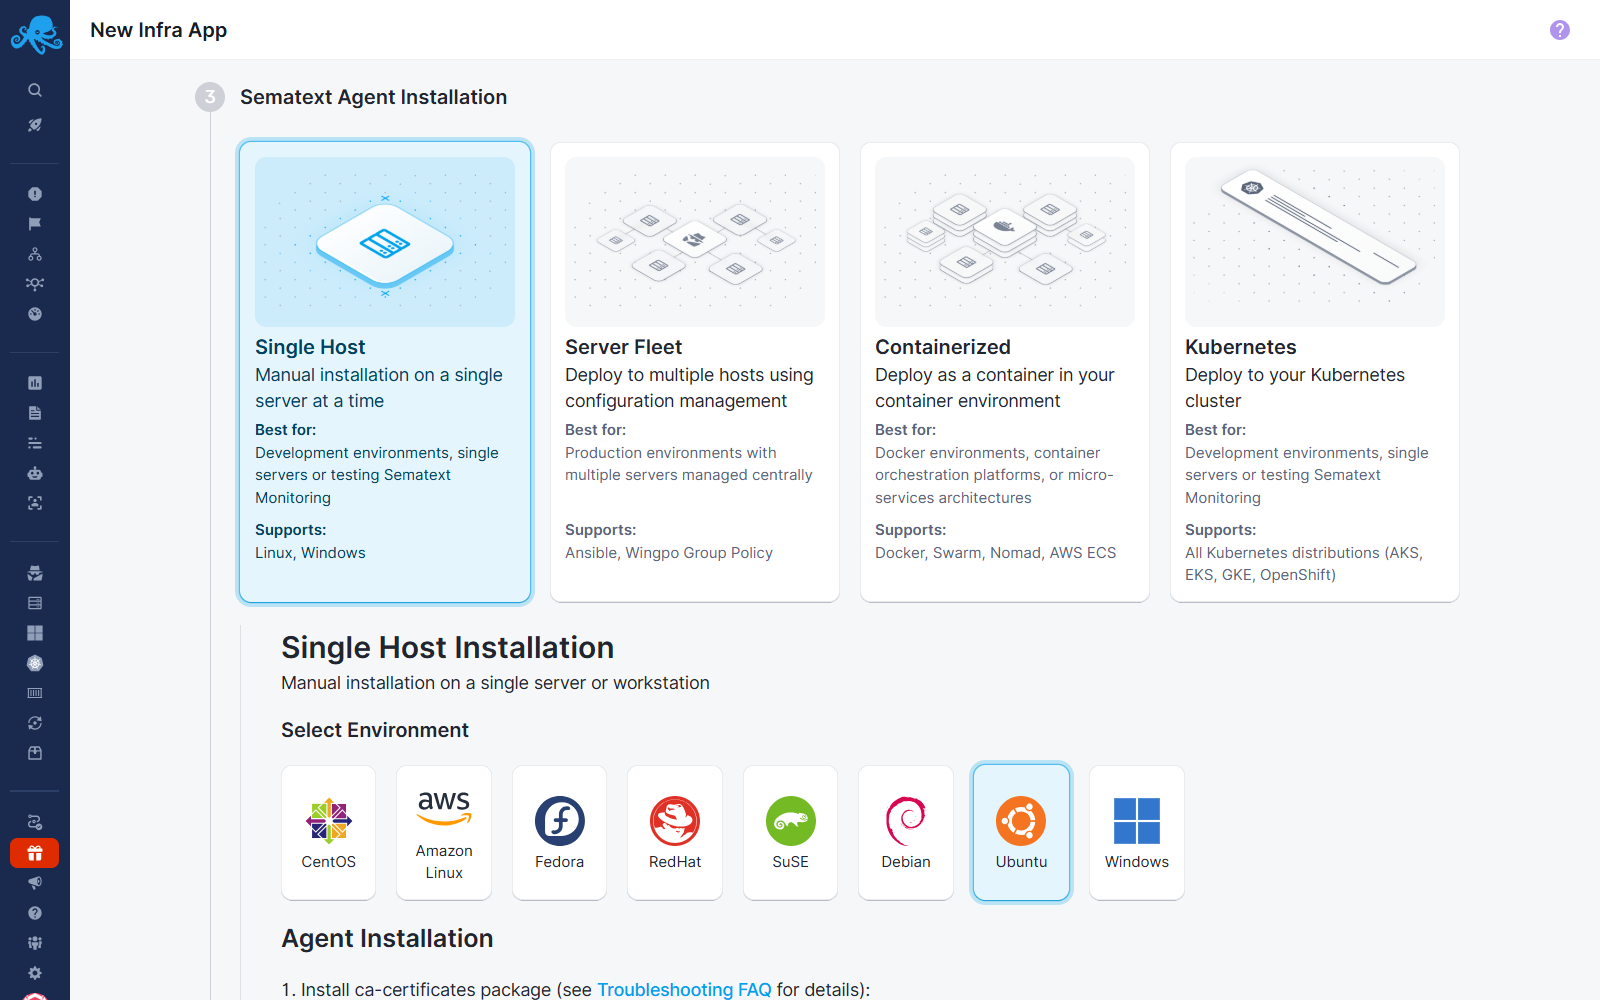
Based on your environment, follow the Agent installation instructions and data will start flowing in! After the metrics are being shipped, infrastructure metrics will be available under the Infrastructure Monitoring section in the left navigation menu.
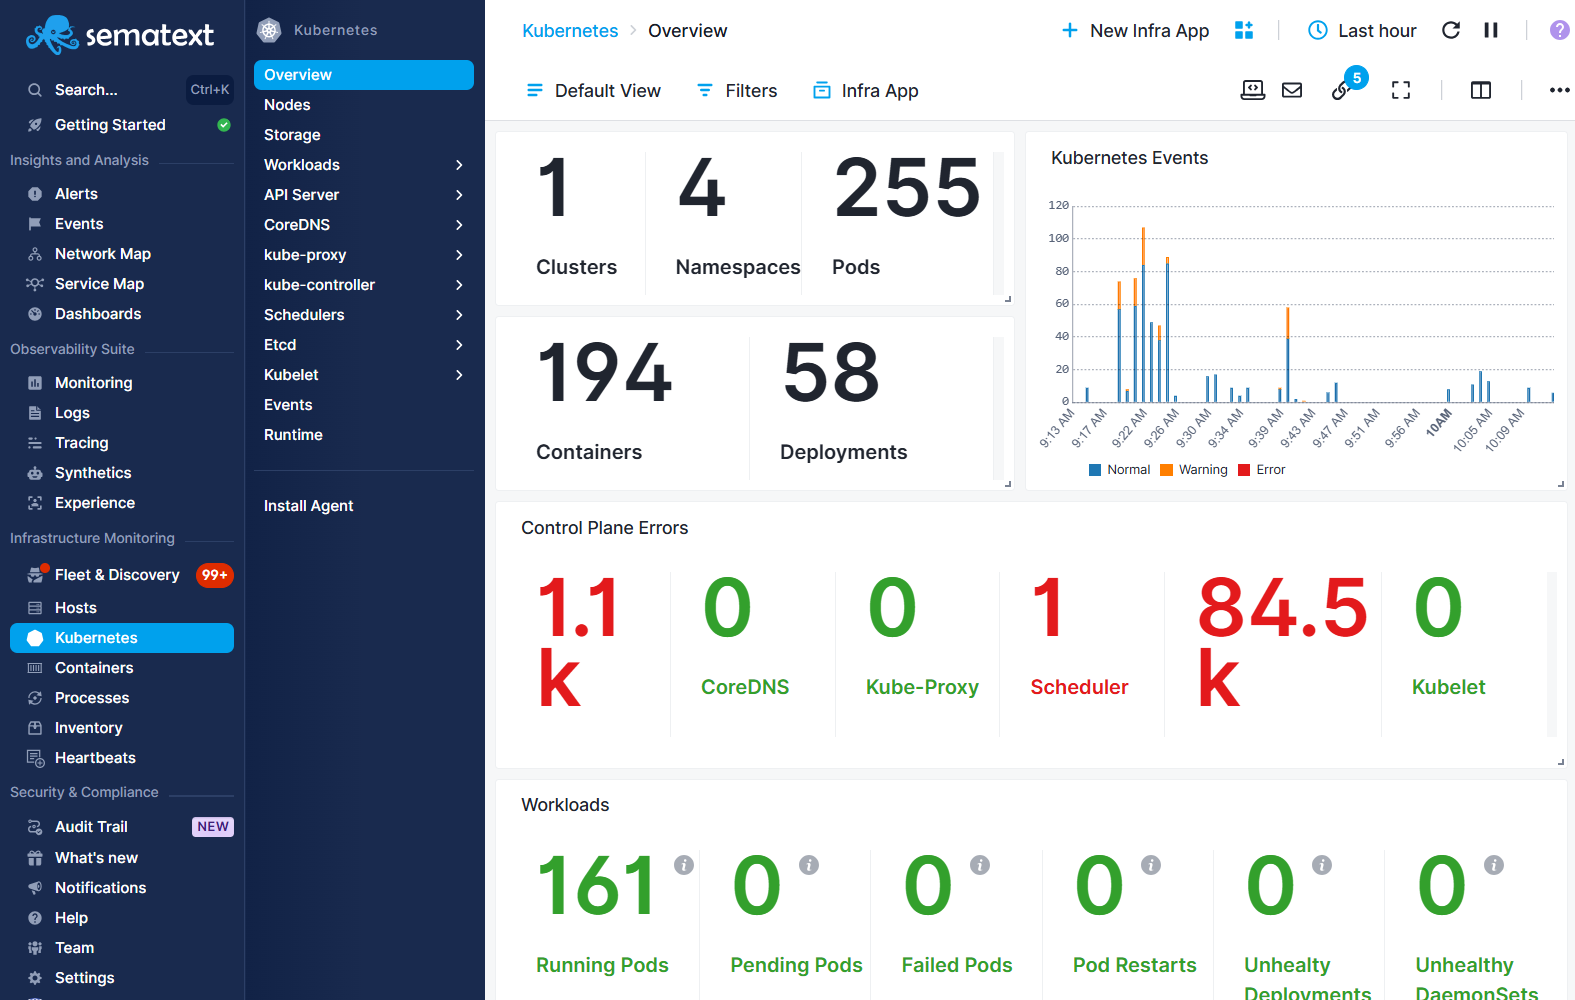
Once you have data flowing you can analyze metrics by a number of context-aware filters, add alerts and anomaly detection, and correlate metrics with events and logs.
Creating a Service Monitoring App
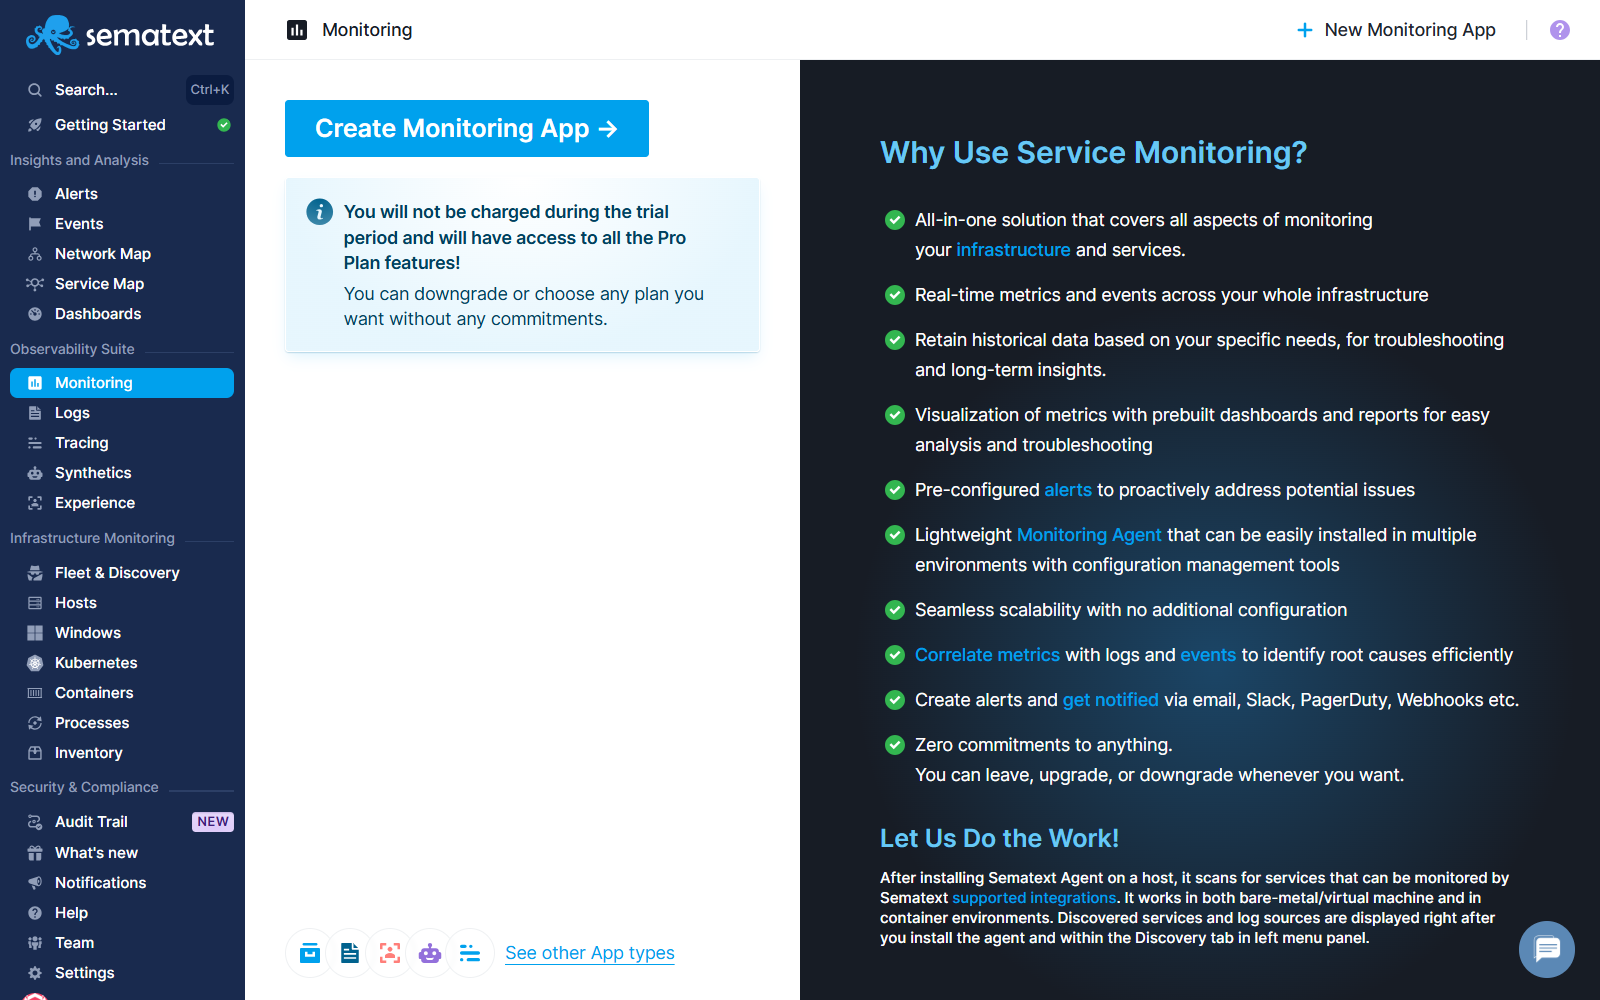
Go to the Observability Suite → Monitoring section in the left navigation menu and create a Service Monitoring App.
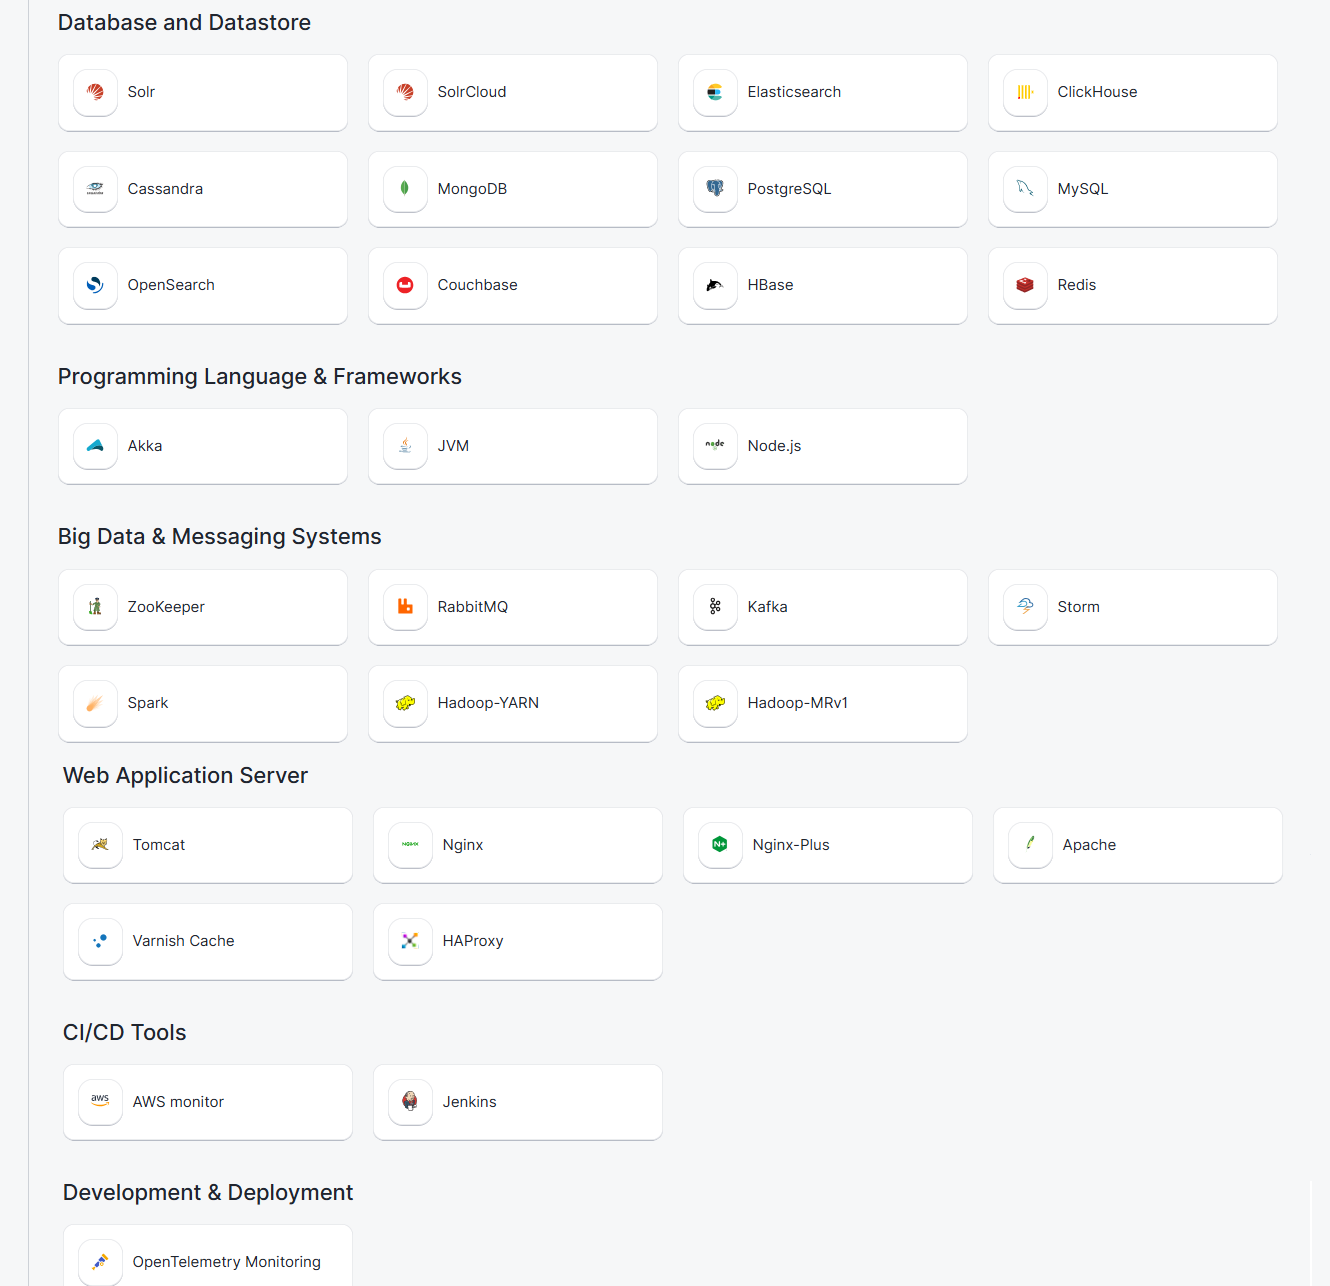
Choose one of the many available integrations.
Add a name, select the plan, and click Create App. At this step, if you don't already have an Infrastructure App, we will create one for you. Refer to Service vs Infrastructure Monitoring for more information.
Proceed with the next step to choose your environment and install Sematext Agent.

Based on your environment, follow the Agent installation instructions and data will start flowing in! After the App is created and the service metrics are being shipped, Service Monitoring App will be visible under Observability Suite → Monitoring section in the left navigation menu.
Once you have data flowing you can analyze metrics by a number of context-aware filters, add alerts and anomaly detection, and correlate metrics with events and logs.
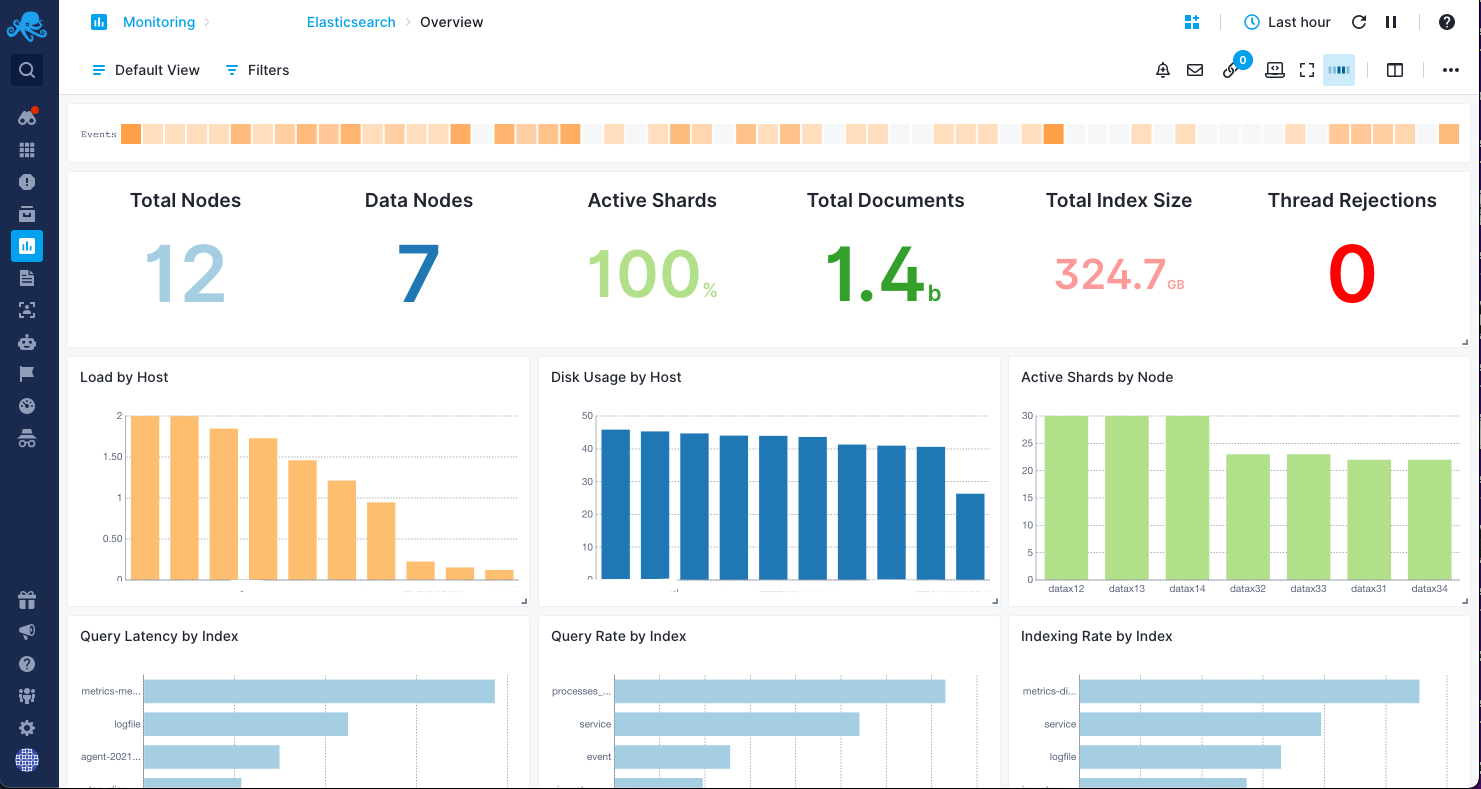
You can have any number of Monitoring Apps and each App can be shared with different people, giving them different access roles. Each App has its own plan.
Setting up Monitoring Agents
Metrics are shipped to Sematext Monitoring using the Sematext Agent, a lightweight, blazing fast Go-based Monitoring Agent with a tiny footprint for various infrastructure environments including Kubernetes. It also collects metrics for a number of integrations using integration-specifc App Agents.
The agent installation instructions are shown in the UI and you can also see them under individual integrations.
Once the agent is set up metrics will start coming to Sematext instantly. If you do not see performance charts 5 minutes after setting up the agent, have a look at the troubleshooting page.
Monitoring App Layout
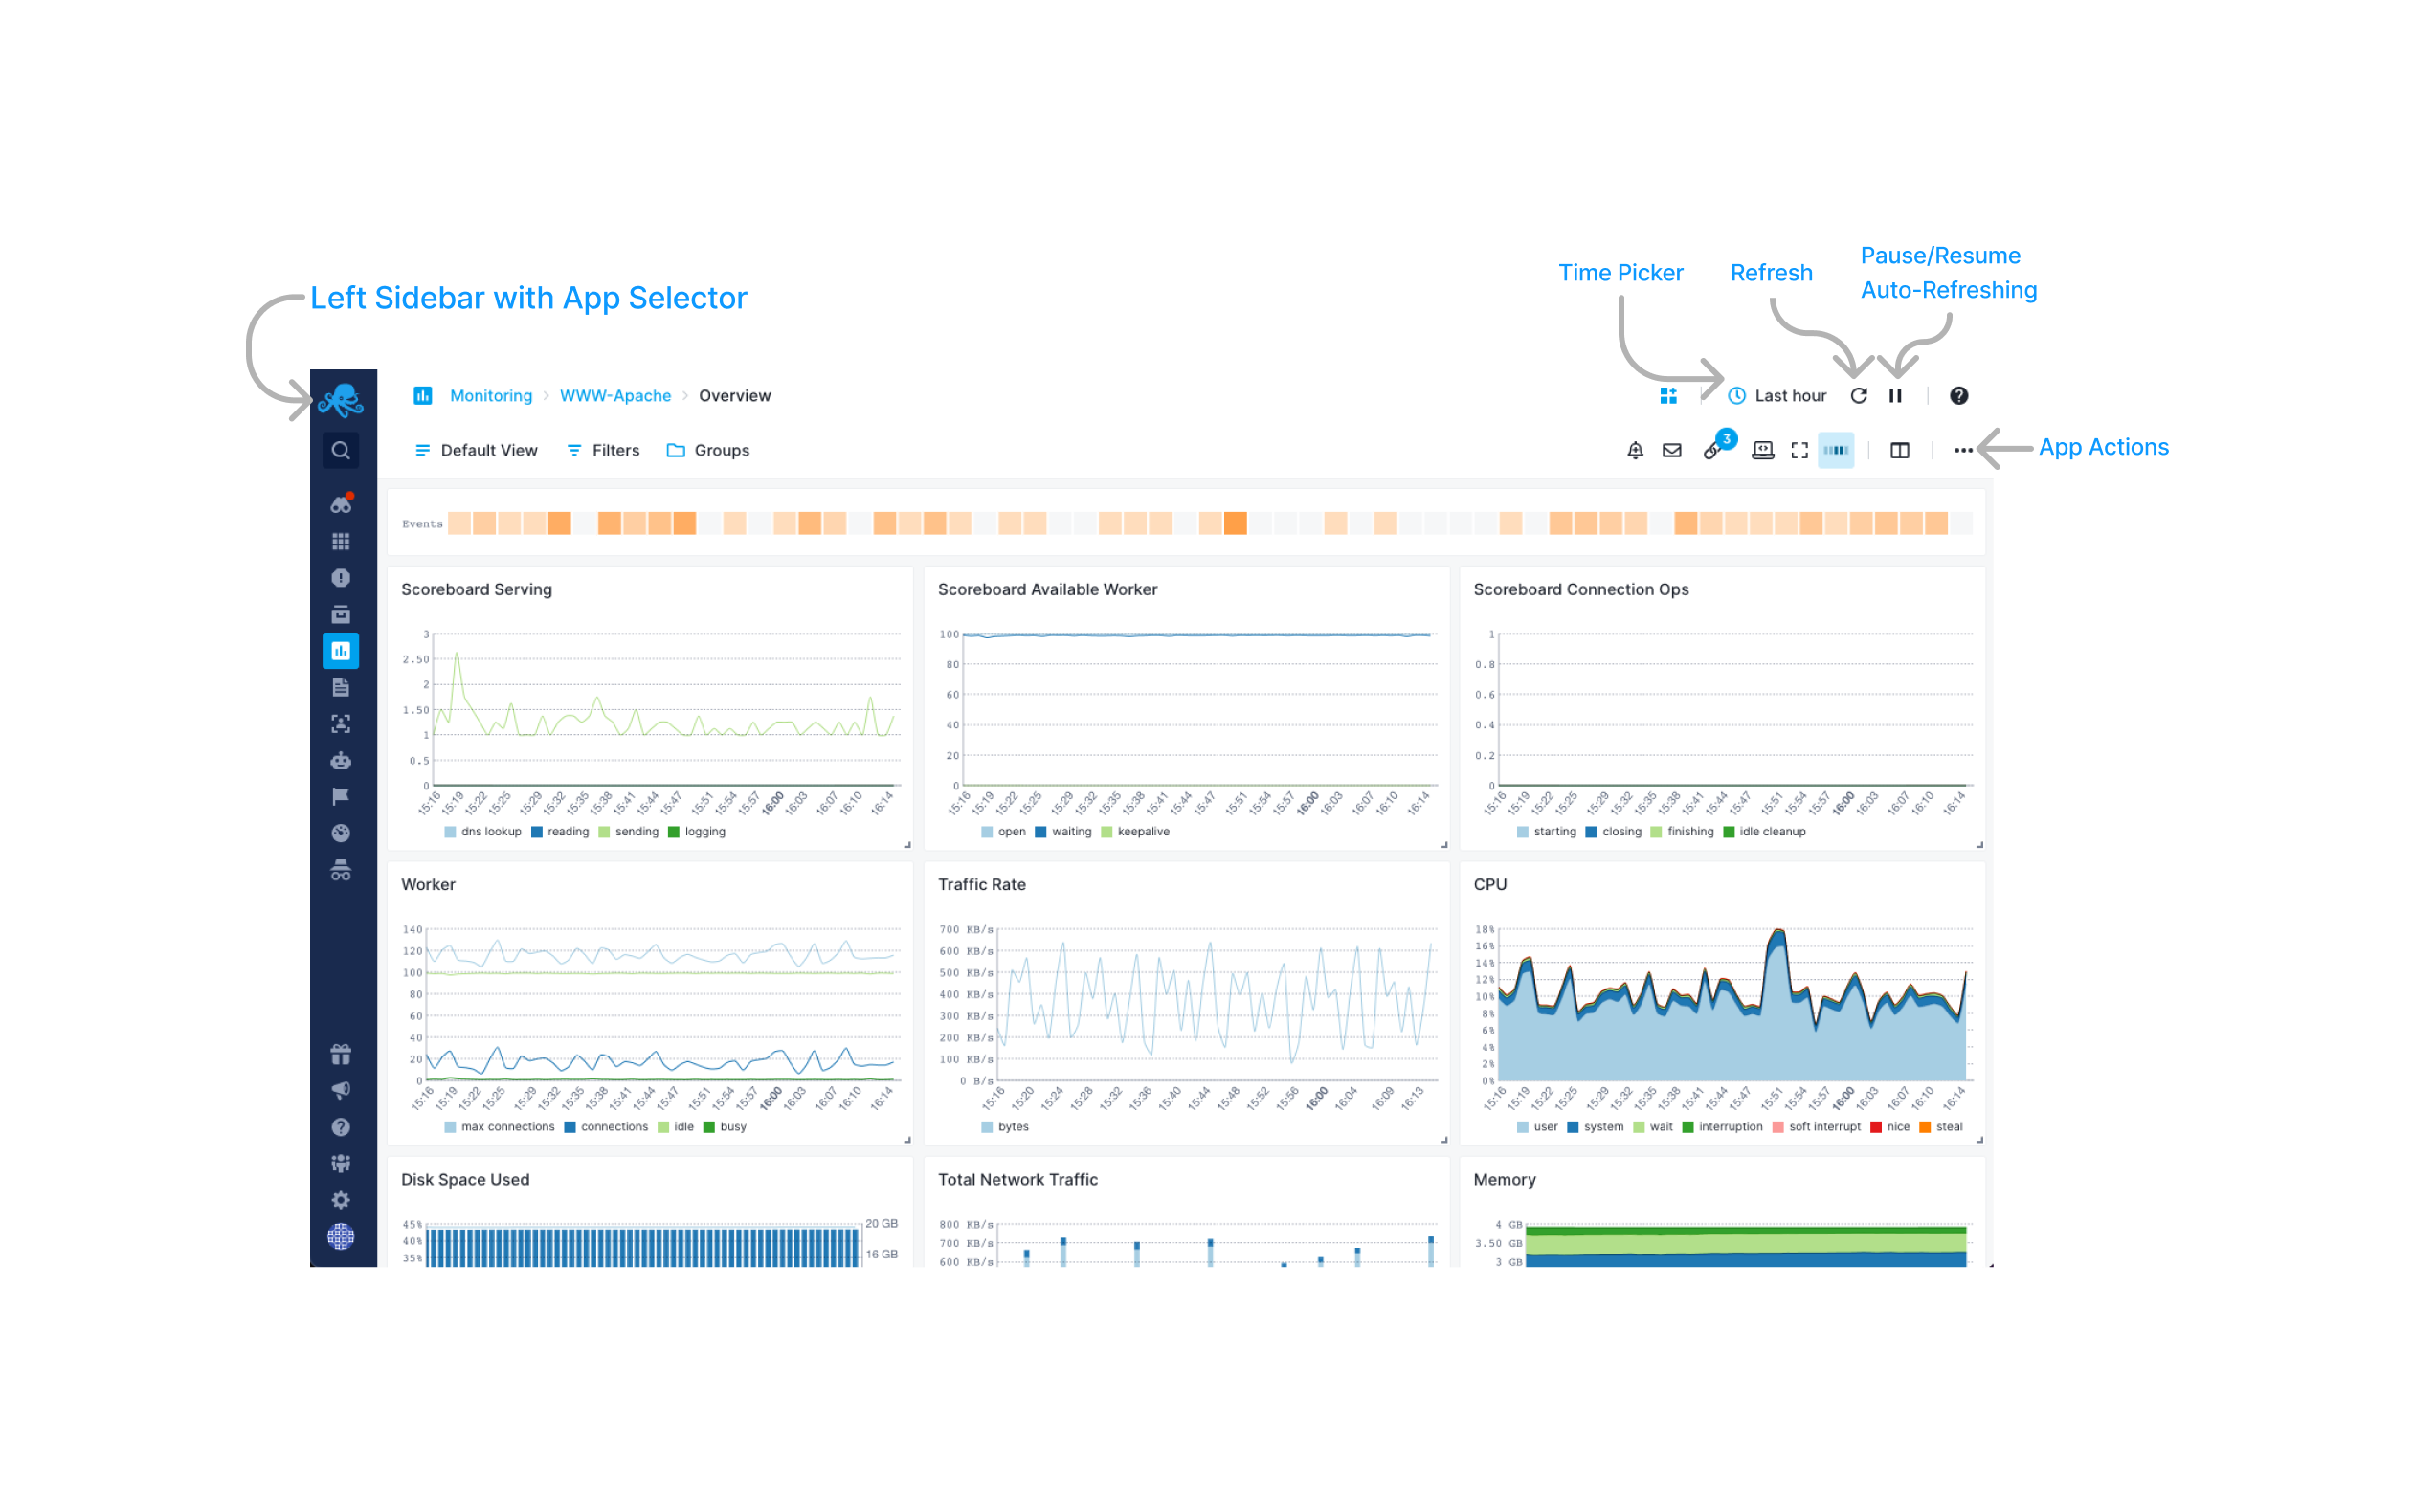
Here's the default monitoring view of an App and shown are the main application and system elements.
