Correlating Metrics
Why and When to Correlate Performance Metrics
Correlating performance metrics is a great way to troubleshoot faster than with traditional monitoring tools. Correlation can be performed manually via the Sematext Cloud UI, or with your AI agent of choice using the Sematext Cloud MCP Server.
What to Correlate
When troubleshooting (performance) issues you will most likely want to correlate performance metrics with logs or events.
Correlating Performance Metrics with Logs
Often times performance issues correlate with an increase in error or warning logs. Correlating a performance spike, dip, or any other anomaly with logs will often lead you to error logs that will either immediately explain what is going on or will at least guide you in the right direction. You can correlate any Monitoring App's report with any Log App's report. Any Connected Apps will be more easily accessible during correlation, so consider connecting your Apps approrpriately.
Correlating Performance Metrics with Events
Tracking your deployments in Sematext is strongly encouraged as it allows you to correlate changes in performance with your deployments. Given that performance profiles can change after deployments, this is a great way to track a change in performance back to a deployment and all the way down to invididual commits that were included in the deployment.
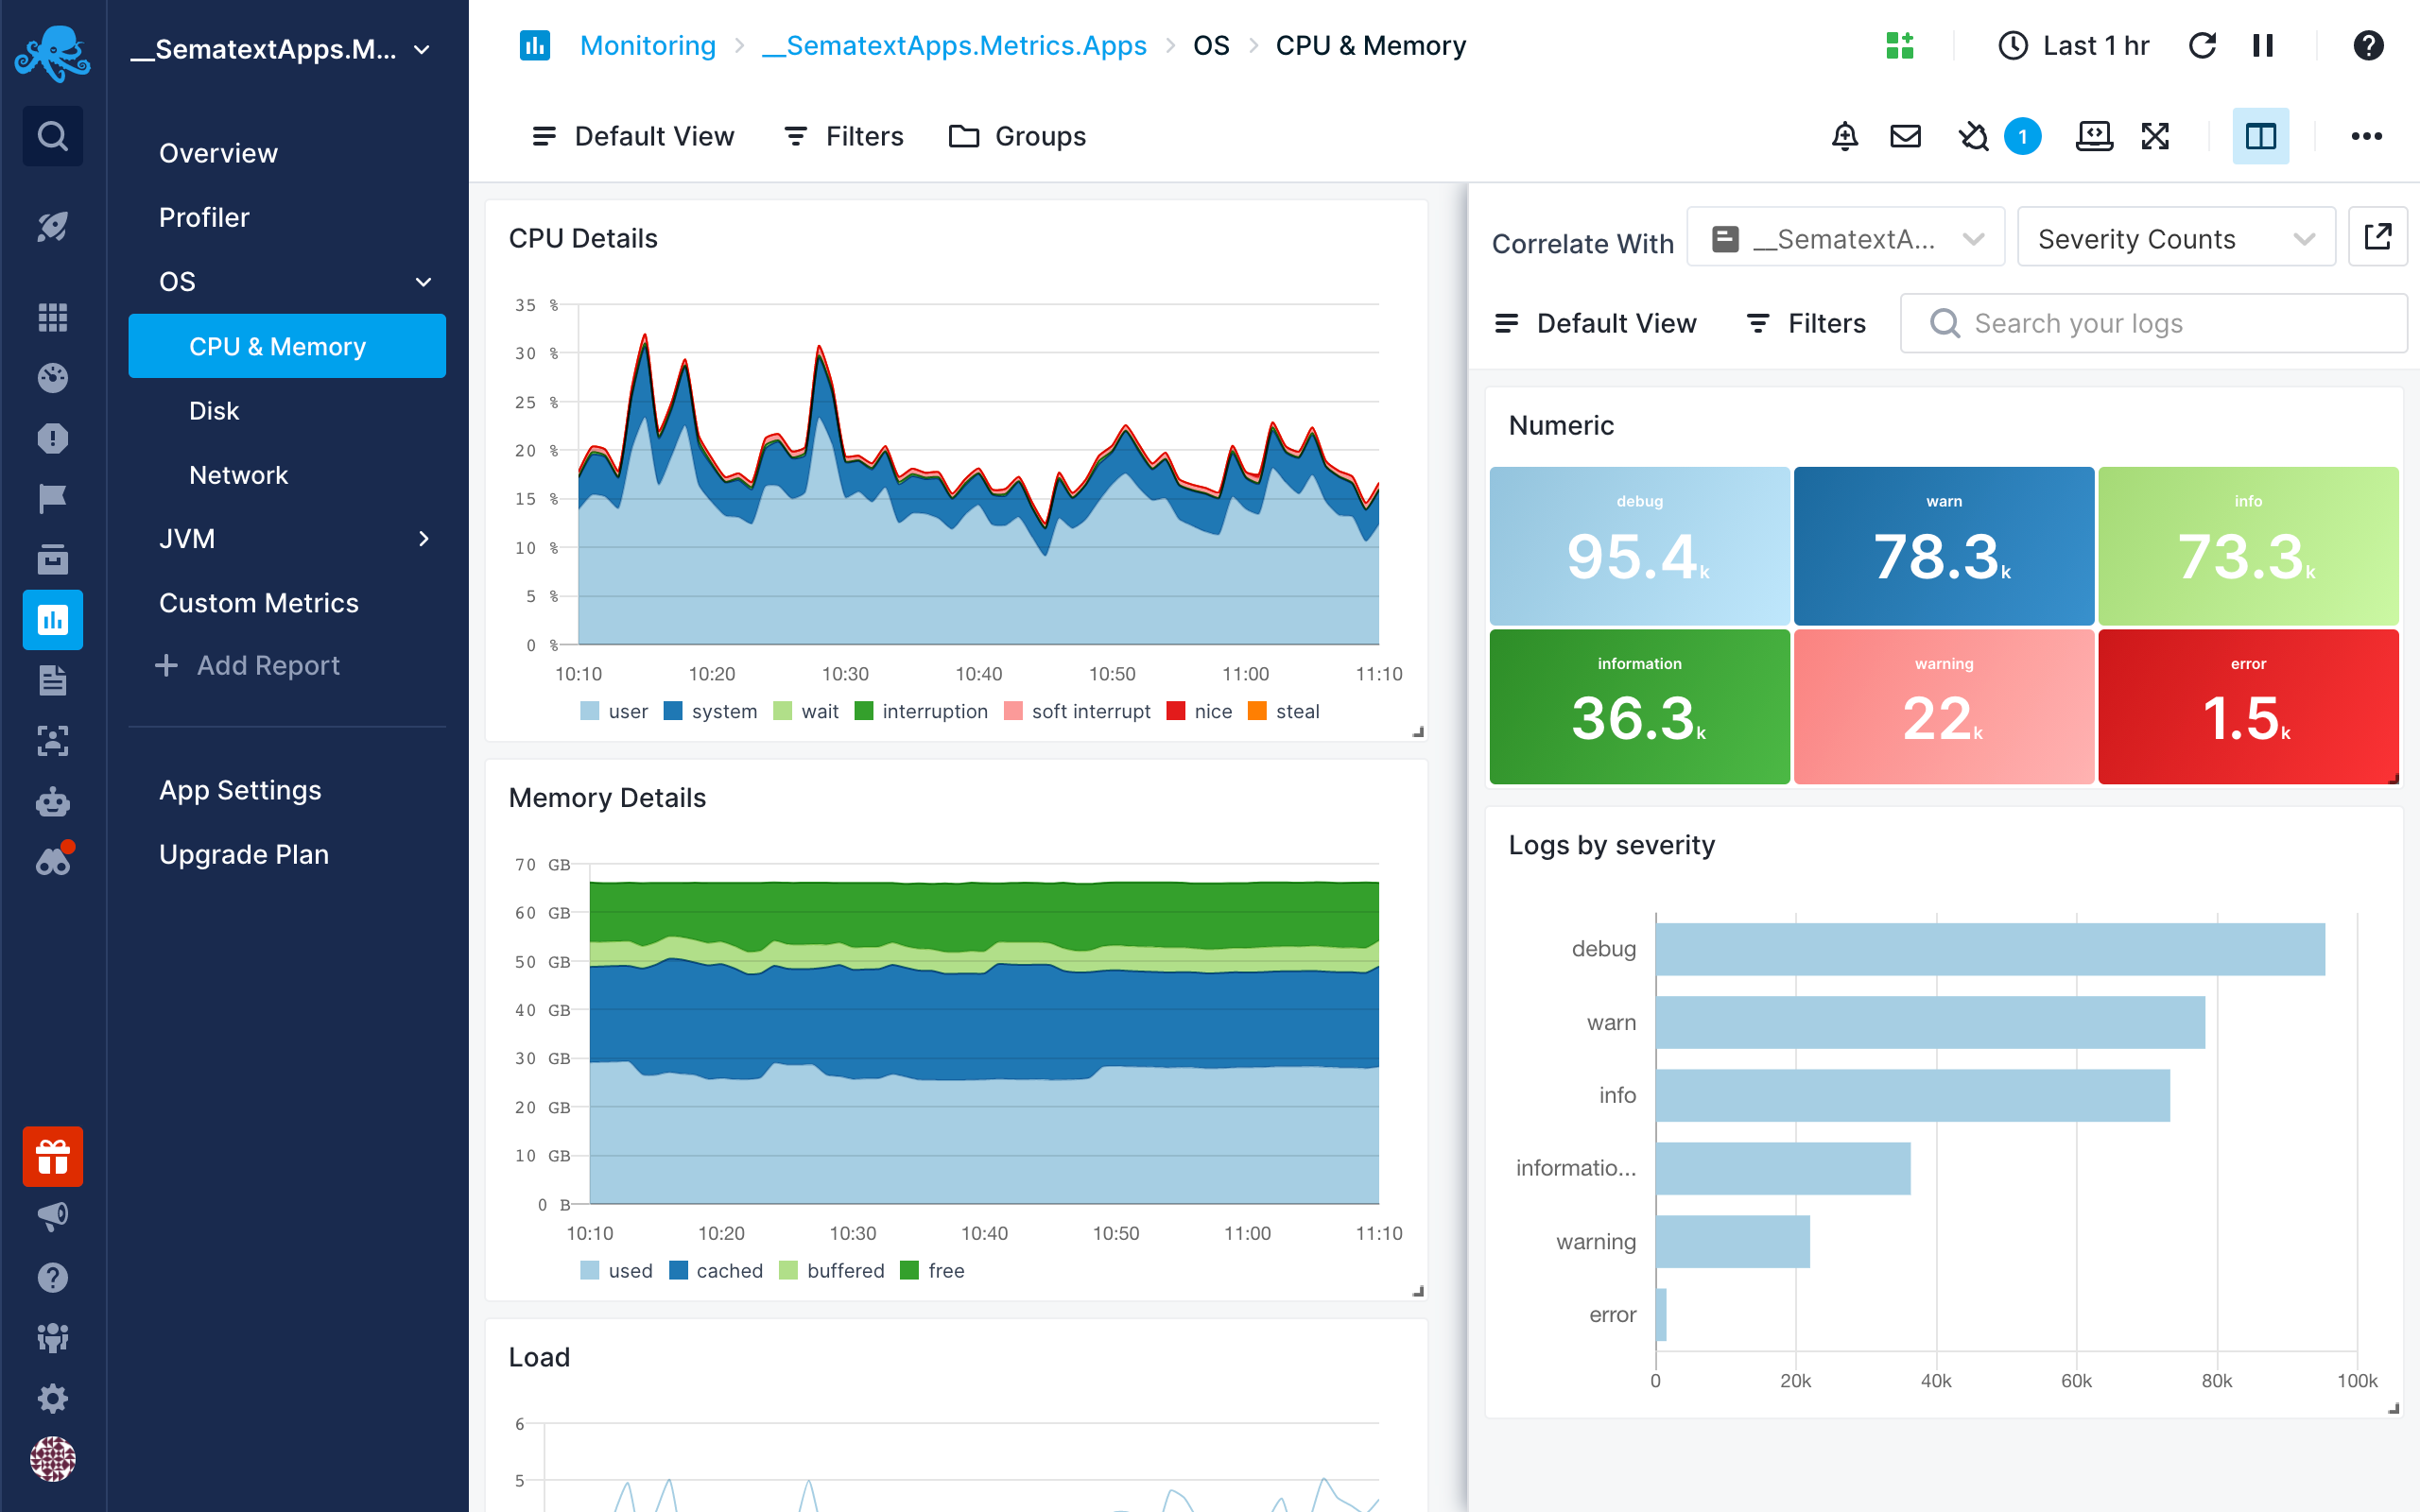
How to Correlate: Use the Split Screen
Performance metrics can be correlated with other observability data in Sematext and the best way to do that is by using the Split Screen feature. With Split Screen you can compare and correlate any Monitoring report with any Logs, Infrastructure or Experience reports. Correlation is also possible with Events or Synthetic Monitors. The Split Screen can be used to correlate even within the same Monitoring report but with different filters and groups in the left and right portion of the Split Screen.
Once you select a report you want to correlate with, it’ll be remembered so you can quickly toggle it.