Reports & Components
Monitoring Report Menu
The Monitoring Report Menu is where the true power of Sematext Performance and Infrastructure Monitoring lies. This is where Observability comes to life. It lets you add additional components to a report, create alerts, connect apps and quickly filter or group data. You can also correlate monitoring data with your logs, events or experience data using Split Screen.
Save as View
Filtering and grouping data is a central part of the Sematext Cloud user interface. With Saved Views you can save your filters and groups for faster access later. If you find yourself often applying the same filters on your data then this feature can be a time saver.
Grouping
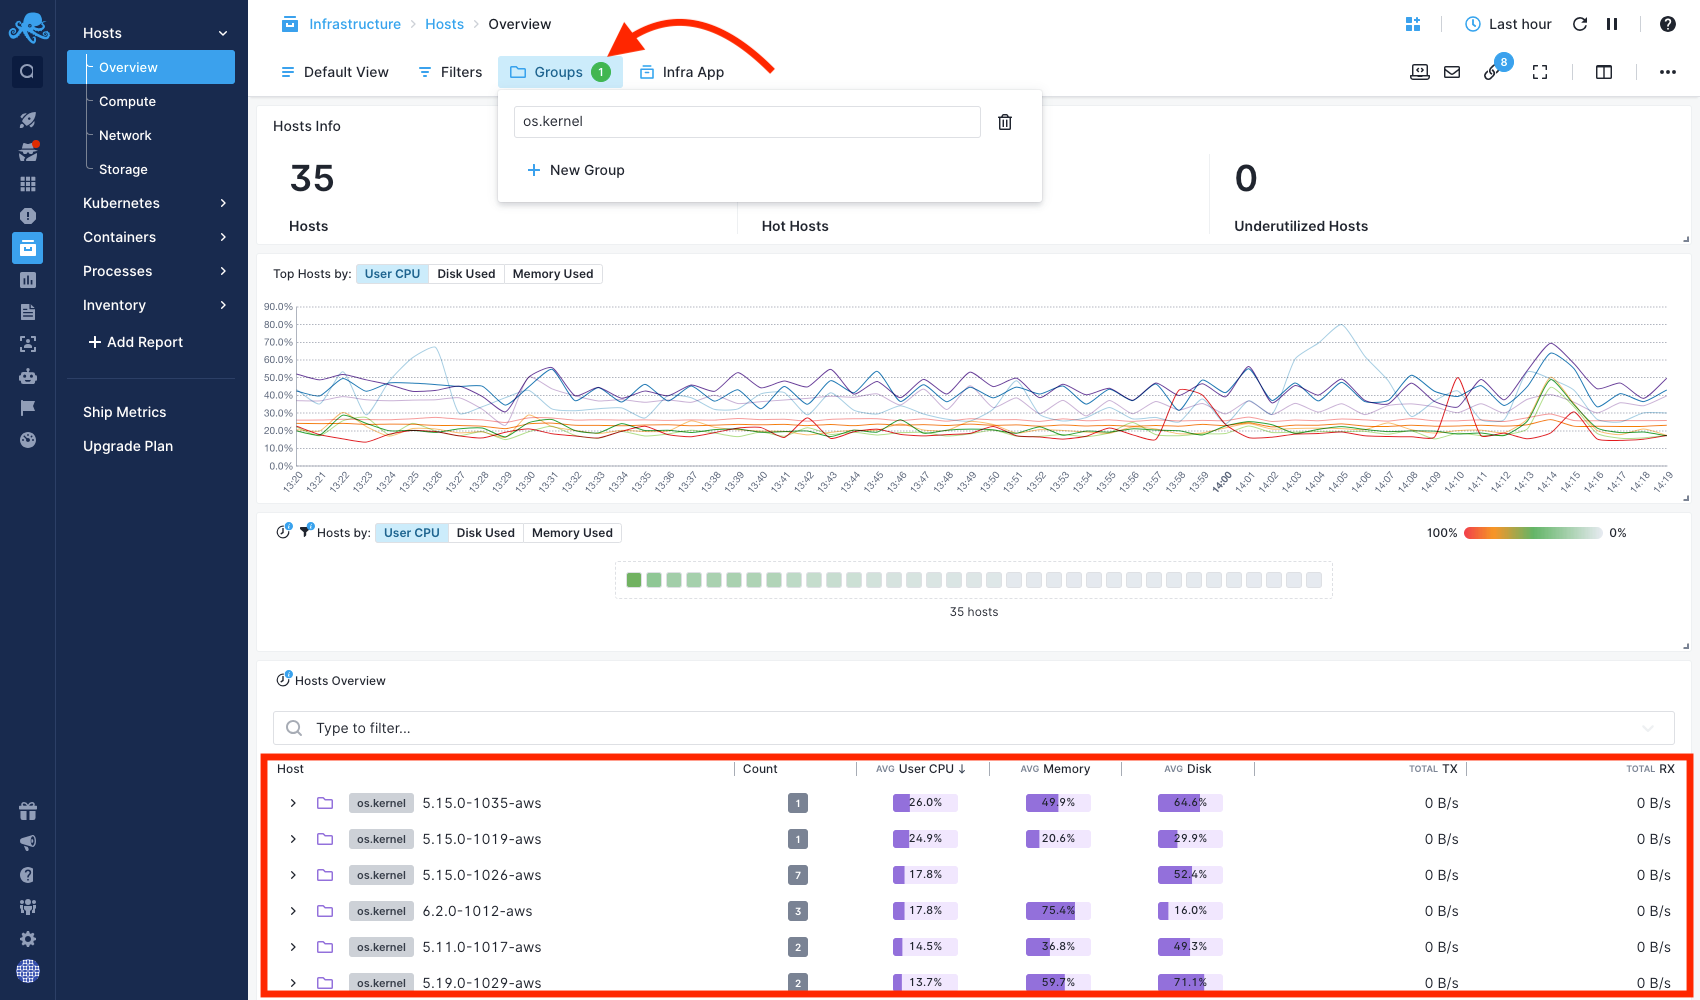
Data in report components can be grouped by tags using the Groups drop-down menu in the Monitoring Report Menu. For example, one of the available tags for grouping is the os.kernel tag, which will put hosts running the same Linux kernel in the same group. This can be useful to check whether some hosts need to be upgraded with a newer kernel.
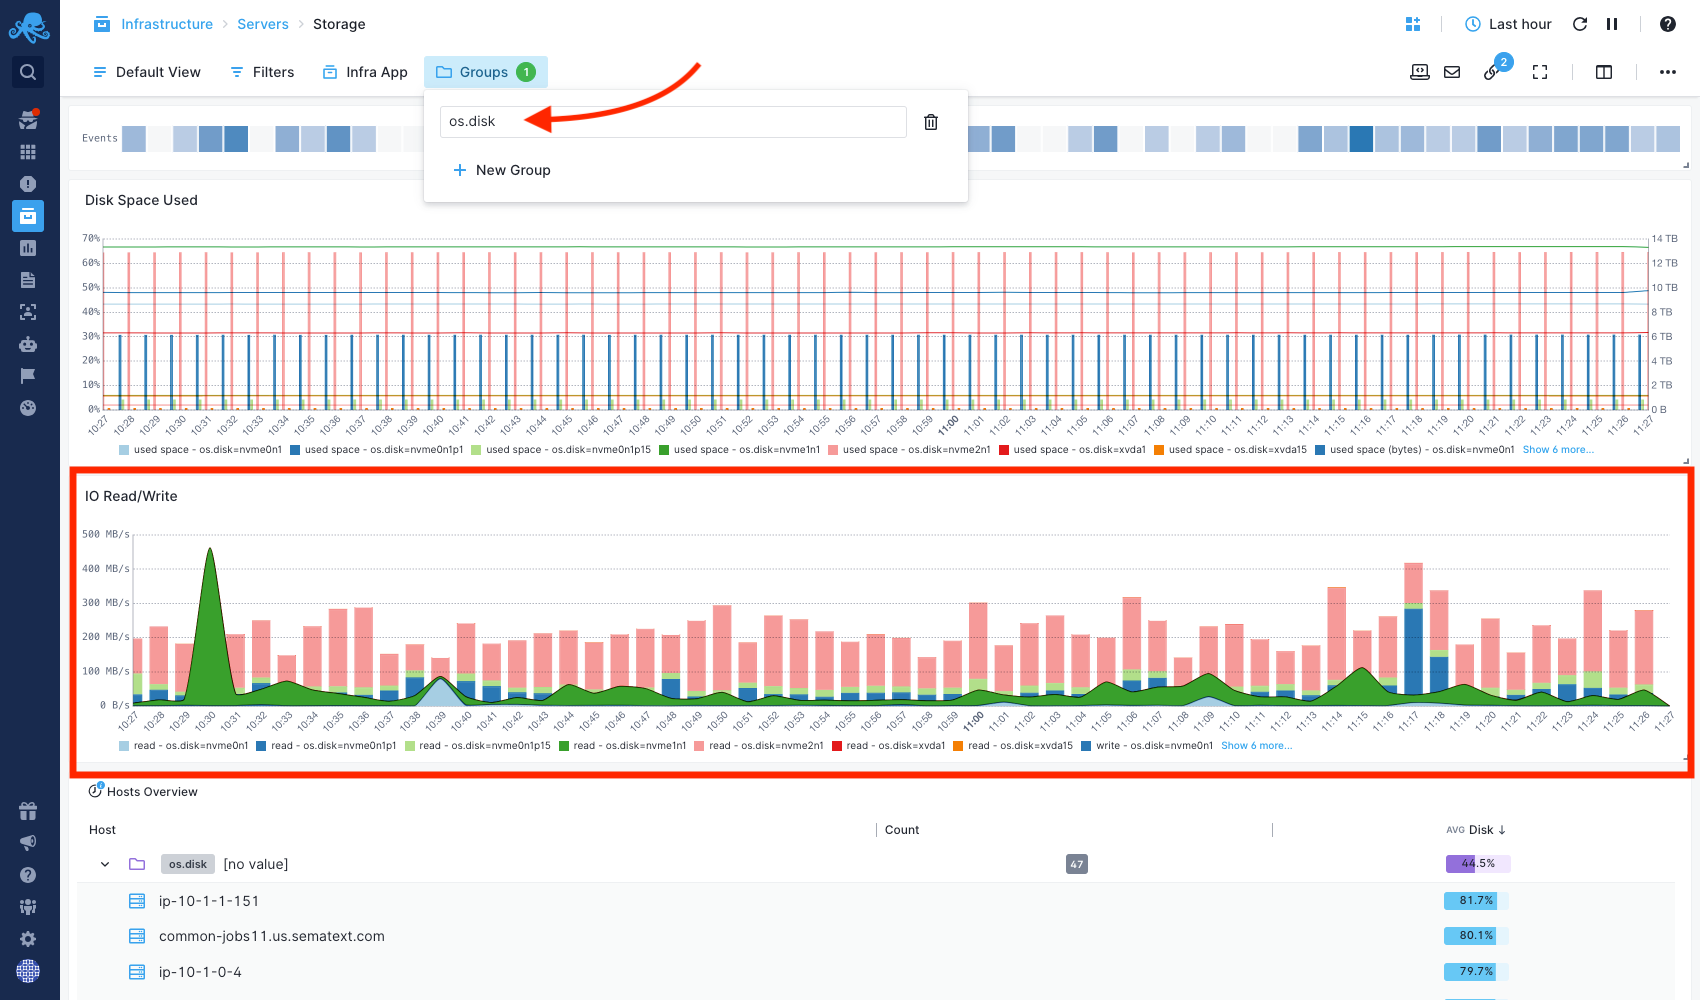
Another example is the grouping of the infrastructure storage charts by the os.disk tag, allowing us to quickly check for I/O spikes in specific disks.
Similar customized group menus can be created using Group By report variables.
Add Alert
Every query can be use as an alert query. The ability to save alerts is part of the essential tools for searching, correlating and investigating logs data. Each alert query is visible in the Alert Rules list.
Scheduled Reports
There are one time E-mail and Scheduled Reports available with time, frequency, and time range defined so your team can get automatated reports about your logs and system health. Learn more about Scheduled Reports.
Connected Apps
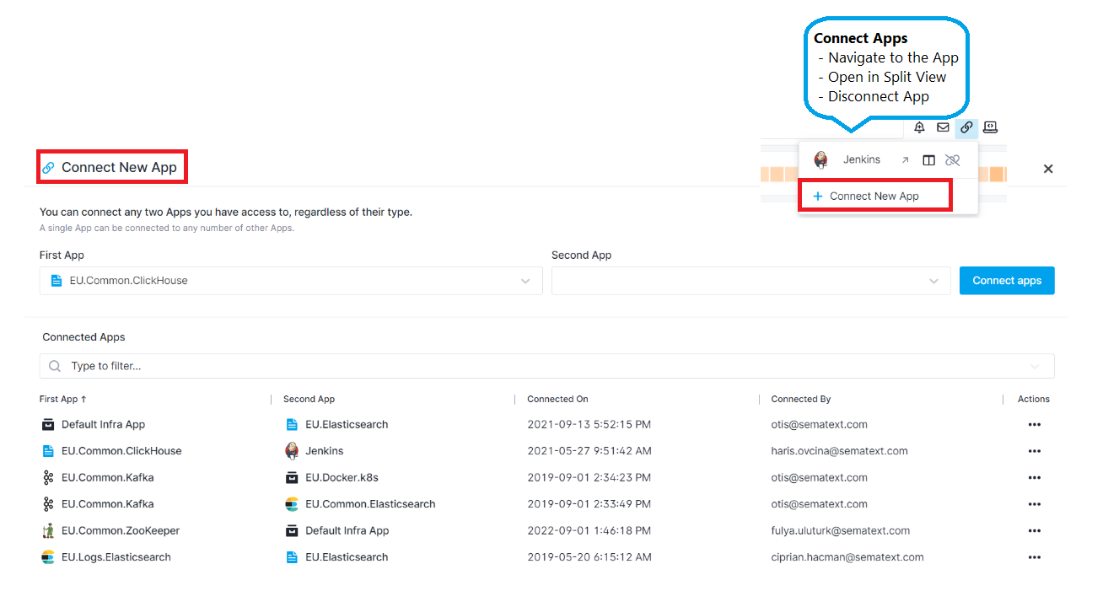
Connecting a Logs App to a Monitoring App will pre-select that Logs App when you decide to correlate metrics from the connected Monitoring App. When you receive an alert notification for an App, the alert notification will automatically include information and charts from connected Apps, and thus provide more information and context for you. You can connect any two Apps you have access to, regardless of their type. Any App can be connected to any number of other Apps.
Monitor Installation
You will need to install Sematext Agent so metrics are sent to your Monitoring App. Please refer to Integrations to configure what you wish to monitor.
By checking out the Integrations documentation you can learn more about how to monitor various programming languages, operating systems, containers (Docker, Kubernetes, Mesos), Cloud IaaS / PaaS services, iOS, Android, AWS EC2, AWS S3, Log Management, and log shippers. There you will find detailed information on how to install and configure different agents required to start sending your logs and metrics data to Sematext Cloud.
Full Screen Mode
Entering full screen mode brings only the component you choose into view. It's useful for presentations and viewing detailed info of a single component. All charts have zoom, crosshair, and time navigation tools with tooltips available for effective chart interaction and data analysis.
Time Picker
The Time Picker is available whenever an App is selected as well as when any custom dashboards are being used. One minute is the shortest time increment you can select. Thirty minutes, one and two hours, and one, two, seven, and thirty days time-span shortcuts are exposed as well. A custom time range can be selected using the time picker dropdown menu. The Logs App will automatically refresh upon selection and update all the reports accordingly.
Live Tail
Refresh data and Live Tail options are located next to the time picker. The Live Tail feature provides real-time insights as soon as your data is consumed and indexed. It can also be stopped so the auto-refresh does not update the data, in case you need to inspect specific incidents or anomalies within a certain time segment.
Split Screen
Split Screen gives you a single view for Metrics, Logs, and Events. This is a huge time saver to let you move from Metrics spikes to drill down to Logs and Events that caused them.
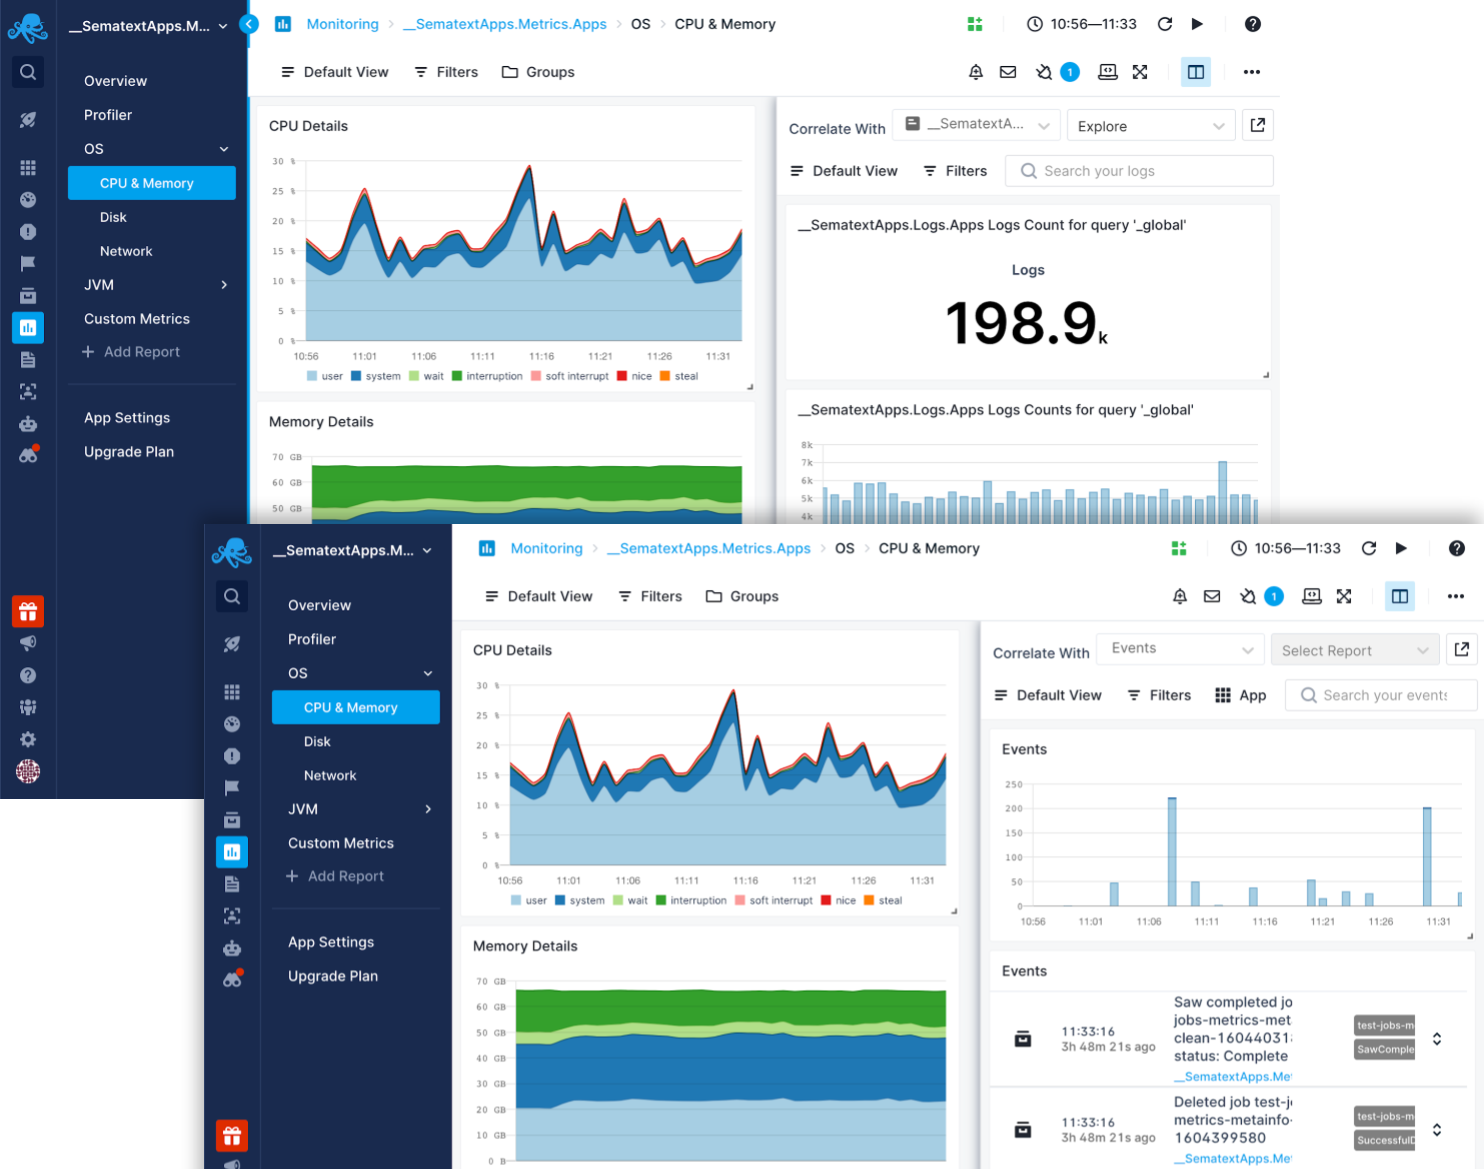
Combined with the Metric Reports, and with the help of a charting hairline, zoom and chart navigation tools, it is easy to see how using our Monitoring and Logging tools in a single page is a must-have for any DevOps team! Learn more about Split Screen.
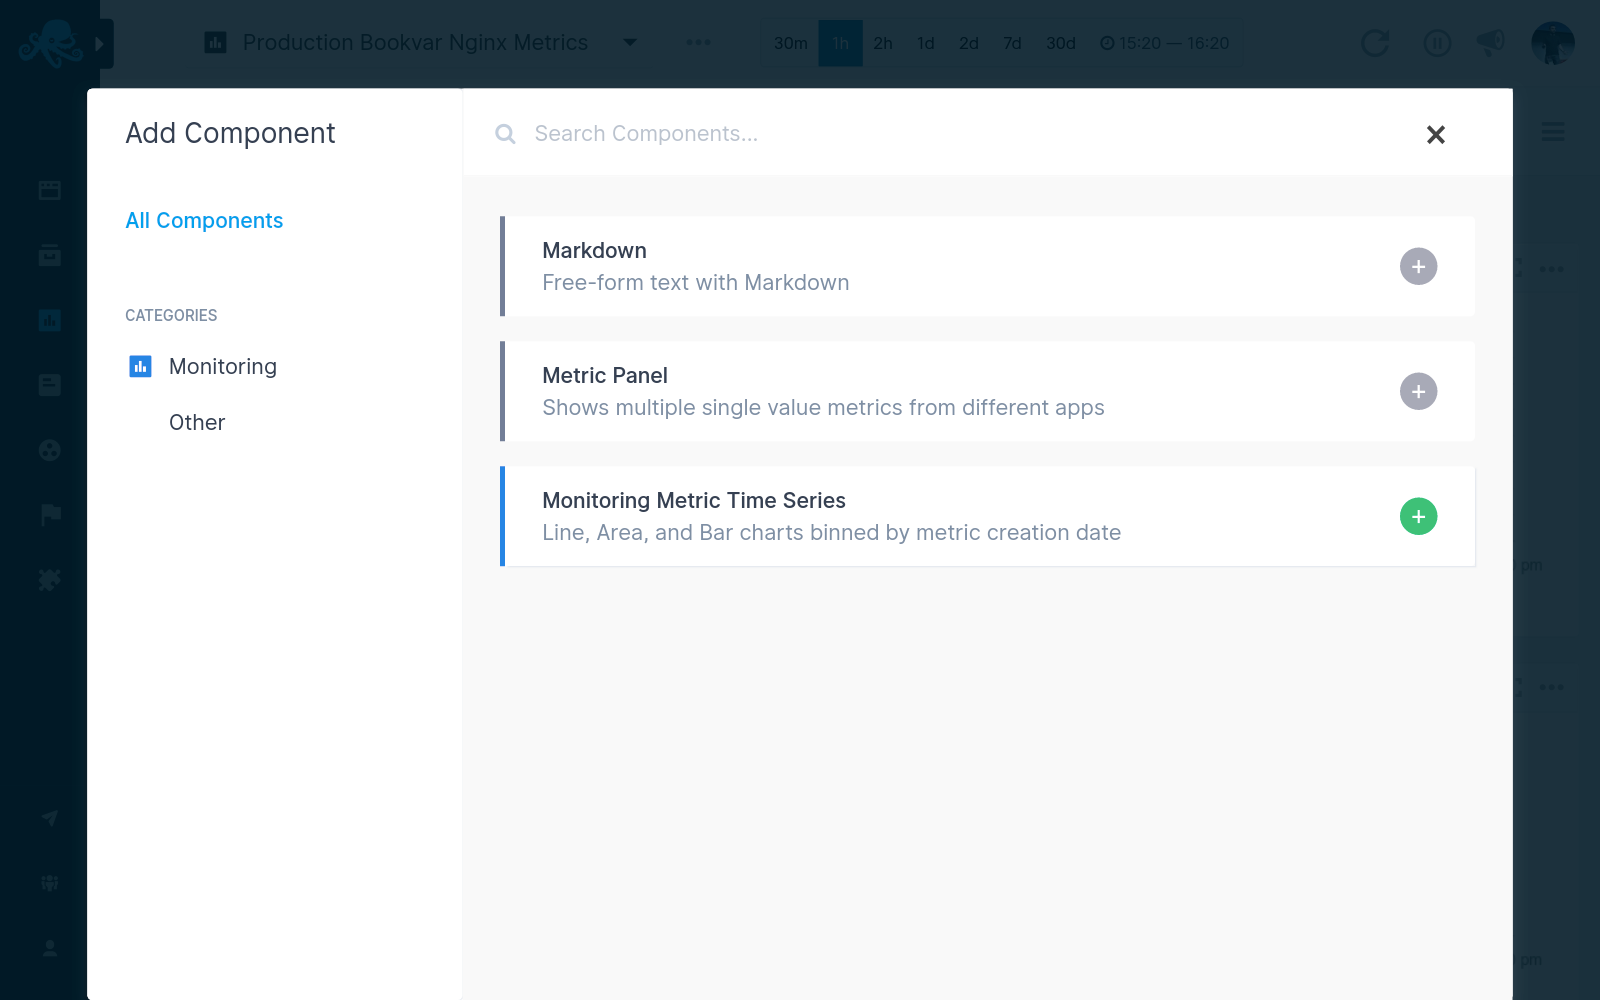
Components
Using custom components you can add monitoring metrics time series, metric panel, markdown notes, and create custom reports with rich data visualizations and chart tools to analyze your data.
Each component can also be added to a custom dashboard you define.
Monitoring Components
Line, Area, Bar charts binned by metric creation date, bar chart binned by event creation date, table of events in reverse chronological order are available for your Monitoring App.
Use them together with out-of-the-box metrics reports and visualizations, generated when your Monitoring App is created, and you will go from metric spikes to your apps’ and servers’ logs in seconds and get to the root cause in minutes.
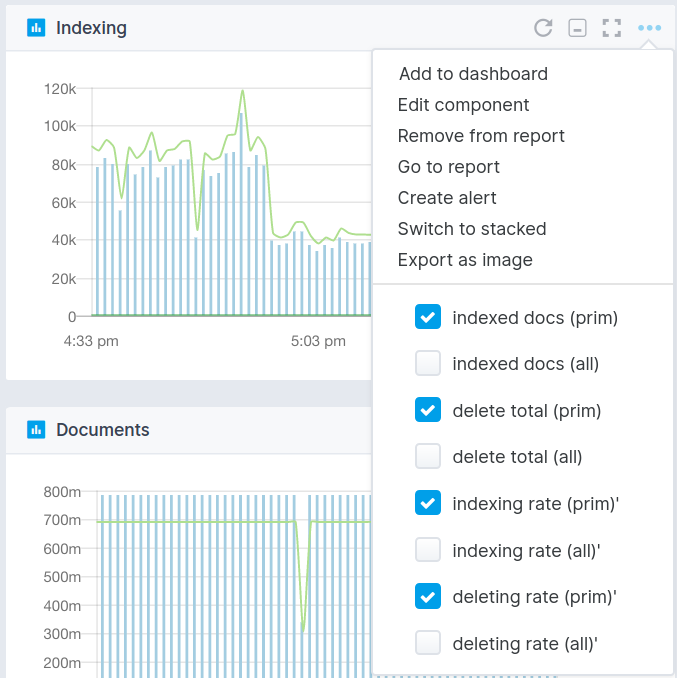
Monitoring Component Settings
Each Component can be added to a custom Dashboard, and you can organize reports from one or several applications, both Monitoring Apps as well as Logs Apps. Creating rich data and visualization reports based on various metrics and logs data has never been easier.
Here's an image of Metrics Component dropdown menu. You can edit the component metrics, add it to a custom Dashboard, create alerts, and much more.
App State
If a new component is added or any existing component is edited or removed, the Save and Reset buttons will appear in the report menu and allow for changes to be saved or reset to the initial state.
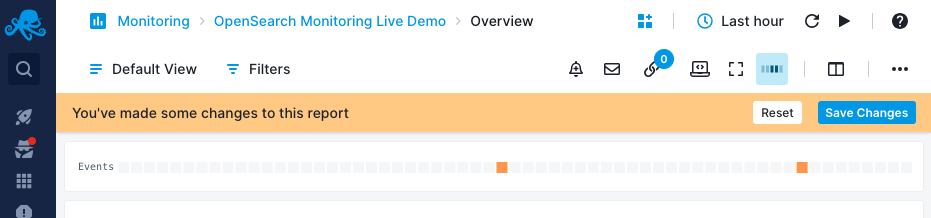
If your browser is suddenly closed, and no changes were saved or reset, the App will preserve its initial state.
Infrastructure Group
Each Monitoring App (except the Infra App) includes an Infrastructure group in the left navigation menu. This group provides detailed reports that offer insights into the environment of the metrics received within each App.
Currently, the Infrastructure group contains the following reports:
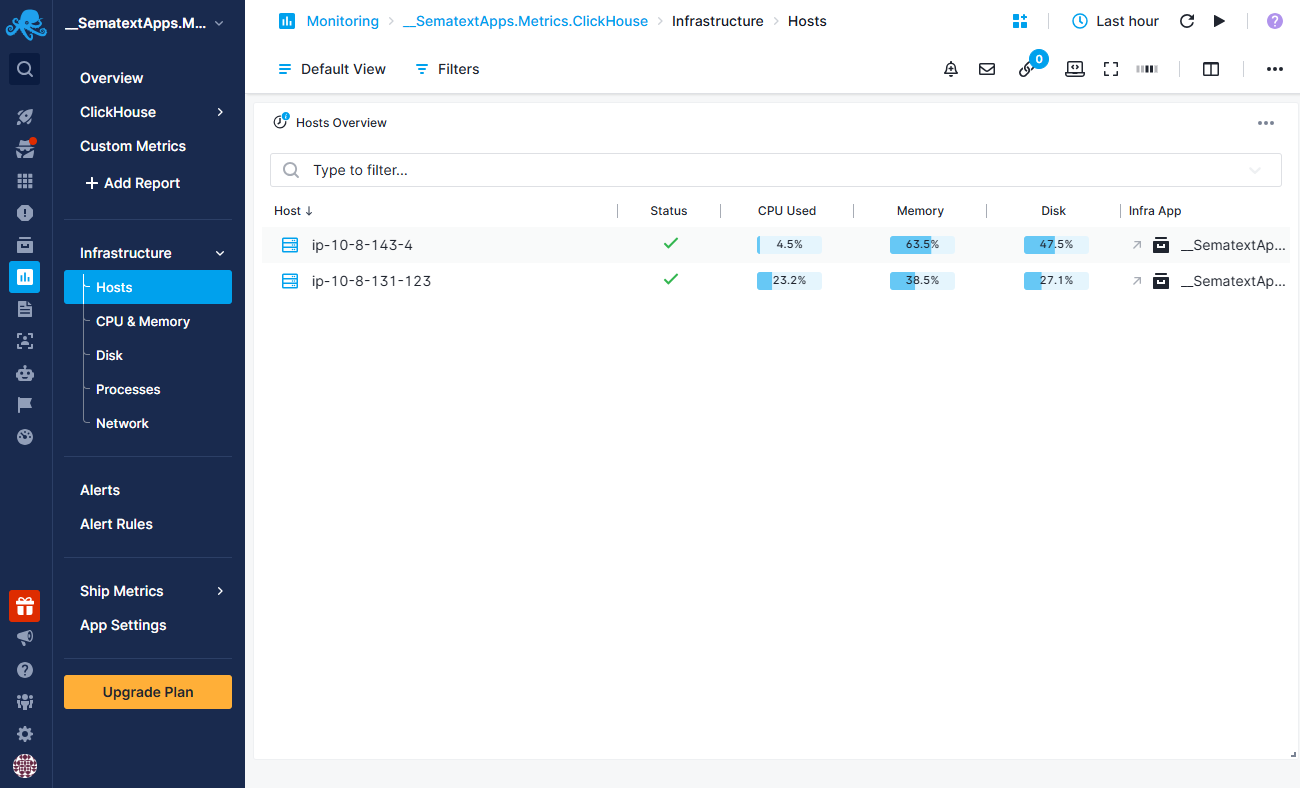
Hosts Report
The Hosts report displays a list of hosts sending metrics to the Monitoring App. Selecting a host opens a detailed flyout menu containing information such as:
- General Host Information: Basic details about the host.
- Performance Metrics: Key performance metrics, including CPU, memory and disk usage.
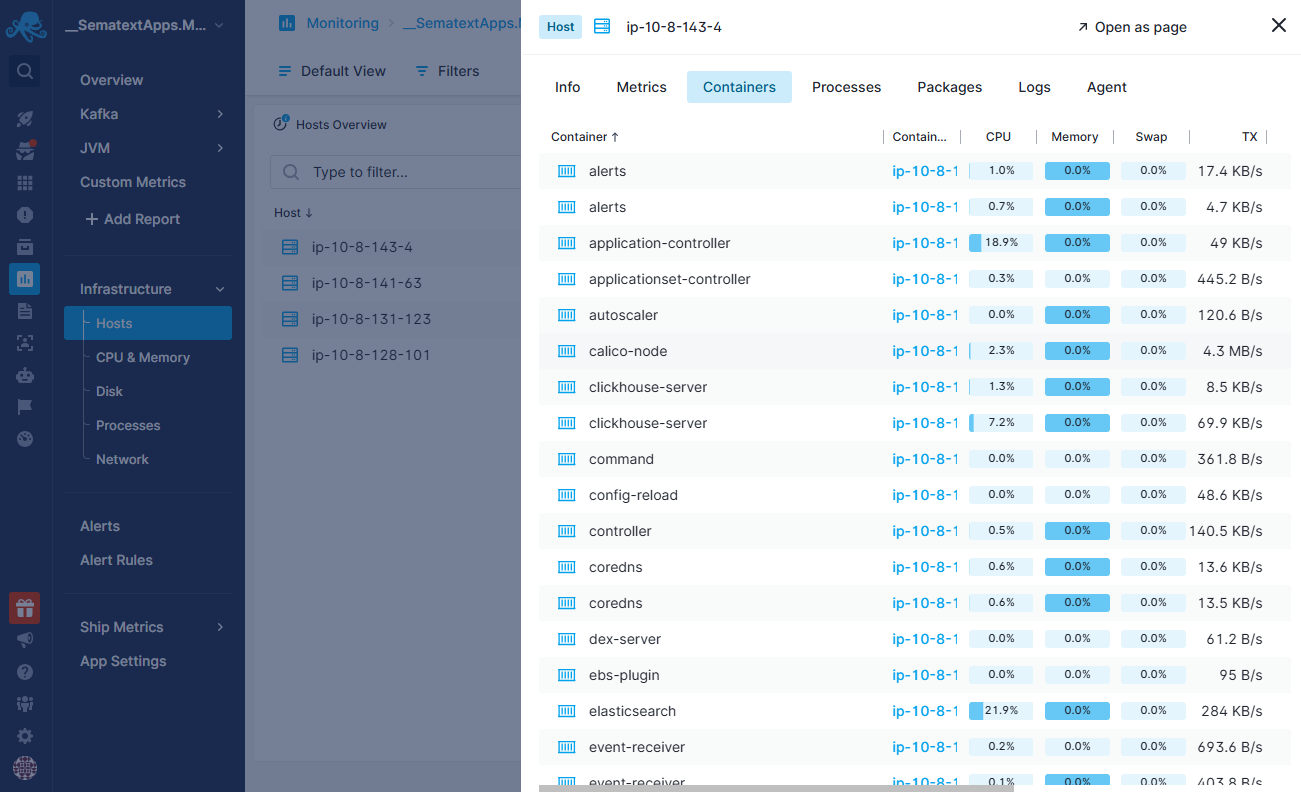
- Container Information: Details about containers running on the host.
- Running Processes: A list of processes currently active on the host.
- Software Packages: Information about available software packages on Linux-based hosts.
- Host System Logs: Access to system-wide logs of the host.
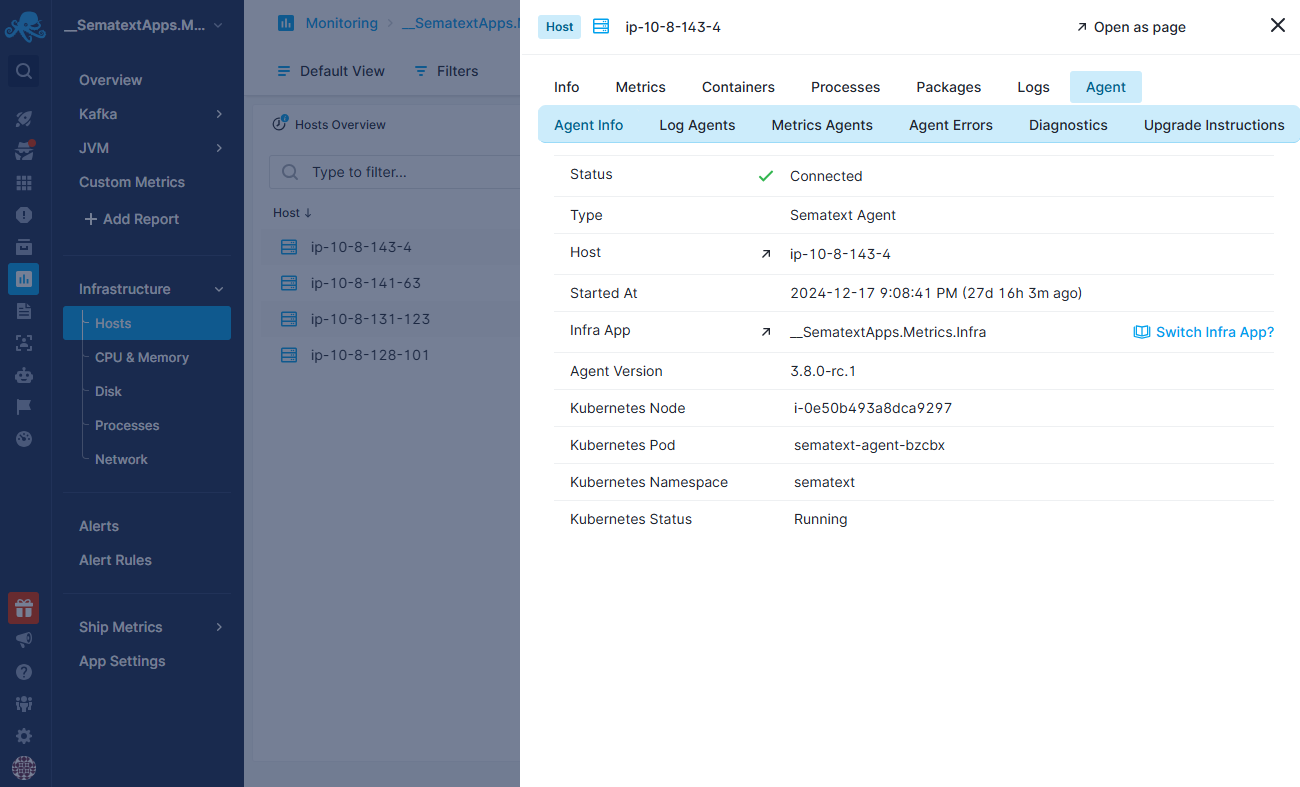
- Sematext Agent Details: Diagnostic information, including details about installed Sematext agents, errors and troubleshooting insights.
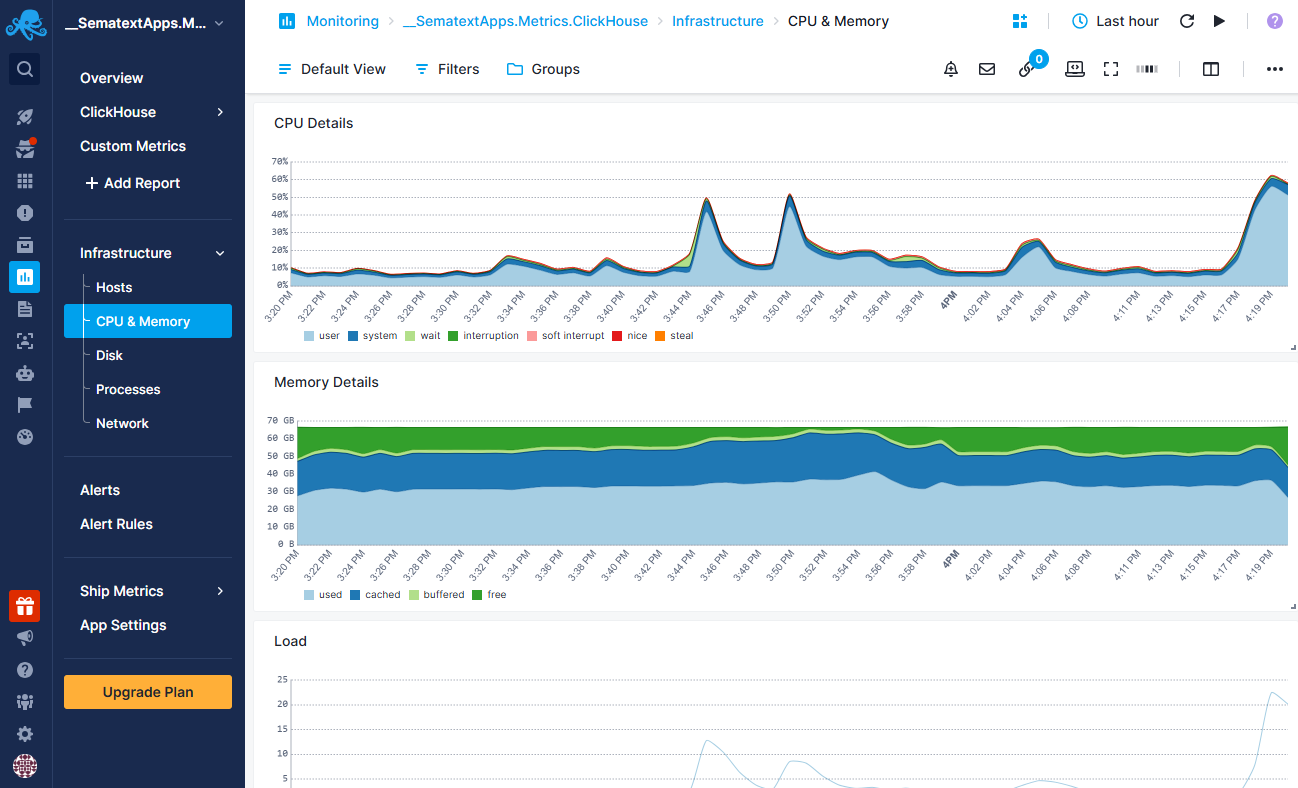
CPU and Memory Report
This report provides historical charts for key metrics such as CPU usage, memory usage, system load, and swap activity.
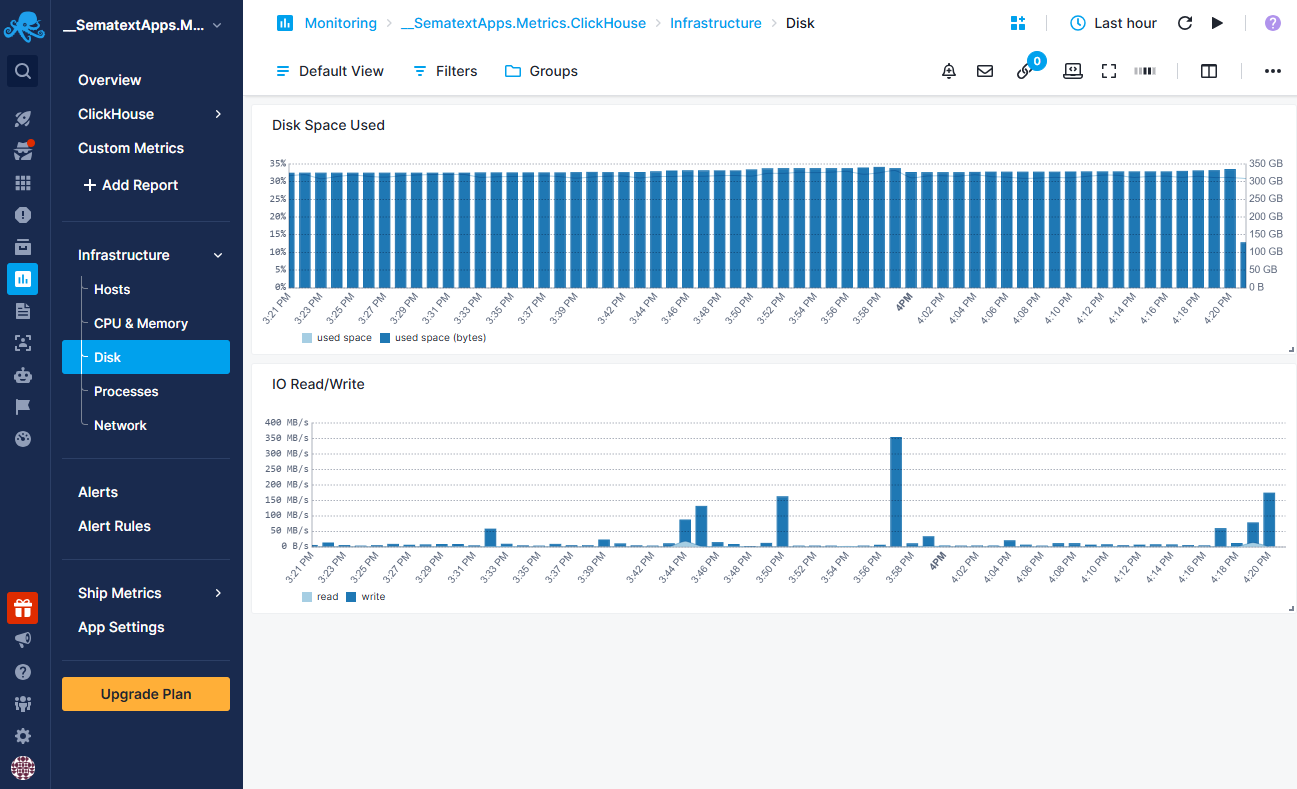
Disk Reports
The Disk report offer insights into disk space usage and I/O read/write operations over time.
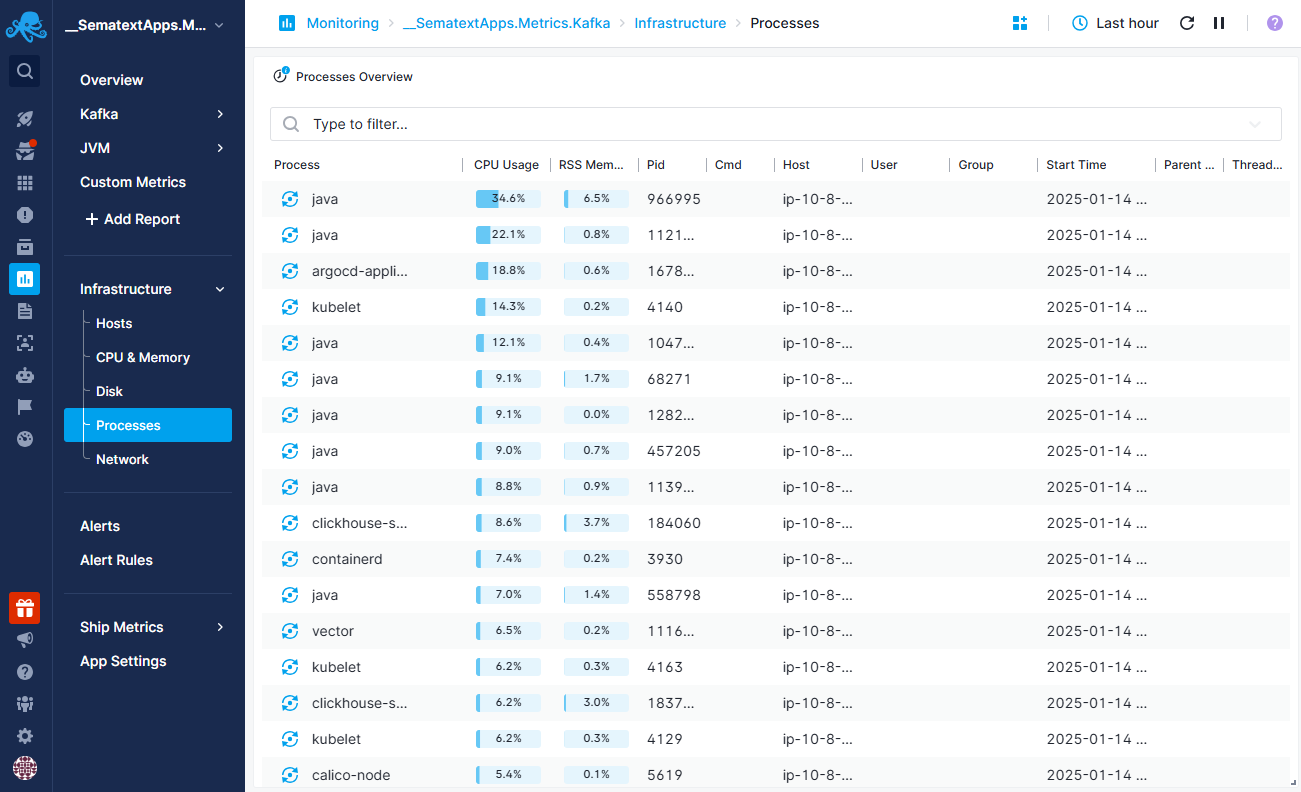
Processes Report
The Processes report provides an in-depth view of the most active processes running on a selected host. It includes:
- Process Information: Details such as process name, PID, PPID, host, user, and group.
- Performance Metrics: Insights into CPU and memory usage for each process.
- Command Line Arguments: The exact command-line arguments used to execute the process.
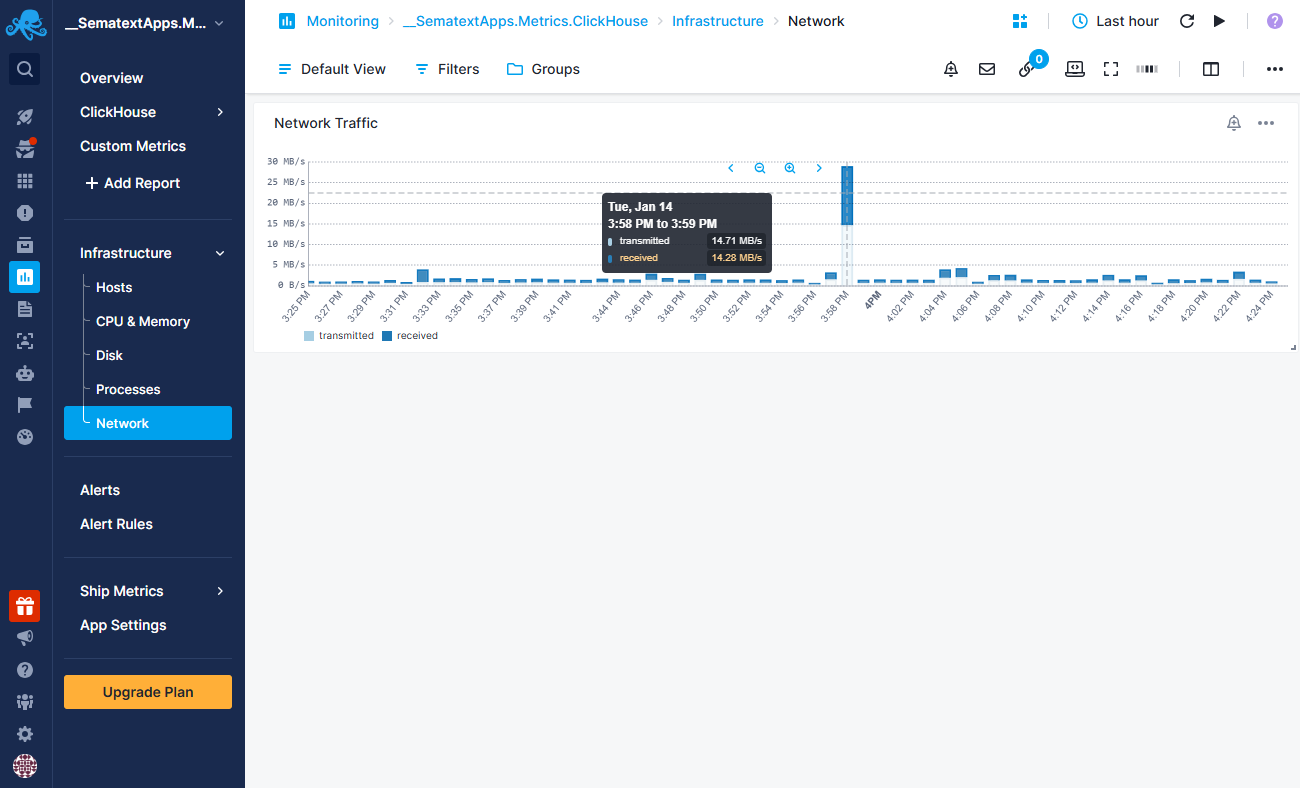
Network Report
The *Network report provides details about transmitted and received network traffic over time, offering insights into network performance.
Key Features of Infrastructure group
- Advanced Filtering: Both reports allow filtering using a wide range of tags, including process name, hostname, container name/ID, Kubernetes tags, and more.
- Easy Troubleshooting: Designed to help you quickly identify potential issues and gain a deeper understanding of the underlying infrastructure (hosts, agents, etc.) shipping logs and metrics to your App.