Servers
Monitor bare metal servers with a simple Agent and use Sematext Cloud to show everything in a single App.
Create a Sematext Infra App
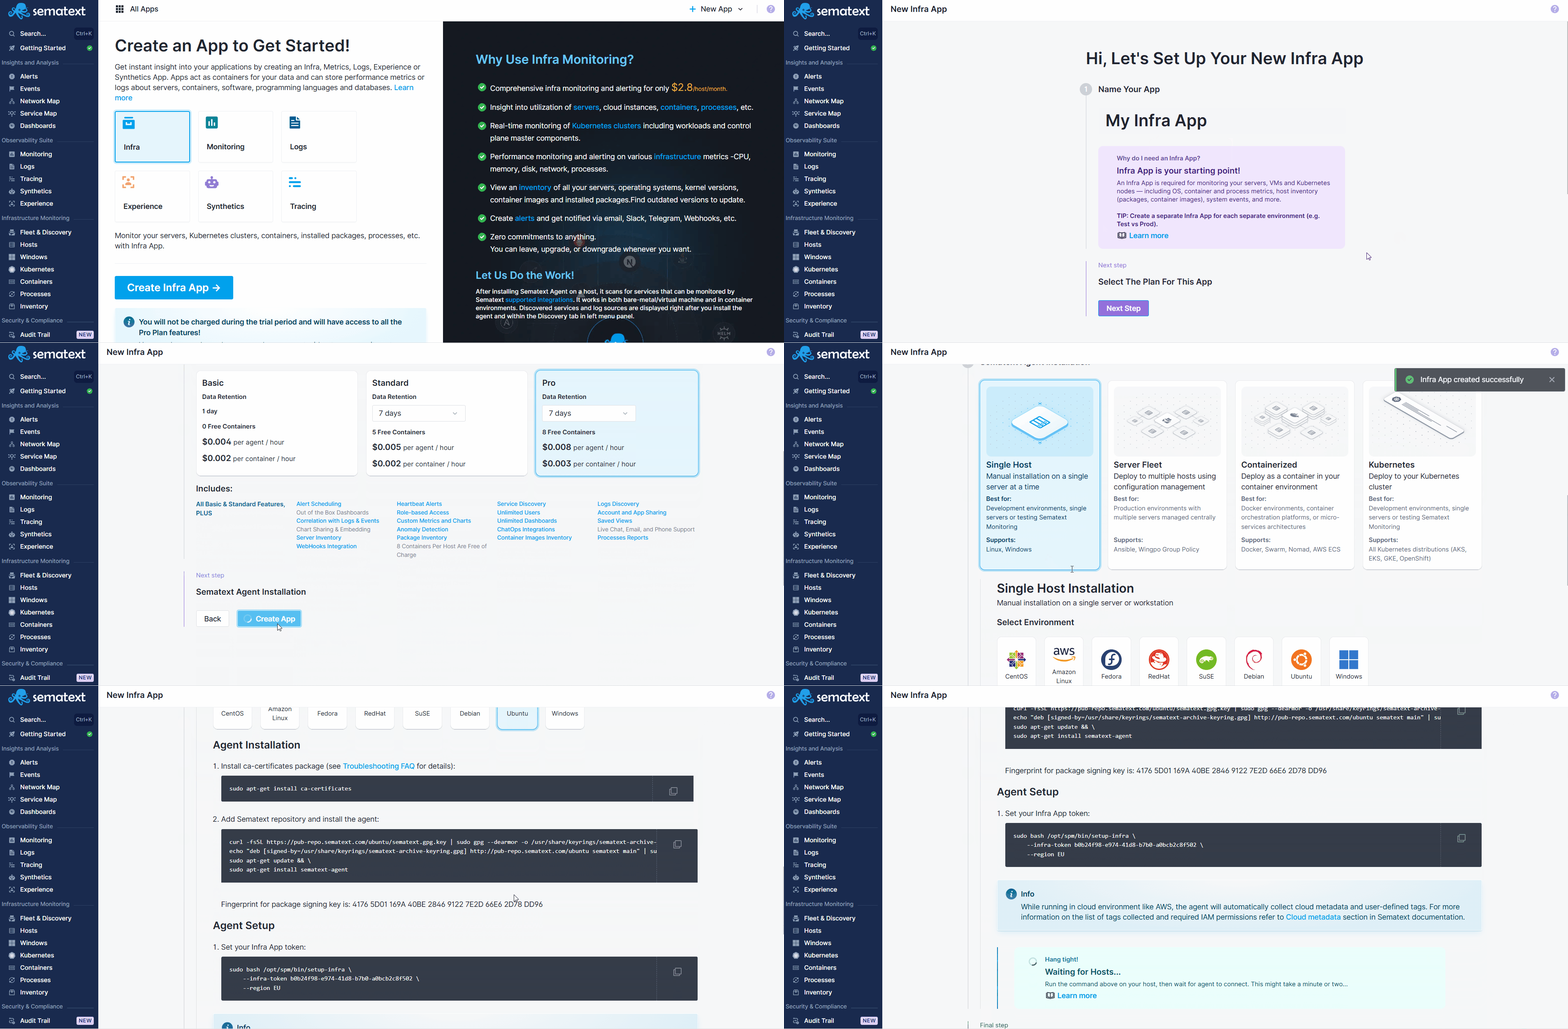
Go to the All Apps page by clicking the Octi icon in the top-left corner of the main navigation menu, or click any of the reports listed under the Infrastructure Monitoring section. From there, select Create App and choose Infrastructure Monitoring to create your Infra App. Give it a name, select plan and click 'Create App'.
Install the agent during the Infra App creation process by following the Bare-Metal / VM instructions.

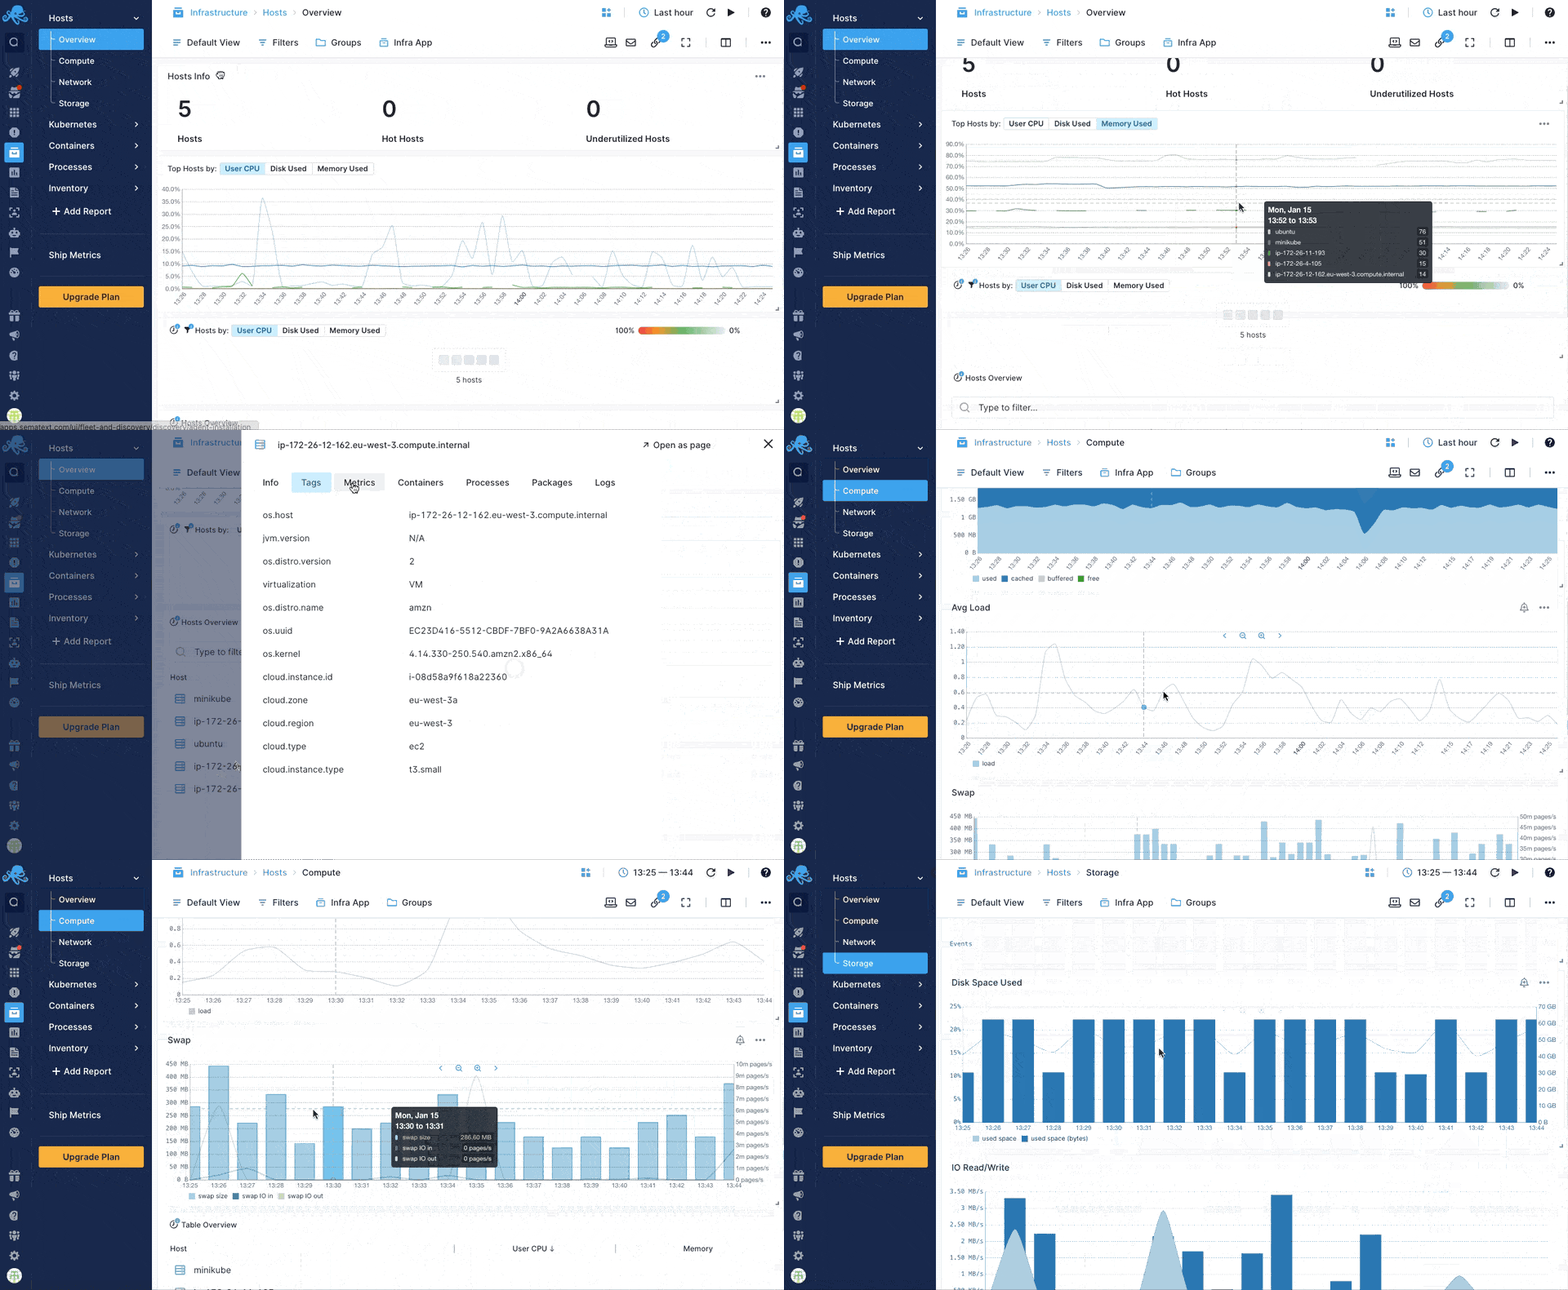
See host metrics in Sematext Monitoring
Sematext Agent collects a plethora of metrics about hosts (CPU, memory, disk, network, processes).

Metrics from both Linux and Windows servers can be collected. Learn more about Linux Monitoring and Windows Monitoring at Sematext.
Check also how you can monitor containerized and Kubernetes environments.
Core Infrastructure Alerting
As soon as you create an Infra App, Sematext automatically creates a set of default alert rules based on pre-defined conditions in important metrics. That way you get notified when there is no available disk space or memory is low, etc. Below you can see a list of default alert rules for server monitoring:
- High average CPU usage: Monitor the average CPU usage, to maintain system responsiveness and prevent the CPU being maxed out for too long without noticing it
- High and Critical CPU iowait time (Linux only): Identify high CPU I/O wait times for efficient I/O operations and to prevent latency
- High and Critical system CPU steal time (Linux only): High steal time can cause significant problems, including slow I/O, slower processing and slower database querying time
- High system load: Get insights into high system load levels to maintain resource availability
- Low and Critical system available memory: Detect low and critically low available system memory to prevent performance issues, crashes and out-of-memory failures
- High and Critical system used swap: Monitor high system swap usage to prevent excessive swap usage and system slowdown
- High and Critical disk space utilization: Receive notifications about high disk space utilization to prevent storage space issues and data loss
- High and Critical system process space utilization (Linux only): Monitor high process space utilization (PID limit) for efficient process management and system stability
You can create additional alerts on any metric.