Navigation Guide
The left navigation menu provides access to all primary product areas and features, organized into functional categories. It supports hierarchical navigation, where main menu items may contain sub-level menus when applicable. Both the main menu and sub-level menus are collapsible and expandable. Each level includes a pin control in the top-right corner that allows the menu to remain expanded or collapse automatically, enabling users to optimize screen space while maintaining quick access to frequently used sections.
Clicking the Sematext icon at the top of the left navigation menu navigates to the All Apps screen, which displays a list of all configured Infra, Monitoring, Logs, Tracing, Synthetics, and Experience Apps.
Search
The Search bar provides global querying across logs, monitoring, tracing, synthetics, experience, and infrastructure Apps. It supports fast navigation and direct access to an App without requiring manual traversal of the left navigation menu.
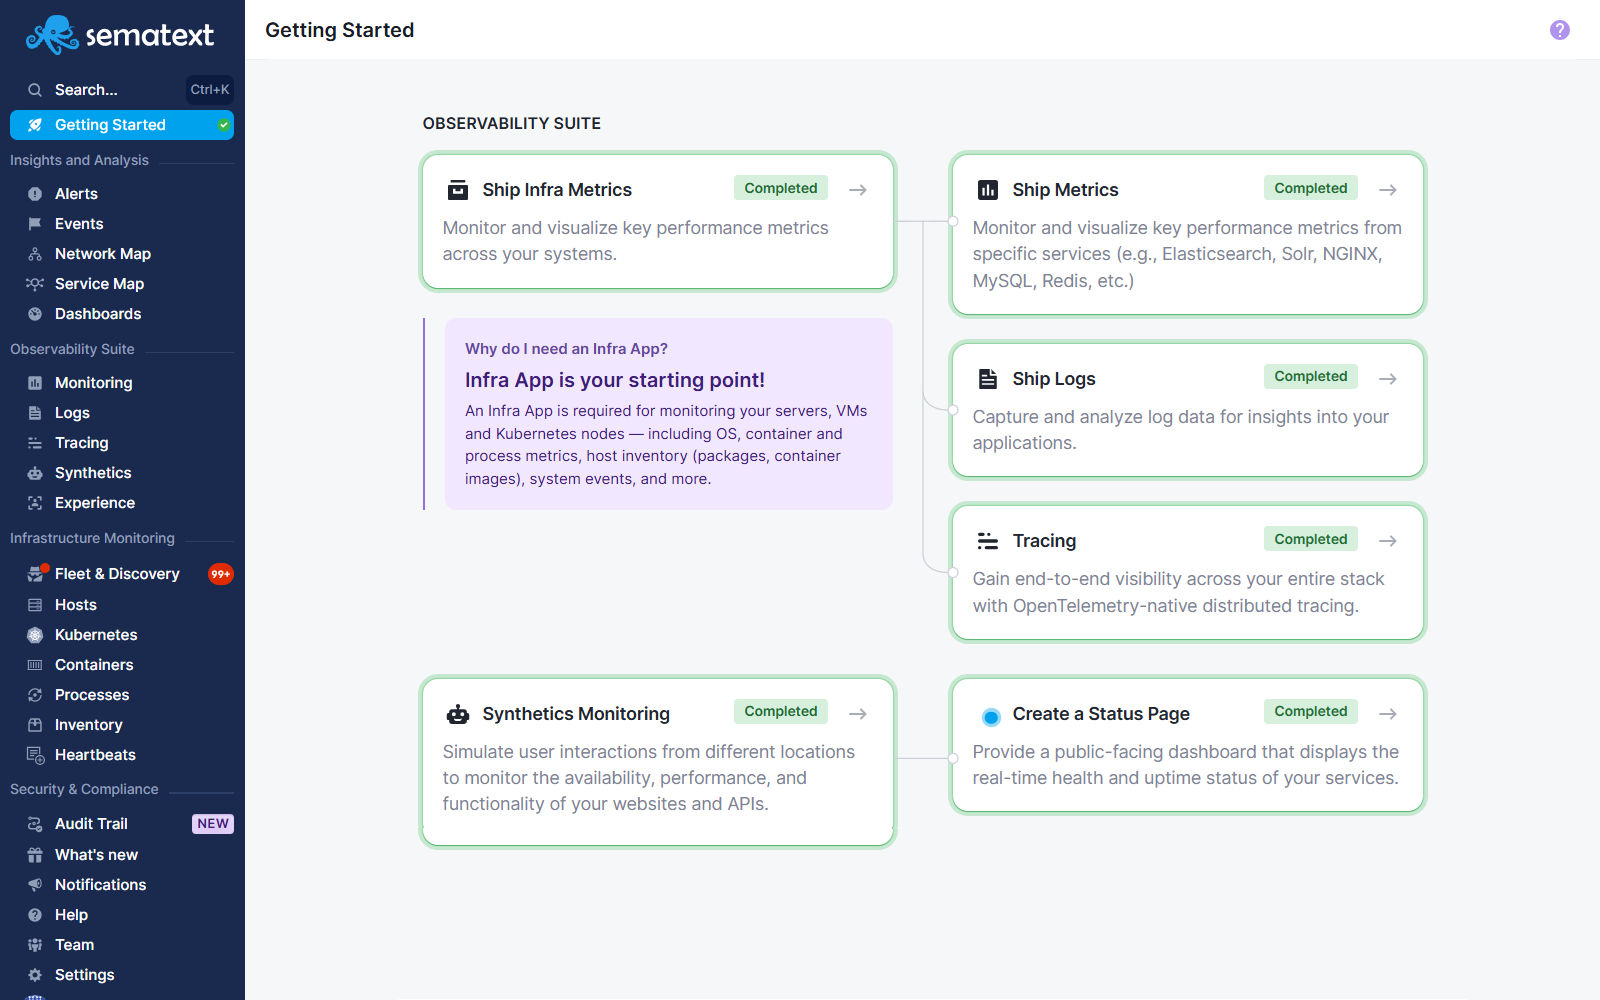
Getting Started
The Getting Started page includes items arranged in a logical chronological order to help users set up and begin using the observability suite. The content is divided into its own categories. Each card is clickable and navigates to the corresponding setup action. When a step is completed, a green check indicator is displayed to show that the step has been completed, allowing the user to proceed to the next step and begin benefiting from the full observability suite.
Insights and Analysis
This section contains tools used for analysis, correlation, and high-level visibility across systems and services.
Alerts
Alerts are rules that monitor metrics, traces, logs, real user experience, and synthetic checks for specific conditions and trigger notifications when those conditions are met. Alerts can be based on static thresholds, heartbeat checks that detect when data stops arriving, or statistical anomaly detection that identifies deviations from expected behavior. They operate across different data sources and can be configured with filters, grouping, and notification channels to notify the appropriate team or system when an issue occurs.
Events
Events are discrete, time-stamped, low-volume signals representing significant occurrences such as deployments, system restarts, alerts, agent status changes, or other operational changes. They are used to provide context and correlation with metrics, logs, and other observability data, and can be generated automatically by monitored systems and agents or added manually via the API or user interface. Events are searchable, filterable, and viewable on a timeline to support troubleshooting and analysis of how changes impact system behavior.
Network Map
Network Map provides an eBPF-powered real-time topology view of your infrastructure showing how services, pods, containers, and processes communicate with each other across hosts and Kubernetes clusters. It automatically discovers network connections without code changes, visualizes traffic flows and dependencies, and supports drill-down from high-level cluster views to individual processes. Network Map helps engineers understand service relationships, identify unexpected paths or missing connections, and analyze resource usage and communication patterns across the network.
Service Map
Service Map visualizes service dependencies and communication patterns derived from OpenTelemetry distributed traces. It automatically discovers services and their relationships from trace data, showing request rate, latency percentiles, and error rate for each service. Nodes are color-coded by health status, and edges indicate dependency health based on latency and error presence. Service Map helps engineers understand how services interact, identify performance bottlenecks, and investigate incidents by seeing which upstream and downstream services are affected. While Network Map shows infrastructure-level connectivity using eBPF, Service Map shows application-level service dependencies from trace data.
Dashboards
Dashboards are customizable visual interfaces that consolidate metrics, logs, and other observability data into charts, tables, and widgets. They allow users to arrange and configure data visualizations to monitor the health and performance of systems and applications. Dashboards support multiple data sources, flexible layout options, query-based visualizations.
Observability Suite
This category includes core observability capabilities covering metrics, logs, traces, and user experience and synthetics data.
Monitoring
Monitoring involves the collection and visualization of performance and health metrics from services that run in your infrastructure. It supports more than 40 integrations to automatically gather data at scale across servers, containers, services, and cloud resources. Monitoring is used to analyze trends, surface anomalies, correlate performance metrics and trigger alert rules based on metric conditions to detect issues and track system behavior over time.
Logs
Logs are ingested from infrastructure, applications, containers, and external sources, and can be parsed, filtered, and enriched to support troubleshooting, error diagnosis, and historical analysis. Logs provide fast search with rich query syntax, supports custom reports and alerting based on log conditions.
Tracing
Tracing is an OpenTelemetry-based distributed solution that captures detailed request flows across services in a distributed system. It provides end-to-end visibility into application performance, latency patterns, and error propagation, allowing engineers to analyze traces, understand bottlenecks, and troubleshoot distributed microservices.
Synthetics
Synthetics is active monitoring that executes scheduled checks against HTTP endpoints, websites, and scripted user journeys from multiple global locations. It is used to monitor uptime, performance, and correctness of APIs and web applications by simulating user traffic at configured intervals. Synthetics records performance data for each monitor run, enabling early detection of availability and response issues.
Experience
Experience refers to real user monitoring (RUM) that measures front-end performance and user experience metrics directly from web browser interactions. It collects performance data such as page load times, resource timing, and user session details from actual visitors, enabling analysis of frontend responsiveness and user satisfaction. Experience helps teams evaluate how real users perceive application performance and correlate frontend issues with backend telemetry.
Infrastructure Monitoring
Infrastructure Monitoring provides insights into the performance and state of your infrastructure components including servers, containers, Kubernetes clusters, processes, and inventory. It uses the Sematext Agent to collect metrics, events, and metadata from hosts and orchestrated environments, and presents them in structured reports within an Infra App for troubleshooting, capacity planning, and operational visibility.
All Infrastructure Monitoring features listed below are available after creating an Infra App, which serves as the primary entry point for getting started with the Sematext Cloud observability suite. The Infra App enables data collection, discovery, and visualization for hosts, containers, Kubernetes environments, and related infrastructure components.
Fleet and Discovery
Fleet and Discovery offers a centralized view of all deployed Sematext Agents and discovered services and log sources within your infrastructure. It lists hosts with installed agents, shows agent status and diagnostics, and displays discovered services and log sources to facilitate automatic or manual setup of monitoring and log shipping without additional configuration.
Hosts
Shows hosts where Sematext Agents are running and shows core operating system metrics such as CPU, memory, disk, and network usage. It enables detailed inspection of host-level health, performance trends, and agent status for root cause analysis.
Kubernetes
Kubernetes view focuses on observability of Kubernetes clusters by collecting metrics and state data for cluster components, nodes, pods, and workloads. It provides cluster-level metrics, health indicators, and performance insights that help troubleshoot container orchestration issues.
Containers
Containers show metrics and metadata for containerized workloads across your infrastructure. It collects data on container resource usage and lifecycle, enabling tracking of container performance and behavior across container runtimes such as Docker, containerd and orchestrators.
Processes
Processes lists running processes on monitored hosts along with resource consumption metrics like CPU and memory. It supports filtering and analysis of processes to identify performance bottlenecks and anomalous resource usage.
Inventory
Inventory presents machine-related information such as host attributes, installed software packages, and container image metadata. It enables comparison of host configurations and inventory items across infrastructure, supporting troubleshooting and consistency verification.
Heartbeats
Heartbeats tracks the arrival of expected data signals from monitored hosts, services, or data sources and detects missing data when a heartbeat is not received within a configured period. Heartbeat signals are commonly used to trigger alerts when a monitored entity stops reporting.
Security and Compliance
Audit Trail
Audit Trail records user actions and configuration changes performed within Sematext Cloud. It provides a chronological log of activities such as creating, updating, or deleting apps, alerts, dashboards, and account settings. Audit Trail is used for operational auditing, security review, and compliance purposes by enabling traceability of changes and accountability across users and teams.
Product and Account Management
Notifications
Notifications displays system and account-related messages including administrative notices.
Help
Help provides access to documentation and support resources.
Team
Team is used to manage users, roles, and access permissions within your Sematext Cloud account.
Settings
Settings contain configuration options for integrations, account preferences, and organizational setup.
The account identifier shown at the bottom of the navigation indicates the currently active user context.