Correlate using os.host
When you're troubleshooting infrastructure or a service, say because of poor performance, poor availability, or something along those lines, being able to move between metrics and logs is key to understanding what's going on by looking from both angles. Doing so seamlessly is what allows an observability solution to actually save you time and nerves when you are in the middle of chasing an issue in production. In Sematext, this is where cross-connection via os.host comes into play. In this article, we’ll show you how to use os.host to navigate between metrics and logs in Sematext, how to explore host-level data, and how the Infrastructure Group view ties everything together.
What is os.host?
In Sematext, os.host is a common tag that is part of a common schema. It is used across multiple Sematext monitoring solutions to connect metrics and logs coming from the same host. It appears automatically in both Monitoring and Logs Apps when you’re shipping data from a host using Sematext Agent. This makes it easy to switch from viewing metrics to viewing logs (or vice versa) for the same machine.
Why is this useful?
Let’s say you’re using Sematext Monitoring to collect metrics from your system or service, such as CPU, memory usage, disk I/O, and more. You notice a spike in memory usage on a particular host. Of course, you could also be looking at some service-specific metrics spiking. For example, via an anomaly detection alert you might get notified about a sudden change in the number of MySQL connections. Instead of guessing what might have caused it, you can click on that host's name to check logs from the same machine, around the same time the spike happened. This gives you context that metrics alone can’t offer. Depending on which logs you are shipping to Sematext from that host, you might want to look at host-level logs, or logs specific to some service running on that host.
For more detailed information on memory leaks, debugging techniques, and OOM killer errors, check out related articles on the Sematext Blog.
A typical use case:
- You're monitoring OpenSearch metrics from multiple clusters and notice a CPU spike around 6:17 AM.
- To identify the source, you group the report by
os.hostto pinpoint the host responsible for the spike. - Next, you navigate to Infrastructure Group reports and click on the host. This opens a detailed view showing logs from that host for the exact time frame of the spike, along with related metrics and system details.
- To investigate further, you filter the logs by severity (
warningorerror) to check for any unusual activity leading up to the spike. - You notice repeated slow query logs from that host appearing around the same time, suggesting that a resource-heavy query may have caused the CPU spike.
- To fully resolve the issue, you might look into which service or application is generating that query and consider adjusting the code or optimizing the query to reduce resource usage and prevent similar spikes in the future.
Another common scenario, going from logs to metrics:
- You receive an anomaly alert signaling an unexpected surge in the number of warning and error logs coming from the OpenSearch cluster.
- To investigate, you open the Logs App that is receiving logs from that cluster.
- There, you observe a flood of warning and error messages related to disk pressure occurring within a short time window for a data node around the time you’ve received the alert.
- Next, you open the OpenSearch Monitoring App in Split Screen to view metrics specific to that data node and logs side by side without switching context.
- You notice that the disk usage on the data node increased rapidly during that time and is nearing full capacity.
- If the issue continues, the system is at risk of running out of disk space entirely.
- This correlation suggests that the spike in warning and error logs is contributing to excessive disk usage, potentially affecting the stability and performance of the cluster.
What You Need in Sematext Cloud to Catch These Issues
To spot and investigate issues like the ones described above, you need both a Logs App and an Infra Monitoring App that collect logs and metrics from the same host.
The Infra App uses the Sematext Agent to collect system metrics, events, process info, and package details. It works on bare-metal servers, virtual machines, Kubernetes clusters (both managed and self-managed) and containers.
The Sematext Agent is also the recommended way to ship logs to your Logs App. It automatically includes os.host, which allows you to connect logs with metrics from the same machine.
While you can use custom integrations to ship logs from other sources, you'll need to make sure your logs include the os.host field if you want to link them with metrics.
Tip: The Sematext Agent can also detect services and log sources running on your hosts. With this discovery feature, you can easily set up log and metric collection for supported services. These come with prebuilt dashboards and alert rules specific to each service.
In the examples above, we moved between infrastructure metrics and logs. But that’s not the only path. Sematext also supports service-level monitoring, collecting metrics and logs for services like OpenSearch, Solr, Elasticsearch, Apache, Nginx, PostgreSQL, Redis, Kafka, and many others.
When you monitor both metrics and logs for a service, Sematext provides service-specific dashboards and alerts out of the box. All you need to do is ship the data, no extra setup is required.
Just like with infrastructure metrics, you can use features like anomaly detection, Split Screen, and Connected Apps to investigate service-level issues. This lets you correlate metrics and logs from the same host or service and get to the root of the problem faster.
Digging Deeper with Infrastructure Groups
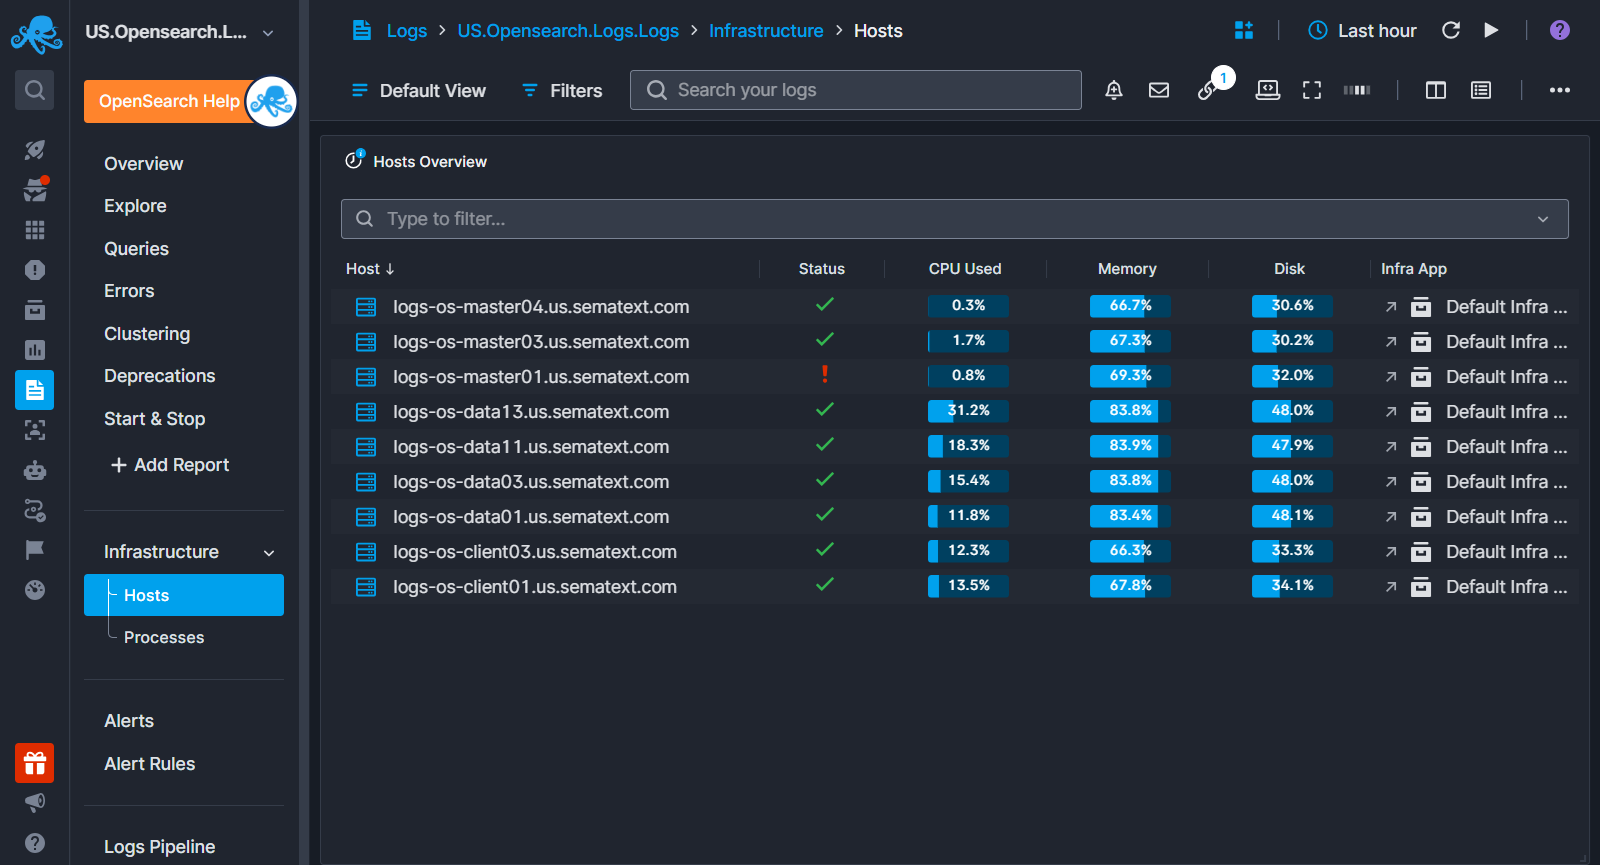
When you ship metrics or logs to Sematext, each App includes an Infrastructure section that lists the hosts sending data to that App. The reports in this section provide system-level details for each host — such as installed packages, running processes, resource usage,events, and logs.
This helps you quickly identify which hosts are involved and access both metrics and logs without switching context. It also removes the need to manually search for hosts or gather system details separately.
To learn more about what you get with Infrastructure Groups:
Whether you're monitoring metrics from a specific service or collecting general OS-level metrics, these host views are available.