Kafka
Sematext has a simple Kafka monitoring Agent written in Java and Go with minimal CPU and memory overhead. It's easy to install and doesn't require any changes to the Kafka source code or your application's source code.
Sematext Kafka Monitoring Agent
This lightweight, open-source Monitoring Agent collects Kafka performance metrics and sends them to Sematext. It comes packaged with a Golang-based agent responsible for Operating System level metrics like network, disk I/O, and more. The Kafka Monitoring Agent can be installed with RPM/DEB package manager on any host running Linux or in a containerized environment using sematext/sematext-agent.
The Sematext Kafka Monitoring Agent can be run in two different modes - in-process and standalone. The in-process one is run as a Java agent, it is simpler to initially set up, but will require restarting your Kafka broker/producer/consumer when you will want to upgrade your monitoring Agent, i.e. to get new features. The benefit of the standalone agent mode is that it runs as a separate process and doesn't require a Kafka broker/producer/consumer restart when it is installed or upgraded.
After creating a Kafka App in Sematext you need to install the Monitoring Agent on each host running your Kafka brokers, producers and consumer to have the full visibility over the metrics from each host. The full installation instructions can be found in the setup instructions displayed in the UI.
For example, on CentOS, you need to add Sematext Linux packages and install them with the following command:
sudo wget https://pub-repo.sematext.com/centos/sematext.repo -O /etc/yum.repos.d/sematext.repo
sudo yum clean all
sudo yum install sematext-agent
After that, set up the Kafka Monitoring Agent on your Kafka broker by running a command like this:
sudo bash /opt/spm/bin/setup-sematext  \
    --monitoring-token <your-monitoring-token-goes-here>   \
    --app-type kafka  \
    --app-subtype kafka-broker  \
    --agent-type javaagent  \
    --infra-token <your-infra-token-goes-here>
Keep in mind that your need to provide the Monitoring token and Infra token. They are both provided in the installation instructions for your Kafka App.
The last thing that needs to be done is adjusting the $KAFKA_HOME/bin/kafka-server-start.sh file and add the following section to the KAFKA_JMX_OPTS:
-Dcom.sun.management.jmxremote -javaagent:/opt/spm/spm-monitor/lib/spm-monitor-generic.jar=<your-monitoring-token-goes-here>:kafka-broker:default
You need to restart your Kafka broker after the changes above.
To see the complete picture of Kafka performance install the monitoring agent on each of your Kafka producers and consumers. Here is how you can do that.
Monitoring Producers
To have the full visibility into the entire Kafka pipeline it's crucial to monitor your Kafka producers as well. If you're using Java or Scala as the language of choice for the producers' implementation you need to install the Kafka Monitoring Agent on each host working as a Kafka producer by running the following command (e.g. for CentOS):
sudo wget https://pub-repo.sematext.com/centos/sematext.repo -O /etc/yum.repos.d/sematext.repo
sudo yum clean all
sudo yum install sematext-agent
After that, run the following command to set up Kafka producer monitoring:
sudo bash /opt/spm/bin/setup-sematext  \
    --monitoring-token <your-monitoring-token-goes-here>  \
    --app-type kafka  \
    --app-subtype kafka-producer  \
    --agent-type javaagent  \
    --infra-token <your-infra-token-goes-here>
Once that is done you need to add the following options to the JVM start-up properties:
-Dcom.sun.management.jmxremote -javaagent:/opt/spm/spm-monitor/lib/spm-monitor-generic.jar=<your-monitoring-token-goes-here>:kafka-producer:default
You need to restart your Kafka producer after the changes above.
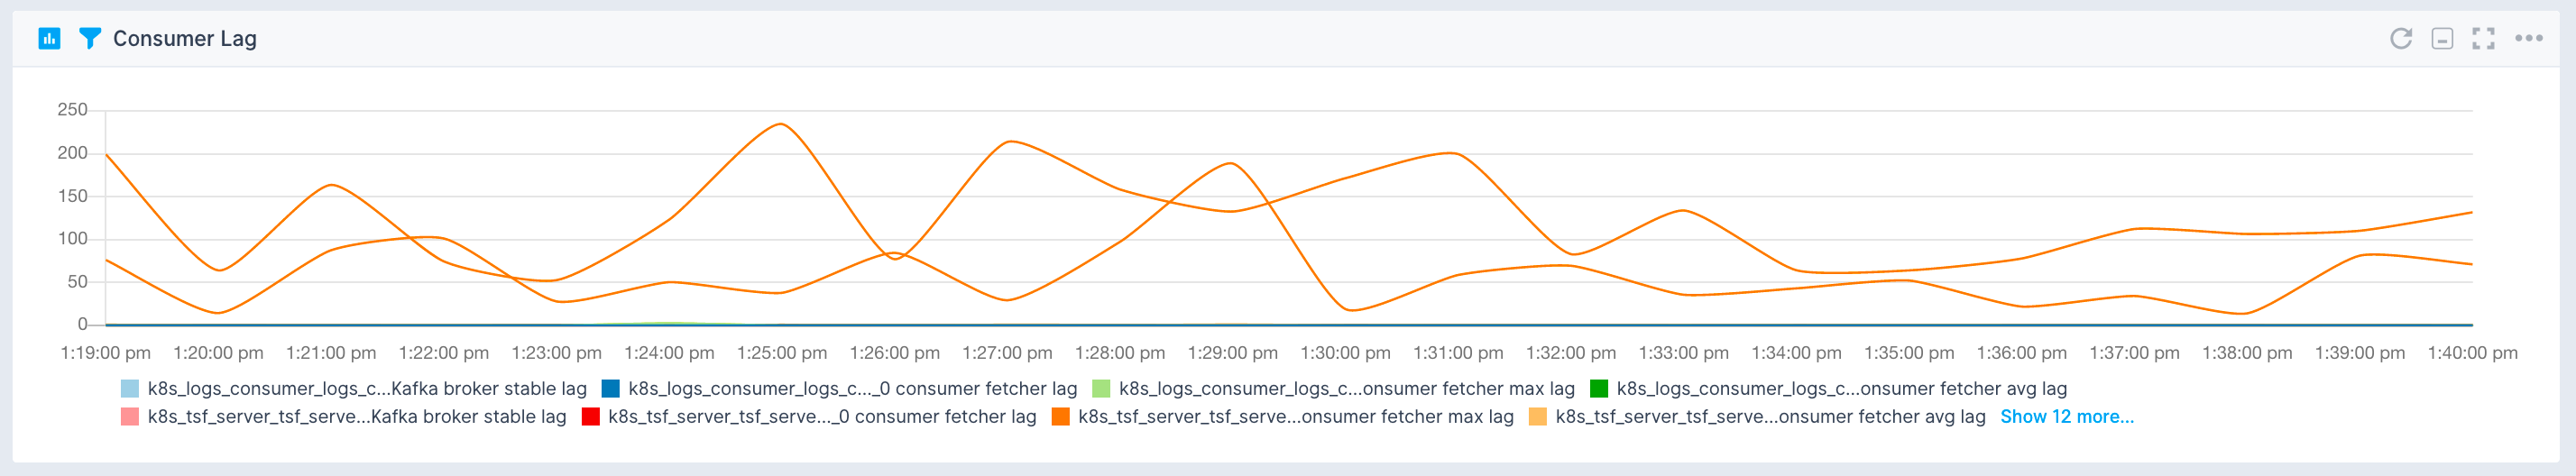
Monitoring Consumers
Monitoring your consumers is crucial to have visibility into consumer lag, which can help you quickly identify issues with your pipeline. If you're using Java or Scala as the language of choice for the consumers' implementation you need to install the Kafka Monitoring Agent on each host working as a Kafka consumer by running the following command (e.g. for CentOS):
sudo wget https://pub-repo.sematext.com/centos/sematext.repo -O /etc/yum.repos.d/sematext.repo
sudo yum clean all
sudo yum install sematext-agent
After that, run the following command to setup Kafka consumer monitoring:
sudo bash /opt/spm/bin/setup-sematext  \
    --monitoring-token <your-monitoring-token-goes-here>   \
    --app-type kafka  \
    --app-subtype kafka-consumer  \
    --agent-type javaagent  \
    --infra-token <your-infra-token-goes-here>
Once that is done add the following options to the JVM start-up properties:
-Dcom.sun.management.jmxremote -javaagent:/opt/spm/spm-monitor/lib/spm-monitor-generic.jar=<your-monitoring-token-goes-here>:kafka-consumer:default
You need to restart your Kafka consumer after the changes above.
Collected Metrics
The Sematext Kafka monitoring agent collects the following metrics.
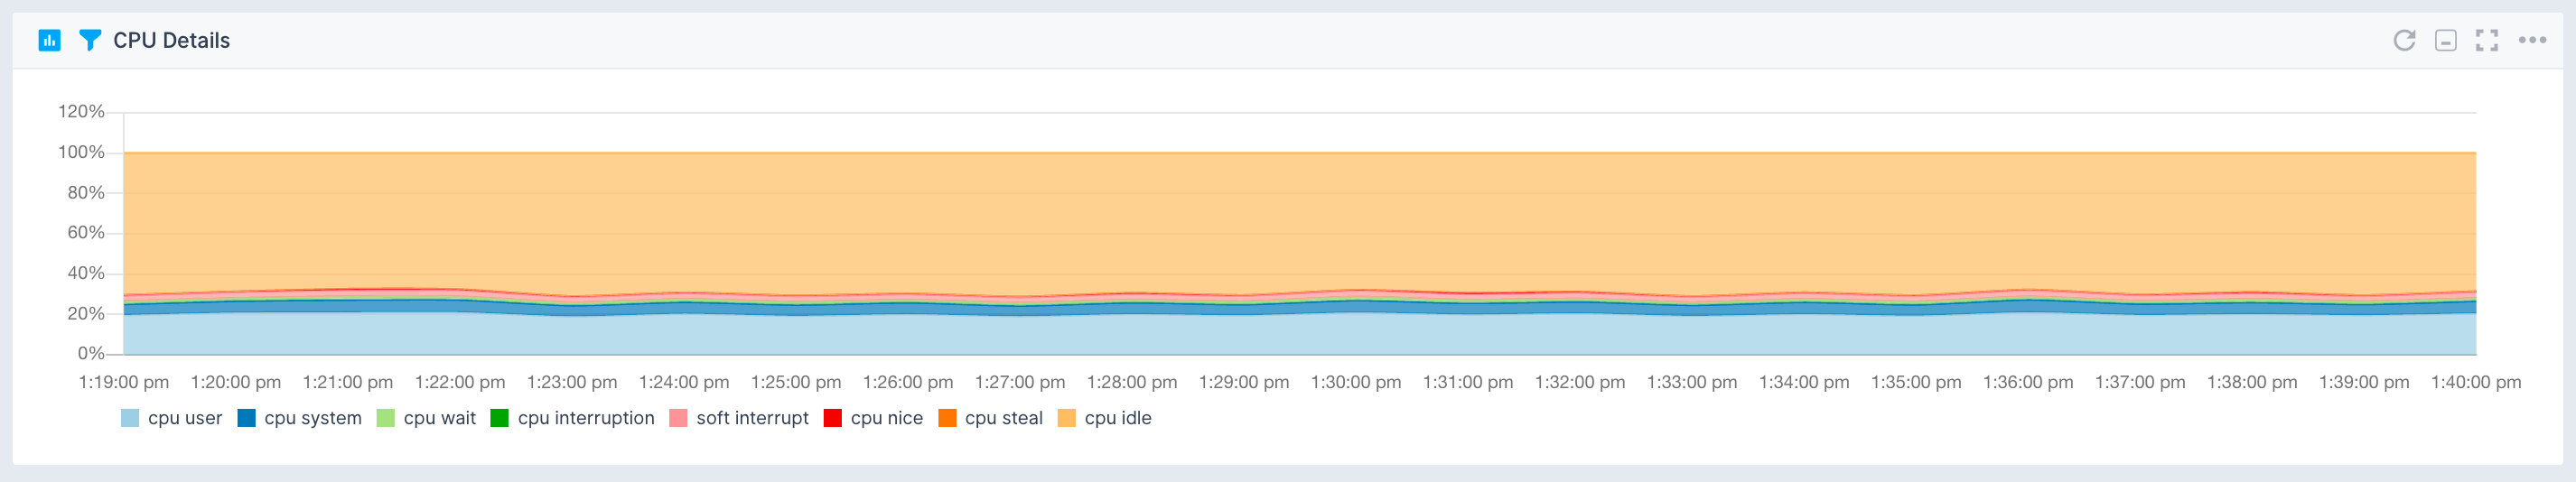
Operating System
- CPU usage
- CPU load
- Memory usage
- Swap usage
- Disk space used
- I/O Reads and Writes
- Network traffic
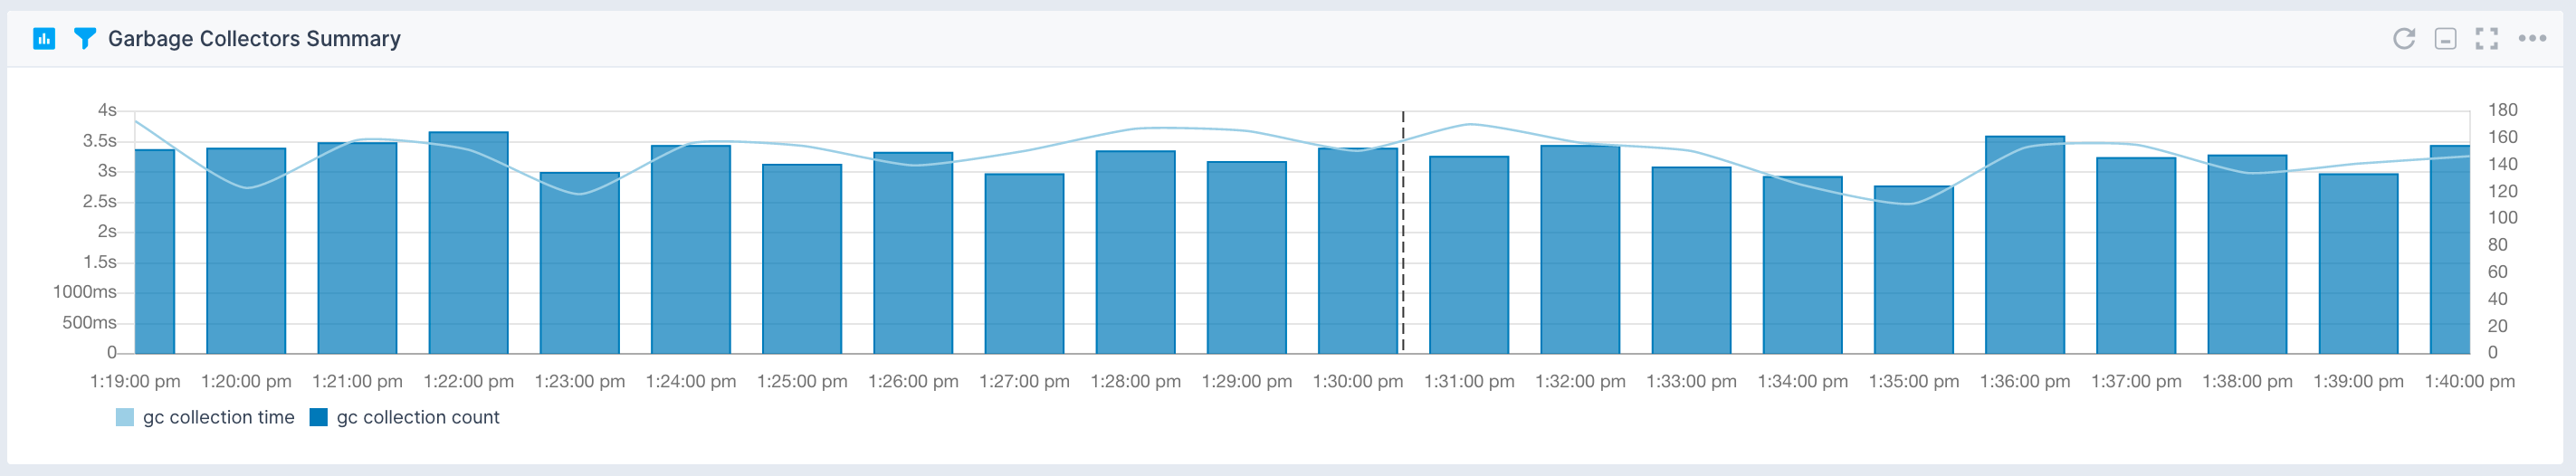
Java Virtual Machine
- Garbage collectors time and count
- JVM pool size and utilization
- Threads and daemon threads
- Files opened by the JVM
Kafka
- Partitions, leaders partitions, offline partitions, under replicated partitions
- Static broker lag
- Leader elections, unclean leader elections, leader elections time
- Active controllers
- ISR/Log flush
- Log cleaner buffer utilization, cleaner working time, cleaner recopy
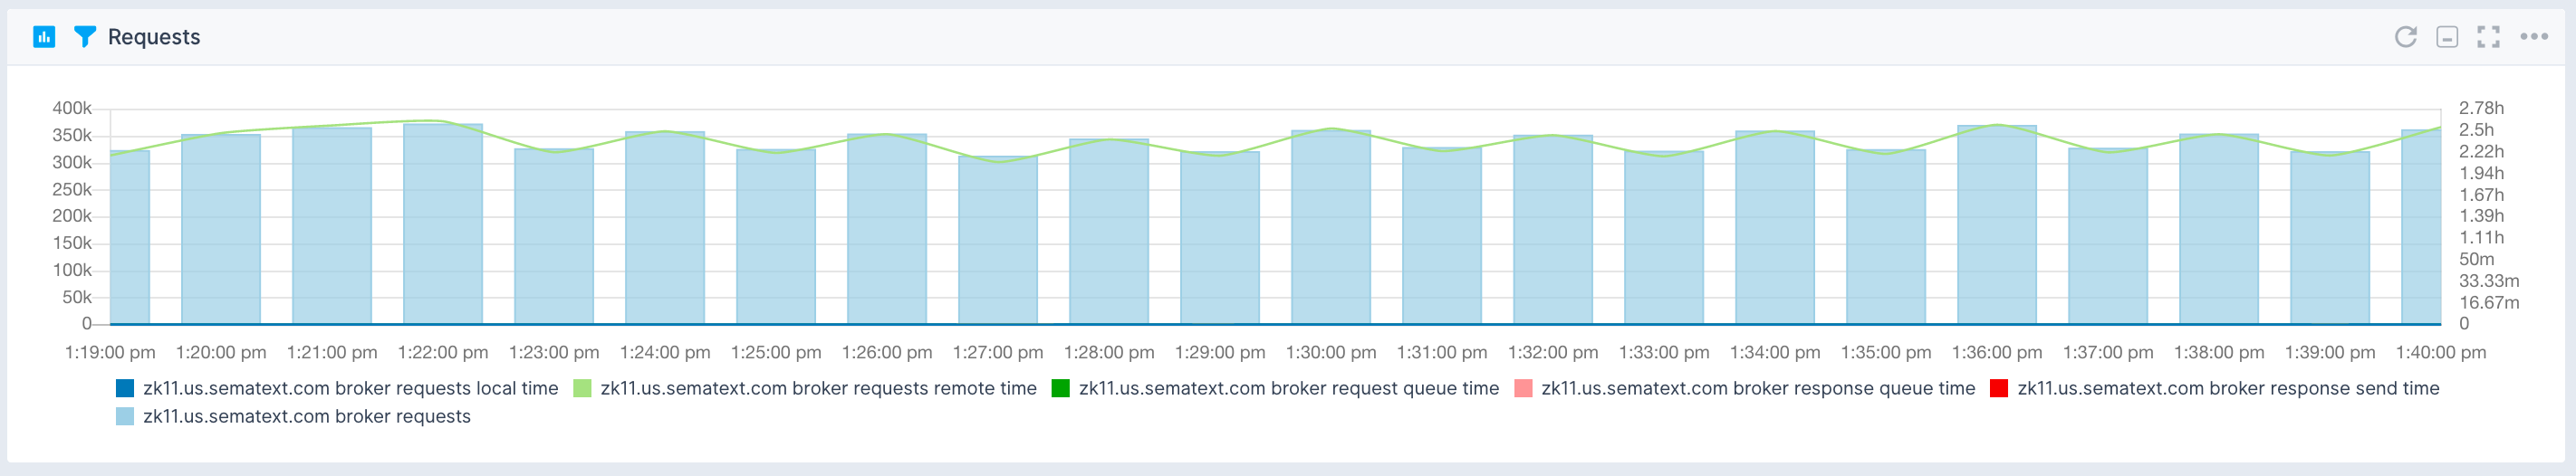
- Response and request queues
- Replica maximum lag, replica minimum fetch, preferred replicas imbalances
- Topic messages in, topic in/out, topic rejected, failed fetch and produce requests
- Log segment, log size, log offset increasing
Kafka Producer
- Batch size, max batch size
- Compression rate
- Buffer available bytes
- Buffer pool wait ratio
- I/O time, I/O ratio, I/O wait time, I/O wait ratio
- Connection count, connection create rate, connection close rate, network I/O rate
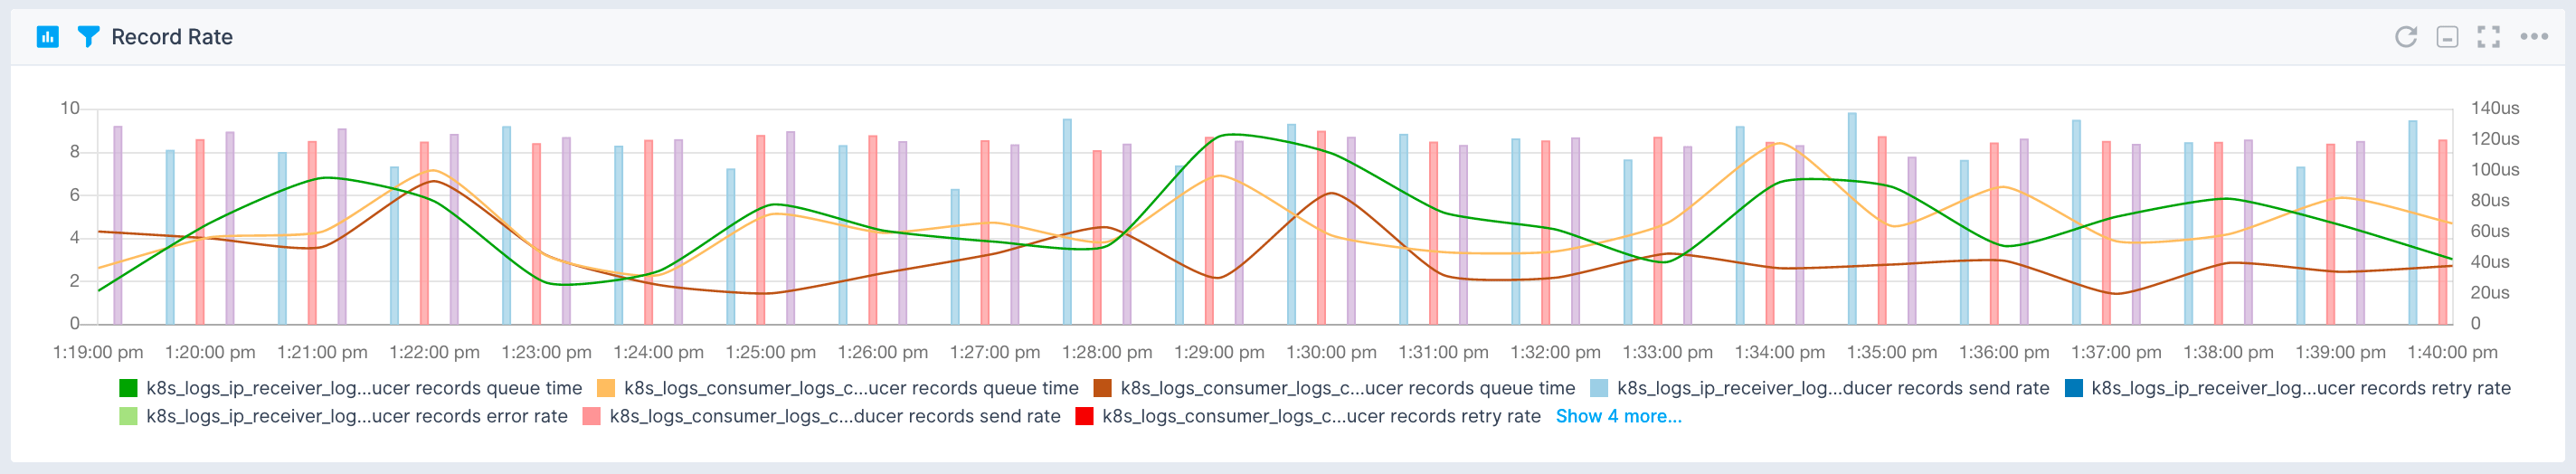
- Record queue time, send rate, retry rate, error rate, records per request, record size, response rate, request size and maximum size
- Nodes bytes in rate, node bytes out rate, request latency and max latency, request rate, response rate, request size and maximum size
- Topic compression rate, bytes rate, records send rate, records retries rate, records errors rate
Kafka Consumer
- Consumer lag
- Fetcher responses, bytes, responses bytes
- I/O time, I/O ratio, I/O wait time, I/O wait ratio
- Connection count, connection create rate, connection close rate, network I/O rate
- Consumed rate, records per request, fetch latency, fetch rate, bytes consumed rate, average fetch size, throttle maximum time
- Assigned partitions, heartbeat maximum response time, heartbeat rate, join time and maximum join time, sync time and maximum sync time, join rate, sync rate
- Nodes bytes in rate, node bytes out rate, request latency and max latency, request rate, response rate, request size and maximum size
Kafka Alerts
As soon as you create a Kafka App, you will receive a set of default alert rules. These pre-configured rules will notify you of important events that may require your attention, as shown below.
Consumer lag anomaly
This alert rule continuously monitors consumer lag in Kafka consumer clients, detecting anomalies in lag values over time. When anomalies are detected, it triggers a warning (WARN priority). The minimum delay between consecutive notifications triggered by this alert rule is set to 10 minutes.
Suppose a Kafka consumer client typically processes messages without significant lag, but due to increased message volume or processing issues, the consumer lag suddenly spikes beyond normal levels. When this happens, the alert rule checks for anomalies in consumer lag values over the last 90 minutes and triggers a warning.
Actions to take
- Review Kafka consumer client configurations, message processing logic and system metrics to find the underlying cause of the increased lag
- If the increased lag is due to limited resources, consider scaling up Kafka consumer client resources such as CPU, memory, or network bandwidth
- Consider increasing the number of partitions for the relevant topics to distribute the load more evenly across consumers
- Consider increasing the number of consumer instances to reduce lag
In-sync replicas anomaly
This alert rule continuously monitors the number of in-sync replicas (ISRs) in a Kafka cluster, detecting anomalies in ISR counts over time. When anomalies are detected, it triggers a warning (WARN priority). The minimum delay between consecutive alerts triggered by this alert rule is set to 10 minutes.
Suppose a Kafka cluster typically maintains a stable number of in-sync replicas across its brokers. However, due to network issues or broker failures, the number of in-sync replicas starts changing unexpectedly. When this happens, the alert rule checks for anomalies in the number of in-sync replicas over the last 10 minutes. Upon detecting the anomaly in ISR counts, the alert rule triggers a warning.
Actions to take
- Check the status of Kafka brokers to determine if any brokers have become unavailable or are experiencing issues
- Review network configurations and connectivity between Kafka brokers for any network issues affecting communication and replication
- If brokers have become unavailable, restore replication and make sure that all partitions have the required number of in-sync replicas
Producer error rate anomaly
This alert rule continuously monitors the error rate of Kafka producers, detecting anomalies in the rate at which producer records encounter errors during message sending. When anomalies are detected, it triggers a warning (WARN priority). The minimum delay between consecutive alerts triggered by this alert rule is set to 10 minutes.
Suppose a Kafka producer typically sends messages without getting errors, but due to network issues or limited resources, the errror rate of producer records suddenly spikes. When this happens, the alert rule checks for anomalies in the error rate of producer records over the last 10 minutes and upon detecting an anomaly it triggers a warning.
Actions to take
- Check the status of Kafka producers to see if any producers are experiencing issues or errors
- Review network configurations and connectivity between Kafka producers and brokers for any network issues affecting message sending
Producer topic records error rate anomaly
This alert rule continuously monitors the error rate of Kafka producer records at the topic level, detecting anomalies in the rate at which records encounter errors during message sending for specific topics. When anomalies are detected, it triggers a warning (WARN priority). The minimum delay between consecutive alerts triggered by this alert rule is set to 10 minutes.
Suppose a Kafka producer typically sends messages to multiple topics without encountering errors, but due to issues with specific topics or data ingestion processes, the error rate of producer records for certain topics suddenly spikes. When this happens, the alert rule checks for anomalies in the error rate of producer records for specific topics over the last 10 minutes. Upon detecting the anomaly the alert rule triggers a warning.
Actions to take
- Investigate which specific Kafka topics are experiencing an increased error rate in producer records. This can be done by examining the topic-level error rate metrics
- Review the configuration settings for the affected Kafka topics, including replication factor, partitioning strategy, and retention policy. Make sure that the configurations align with the expected workload
- Review the configuration settings for Kafka producers, such as batch size, linger time, compression type, and retries
Underreplicated partition count anomaly
This alert rule continuously monitors the count of under-replicated partitions in a Kafka cluster, detecting anomalies in the number of partitions that are not fully replicated across all brokers. When anomalies are detected, it triggers a warning (WARN priority). The minimum delay between consecutive alerts triggered by this alert rule is set to 10 minutes.
Suppose a Kafka cluster typically maintains full replication of partitions across all brokers, but due to broker failures, network issues, or limited resources, some partitions become under-replicated. When this happens, the alert rule checks for anomalies in the count of under-replicated partitions over the last 10 minutes. Upon detecting the anomaly in the count of under-replicated partitions, the alert rule triggers a warning.
Actions to take
- Check the status of Kafka brokers for any broker failures or issues that may be causing partitions to become under-replicated
- Review the replication configurations for affected topics and partitions and double check that replication factors are set correctly
- Address any network issues or connectivity problems between Kafka brokers that may be impacting the replication of partitions
- Consider rebalancing partitions across brokers to have even distribution and optimal replication, especially if certain brokers are overloaded or underutilized
Offline partition count anomaly
This alert rule continuously monitors the count of offline partitions in a Kafka cluster, detecting anomalies in the number of partitions that are currently offline and unavailable. When anomalies are detected, it triggers a warning (WARN priority). The minimum delay between consecutive alerts triggered by this alert rule is set to 10 minutes.
Suppose a Kafka cluster typically maintains all partitions online and available for data replication and consumption. However, due to broker failures, disk failures, or other issues, some partitions become offline and unavailable. When this happens, the alert rule checks for anomalies in the count of offline partitions over the last 10 minutes. Upon detecting the anomaly, the alert rule triggers a warning.
Actions to take
- Check the status of Kafka brokers for any broker failures or issues that may be causing partitions to become offline
- Review the replication status and configuration of affected partitions to understand why they became offline. Determine if there are any replication issues or failures
- If offline partitions are due to broker failures, try to recover or replace the failed brokers and make sure that partitions are redistributed and replicated properly
- If offline partitions are due to disk failures or storage issues, address the underlying disk failures and make sure that Kafka data directories are accessible and properly configured
- Monitor the reassignment of offline partitions so that they are brought back online and replicated across available brokers effectively
- Review data retention policies and disk space management to prevent future occurrences of offline partitions due to disk space issues
Failed fetch requests anomaly
This alert rule continuously monitors the count of failed fetch requests in a Kafka broker for topics, detecting anomalies in the number of requests that fail to fetch data. When anomalies are detected, it triggers a warning (WARN priority). The minimum delay between consecutive alerts triggered by this alert rule is set to 10 minutes.
Suppose a Kafka broker typically handles fetch requests without encountering failures, but due to network issues, disk failures, or other factors, some fetch requests begin to fail intermittently. When this happens, the alert rule checks for anomalies in the count of failed fetch requests over the last 10 minutes. Upon detecting the anomaly, the alert rule triggers a warning.
Actions to take
- Check the status of the Kafka broker for any issues such as network connectivity problems, disk failures, or resource constraints that may be causing fetch requests to fail
- Review disk utilization metrics for the Kafka broker to make sure that there is sufficient disk space available for storing topic data and handling fetch requests
- Review network configurations and connectivity between the Kafka broker and clients for any network issues that may be causing fetch request failures
- Monitor disk I/O metrics for the Kafka broker for any bottlenecks or performance issues related to disk read/write operations
- Review fetch request settings such as fetch size, timeout, and max fetch retries
You can create additional alerts on any metric.
Troubleshooting
If you are having issues with Sematext Monitoring, i.e. not seeing Kafka metrics, see How do I create the diagnostics package.
For more troubleshooting information look at Troubleshooting section.
Integration
- Agent: https://github.com/sematext/sematext-agent-java
- Instructions: https://apps.sematext.com/ui/howto/Kafka/overview
More about Apache Kafka Monitoring
- Apache Kafka Metrics To Monitor
- Apache Kafka Open Source Monitoring Tools
- Monitoring Apache Kafka With Sematext
Metrics
| Metric Name Key (Type) (Unit) |
Description |
|---|---|
| broker log cleaner buffer utilization kafka.broker.log.cleaner.clean.buffer.utilization (long gauge) (%) |
|
| broker log cleaner recopy kafka.broker.log.cleaner.recopy.percentage (long gauge) (%) |
|
| broker log cleaner max time kafka.broker.log.cleaner.clean.time (long gauge) (ms) |
|
| broker log cleaner dirty kafka.broker.log.cleaner.dirty.percentage (long gauge) (%) |
|
| broker requests local time kafka.broker.requests.time.local (double counter) (ms) |
|
| broker requests remote time kafka.broker.requests.time.remote (double counter) (ms) |
|
| broker request queue time kafka.broker.requests.time.queue (double counter) (ms) |
|
| broker requests kafka.broker.requests (long counter) |
|
| broker response queue time kafka.broker.responses.time.queue (double counter) (ms) |
|
| broker response send time kafka.broker.responses.time.send (double counter) (ms) |
|
| broker requests total time kafka.broker.requests.time.total (double counter) (ms) |
|
| broker leader elections kafka.broker.leader.elections (long counter) |
|
| broker leader elections time kafka.broker.leader.elections.time (double counter) (ms) |
|
| broker leader unclean elections kafka.broker.leader.elections.unclean (long counter) |
|
| broker active controllers kafka.broker.controllers.active (long gauge) |
Is controller active on broker |
| broker offline partitions kafka.broker.partitions.offline (long gauge) |
Number of unavailable partitions |
| broker preferred replica imbalances kafka.broker.replica.imbalance (long gauge) |
|
| broker response queue kafka.broker.queue.response.size (long gauge) (bytes) |
Response queue size |
| broker request queue kafka.broker.queue.request.size (long gauge) (bytes) |
Request queue size |
| broker expires consumers kafka.broker.expires.consumer (long counter) |
Number of expired delayed consumer fetch requests |
| broker expires followers kafka.broker.expires.follower (long counter) |
Number of expired delayed follower fetch requests |
| broker all expires kafka.broker.expires.all (long counter) |
Number of expired delayed producer requests |
| purgatory fetch delayed reqs kafka.broker.purgatory.requests.fetch.delayed (long gauge) |
Number of requests delayed in the fetch purgatory |
| purgatory fetch delayed reqs size kafka.broker.purgatory.requests.fetch.size (long gauge) |
Requests waiting in the fetch purgatory. This depends on value of fetch.wait.max.ms in the consumer |
| purgatory producer delayed reqs kafka.broker.purgatory.producer.requests.fetch.delayed (long gauge) |
Number of requests delayed in the producer purgatory |
| purgatory producer delayed reqs size kafka.broker.purgatory.producer.requests.fetch.size (long gauge) |
Requests waiting in the producer purgatory. This should be non-zero when acks = -1 is used in producers |
| broker replica max lag kafka.broker.replica.lag.max (long gauge) |
|
| broker replica min fetch kafka.broker.replica.fetch.min (double gauge) |
|
| broker isr expands kafka.broker.isr.expands (long counter) |
Number of times ISR for a partition expanded |
| broker isr shrinks kafka.broker.isr.shrinks (long counter) |
Number of times ISR for a partition shrank |
| broker leader partitions kafka.broker.partitions.leader (long gauge) |
Number of leader replicas on broker |
| broker partitions kafka.broker.partitions (long gauge) |
Number of partitions (lead or follower replicas) on broker |
| broker under replicated partitions kafka.broker.partitions.underreplicated (long gauge) |
Number of partitions with unavailable replicas |
| broker log flushes kafka.broker.log.flushes (long counter) (flushes/sec) |
Rate of flushing Kafka logs to disk |
| broker log flushes time kafka.broker.log.flushes.time (double counter) (ms) |
Time of flushing Kafka logs to disk |
| broker partitions under replicated kafka.broker.partition.underreplicated (double gauge) |
|
| broker log offset increasing kafka.broker.log.offset.end (long counter) |
|
| broker log segments kafka.broker.log.segments (long gauge) |
|
| broker log size kafka.broker.log.size (long gauge) (bytes) |
|
| broker topic in kafka.broker.topic.in.bytes (long counter) (bytes) |
|
| broker topic out kafka.broker.topic.out.bytes (long counter) (bytes) |
|
| broker topic failed fetch requests kafka.broker.topic.requests.fetch.failed (long counter) |
|
| broker topic failed produce requests kafka.broker.topic.requests.produce.failed (long counter) |
|
| broker topic messages in kafka.broker.topic.in.messages (long counter) |
|
| broker topic rejected kafka.broker.topic.in.bytes.rejected (long counter) (bytes) |
|
| consumer assigned partitions kafka.consumer.partitions.assigned (double gauge) |
The number of partitions currently assigned to consumer |
| consumer commits rate kafka.consumer.coordinator.commit.rate (double gauge) (commits/sec) |
|
| consumer commit latency kafka.consumer.coordinator.commit.latency (double gauge) (ms) |
|
| consumer commit max latency kafka.consumer.coordinator.commit.latency.max (double gauge) (ms) |
|
| consumer join rate kafka.consumer.coordinator.join.rate (double gauge) (joins/sec) |
The number of group joins per second |
| consumer join time kafka.consumer.coordinator.join.time (double gauge) (ms) |
The average time taken for a group rejoin |
| consumer join max time kafka.consumer.coordinator.join.time.max (double gauge) (ms) |
The max time taken for a group rejoin |
| consumer syncs rate kafka.consumer.coordinator.sync.rate (double gauge) (syncs/sec) |
The number of group syncs per second |
| consumer sync time kafka.consumer.coordinator.sync.time (double gauge) (ms) |
The average time taken for a group sync |
| consumer sync max time kafka.consumer.coordinator.sync.time.max (double gauge) (ms) |
The max time taken for a group sync |
| consumer heartbeats rate kafka.consumer.coordinator.heartbeat.rate (double gauge) (beats/sec) |
The number of hearthbeats per second |
| consumer heartbeat response max time kafka.consumer.coordinator.heartbeat.time (double gauge) (ms) |
The max time taken to receive a response to a heartbeat request |
| consumer last heartbeat kafka.consumer.coordinator.heartbeat.last (double gauge) (sec) |
The number of seconds since the last controller heartbeat |
| consumer fetcher max lag kafka.consumer.fetcher.max.lag (double gauge) |
Max lag in messages per topic partition |
| consumer fetcher avg lag kafka.consumer.fetcher.avg.lag (double gauge) |
Average lag in messages per topic partition |
| consumer fetcher lag kafka.consumer.fetcher.lag (double gauge) |
Lag in messages per topic partition |
| bytes consumed rate kafka.consumer.bytes.rate (double gauge) (bytes/sec) |
The average number of bytes consumed per second |
| records consumed rate kafka.consumer.records.rate (double gauge) (rec/sec) |
The average number of records consumed per second |
| consumer records max lag kafka.consumer.records.lag.max (double gauge) |
The maximum lag in terms of number of records for any partition |
| consumer records per request kafka.consumer.requests.records.avg (double gauge) (rec/req) |
The average number of records per request |
| consumer fetch rate kafka.consumer.fetch.rate (double gauge) (fetches/sec) |
The number of fetch requests per second |
| consumer fetch avg size kafka.consumer.fetch.size (double gauge) (bytes) |
The average number of bytes fetched per request |
| consumer fetch max size kafka.consumer.fetch.size.max (double gauge) (bytes) |
The maximum number of bytes fetched per request |
| consumer fetch latency kafka.consumer.fetch.latency (double gauge) (ms) |
The average time taken for a fetch request |
| consumer fetch max latency kafka.consumer.fetch.latency.max (double gauge) (ms) |
The maximum time taken for a fetch request |
| consumer throttle time kafka.consumer.throttle.time (double gauge) (ms) |
The avarage throttle time in ms |
| consumer throttle max time kafka.consumer.throttle.time.max (double gauge) (ms) |
The max throttle time in ms |
| consumer node requests rate kafka.consumer.node.request.rate (double gauge) (req/sec) |
The average number of requests sent per second. |
| consumer node request size kafka.consumer.node.request.size (double gauge) (bytes) |
The average size of all requests in the window.. |
| consumer node in bytes rate kafka.consumer.node.in.bytes.rate (double gauge) (bytes/sec) |
Bytes/second read off socket |
| consumer node request max size kafka.consumer.node.request.size.max (double gauge) (bytes) |
The maximum size of any request sent in the window. |
| consumer node out bytes rate kafka.consumer.node.out.bytes.rate (double gauge) (bytes/sec) |
The average number of outgoing bytes sent per second to servers. |
| consumer node request max latency kafka.consumer.node.request.latency.max (double gauge) (ms) |
The maximum request latency |
| consumer node request latency kafka.consumer.node.request.latency (double gauge) (ms) |
The average request latency |
| consumer node responses rate kafka.consumer.node.response.rate (double gauge) (res/sec) |
The average number of responses received per second. |
| consumer io ratio kafka.consumer.io.ratio (double gauge) (%) |
The fraction of time the I/O thread spent doing I/O |
| consumer request size kafka.consumer.request.size (double gauge) (bytes) |
|
| consumer network io rate kafka.consumer.io.rate (double gauge) (op/sec) |
The average number of network operations (reads or writes) on all connections per second. |
| consumer in bytes rate kafka.consumer.incomming.bytes.rate (double gauge) (bytes/sec) |
|
| consumer connection count kafka.consumer.connections (double gauge) |
The current number of active connections. |
| consumer requests rate kafka.consumer.requests.rate (double gauge) (req/sec) |
|
| consumer selects rate kafka.consumer.selects.rate (double gauge) (sel/sec) |
|
| consumer connection creation rate kafka.consumer.connections.create.rate (double gauge) (conn/sec) |
New connections established per second in the window. |
| consumer connection close rate kafka.consumer.connections.close.rate (double gauge) (conn/sec) |
Connections closed per second in the window. |
| consumer io wait ratio kafka.consumer.io.wait.ratio (double gauge) (ms) |
The fraction of time the I/O thread spent waiting. |
| consumer io wait time kafka.consumer.io.wait.time.ns (double gauge) (ns) |
The average length of time the I/O thread spent waiting for a socket ready for reads or writes. |
| consumer out bytes rate kafka.consumer.outgoing.bytes.rate (double gauge) (bytes/sec) |
|
| consumer io time kafka.consumer.io.time.ns (double gauge) (ns) |
The average length of time for I/O per select call. |
| consumer responses rate kafka.consumer.responses.rate (double gauge) (res/sec) |
|
| producer node requests rate kafka.producer.node.requests.rate (double gauge) (req/sec) |
The average number of requests sent per second. |
| producer request size kafka.producer.requests.size (double gauge) (bytes) |
The average size of all requests in the window. |
| producer node in bytes rate kafka.producer.node.in.bytes.rate (double gauge) (bytes) |
Bytes/second read off socket |
| producer request max size kafka.producer.requests.size.max (double gauge) (bytes) |
The maximum size of any request sent in the window. |
| producer node out bytes rate kafka.producer.node.out.bytes.rate (double gauge) (bytes) |
The average number of outgoing bytes sent per second to servers. |
| producer node request max latency kafka.producer.node.requests.latency.max (double gauge) (ms) |
The maximum request latency |
| producer node request latency kafka.producer.node.requests.latency (double gauge) (ms) |
The average request latency |
| producer node responses rate kafka.producer.node.responses.rate (double gauge) (res/sec) |
The average number of responses received per second. |
| producer records retries rate kafka.producer.topic.records.retry.rate (double gauge) (retries/sec) |
The average per-second number of retried record sends |
| producer topic compression rate kafka.producer.topic.compression.rate (double gauge) |
The average compression rate of records. |
| producer topic bytes rate kafka.producer.topic.bytes.rate (double gauge) (bytes/sec) |
The average rate of bytes. |
| producer records sends rate kafka.producer.topic.records.send.rate (double gauge) (sends/sec) |
The average number of records sent per second. |
| producer records errors rate kafka.producer.topic.records.error.rate (double gauge) (errors/sec) |
The average per-second number of record sends that resulted in errors |
| producer records queue time kafka.producer.records.queued.time (double gauge) (ms) |
The average time record batches spent in the record accumulator. |
| producer io ratio kafka.producer.io.ratio (double gauge) (%) |
The fraction of time the I/O thread spent doing I/O |
| producer record max size kafka.producer.records.size.max (double gauge) (bytes) |
The maximum record size |
| producer request size kafka.producer.request.size (double gauge) (bytes) |
|
| producer requests max size kafka.producer.request.size.max (double gauge) |
|
| record size kafka.producer.records.size (double gauge) (bytes) |
The average producer record size |
| producer request max latency kafka.producer.request.latency.max (double gauge) (ms) |
|
| producer requests in flight kafka.producer.requests.inflight (double gauge) |
The current number of in-flight requests awaiting a response. |
| producer buffer pool wait ratio kafka.producer.buffer.pool.wait.ratio (double gauge) (%) |
The fraction of time an appender waits for space allocation. |
| producer network io rate kafka.producer.io.rate (double gauge) (op/sec) |
The average number of network operations (reads or writes) on all connections per second. |
| producer records queue max time kafka.producer.records.queued.time.max (double gauge) (ms) |
The maximum time record batches spent in the record accumulator. |
| producer in bytes rate kafka.producer.in.bytes.rate (double gauge) (bytes/sec) |
|
| producer connections count kafka.producer.connections (double gauge) |
The current number of active connections. |
| producer metadata age kafka.producer.metadata.age (double gauge) (ms) |
|
| producer records per request kafka.producer.requests.records (double gauge) (rec/req) |
The average number of records per request. |
| producer records retry rate kafka.producer.records.retry.rate (double gauge) (rec/sec) |
The average per-second number of retried record sends |
| producer buffer total bytes kafka.producer.buffer.size (double gauge) (bytes) |
The maximum amount of buffer memory the client can use (whether or not it is currently used). |
| producer compression rate kafka.producer.compression.rate (double gauge) (%) |
The average compression rate of record batches. |
| producer buffer available bytes kafka.producer.buffer.available (double gauge) (bytes) |
The total amount of buffer memory that is not being used (either unallocated or in the free list). |
| producer requests rate kafka.producer.requests.rate (double gauge) (req/sec) |
|
| producer records send rate kafka.producer.records.send.rate (double gauge) (rec/sec) |
The average number of records sent per second. |
| producer selects rate kafka.producer.selects.rate (double gauge) (sel/sec) |
Number of times the I/O layer checked for new I/O to perform per second |
| producer request latency kafka.producer.request.latency (double gauge) (ms) |
|
| producer records error rate kafka.producer.records.error.rate (double gauge) (errors/sec) |
The average per-second number of record sends that resulted in errors |
| producer connection creation rate kafka.producer.connections.create.rate (double gauge) (conn/sec) |
New connections established per second in the window. |
| producer max batch size kafka.producer.batch.size.max (double gauge) (bytes/req) |
The max number of bytes sent per partition per-request. |
| producer connection close rate kafka.producer.connections.close.rate (double gauge) (conn/sec) |
Connections closed per second in the window. |
| producer waiting threads kafka.producer.threads.waiting (double gauge) |
The number of user threads blocked waiting for buffer memory to enqueue their records |
| producer batch size kafka.producer.batch.size (double gauge) (bytes/req) |
The average number of bytes sent per partition per-request. |
| producer io wait ratio kafka.producer.io.wait.ratio (double gauge) (%) |
The fraction of time the I/O thread spent waiting. |
| producer io wait time kafka.producer.io.wait.time.ns (double gauge) (ms) |
The average length of time the I/O thread spent waiting for a socket ready for reads or writes. |
| producer out bytes rate kafka.producer.out.bytes.rate (double gauge) (bytes/sec) |
|
| producer io time kafka.producer.io.time.ns (double gauge) (ms) |
The average length of time for I/O per select call. |
| producer responses rate kafka.producer.responses.rate (double gauge) (res/sec) |
|
| consumer kafka commits kafka.consumer.old.commits.kafka (long counter) |
|
| consumer zk commits kafka.consumer.old.commits.zookeeper (long counter) |
|
| consumer rebalances count kafka.consumer.old.rebalances (long counter) |
|
| consumer rebalances time kafka.consumer.old.rebalances.time (double counter) (ms) |
|
| consumer topic queue size kafka.consumer.old.topic.queue (long gauge) |
|
| consumer fetcher bytes kafka.consumer.old.requests.bytes (long counter) |
|
| consumer throttle mean time kafka.consumer.old.requests.throttle.mean.time (double gauge) (ms) |
|
| consumer throtles kafka.consumer.old.requests.throttles (long counter) |
|
| consumer throttles time kafka.consumer.old.requests.throttle.time (double counter) (ms) |
|
| consumer request mean time kafka.consumer.old.requests.mean.time (double gauge) (ms) |
|
| consumer requests time kafka.consumer.old.requests.time (double counter) (ms) |
|
| consumer response mean bytes kafka.consumer.old.responses.mean.bytes (double gauge) |
|
| consumer responses kafka.consumer.old.responses (long counter) |
|
| consumer response bytes kafka.consumer.old.responses.bytes (double counter) |
|
| consumer topic kafka.consumer.old.topic.bytes (long counter) (bytes) |
|
| consumer topic messages kafka.consumer.old.topic.messages (long counter) |
|
| consumer owned partitions kafka.consumer.old.partitions.owned (long gauge) |
|
| producer requests kafka.producer.old.requests (long counter) |
|
| producer request size kafka.producer.old.requests.size (double counter) (bytes) |
|
| producer request time kafka.producer.old.requests.time (double counter) (ms) |
|
| producer sends failed kafka.producer.old.sends.failed (long counter) |
|
| producer resends kafka.producer.old.resends (long counter) |
|
| producer serialization errors kafka.producer.errors.serialization (long counter) |
|
| producer topic kafka.producer.old.topic.bytes (long counter) (bytes) |
|
| producer topic dropped messages kafka.producer.old.topic.messages.dropped (long counter) |
|
| producer topic messages kafka.producer.old.topic.messages (long counter) |