Nginx
Nginx is a high-performance, open-source web server and reverse proxy that handles HTTP, HTTPS, and other network protocols, renowned for its scalability and efficient handling of concurrent connections. The Sematext Agent collects Nginx metrics and logs, transmits them to Sematext Cloud; installing the agent takes less than 5 minutes.
Install Sematext Agent
-
Activate the Nginx stub_status module in the server section of your Nginx config file. If you are using the default Nginx config file it will be in
/etc/nginx/sites-enabled/default:location /nginx_status { stub_status on; access_log off; } -
Create an Nginx Logs or Monitoring App. This will let you install the agent and control access to your monitoring and logs data.
- Install the Sematext Agent according to the https://apps.sematext.com/ui/howto/Nginx/overview displayed in the UI.
- After installing the agent, discovered logs or metrics from Nginx services detected on the host will start shipping automatically.
- If you've created an Nginx Monitoring App and want to collect Nginx logs as well, or vice versa, click on the Create Logs App button from the left menu panel. This will take you to the Create Logs App (or Monitoring App) page. When you select Use Existing Agent, all discovered log sources from Nginx services are listed, allowing you to set up log and metric shipping easily without any additional installation.
Having both Nginx Logs and Monitoring Apps lets you correlate performance metrics and logs, and accelerate troubleshooting using Split Screen for faster resolution. For example, correlating metrics (such as request rate, response times, error rates) with logs (access logs, error logs) helps identify performance bottlenecks, anomalies, or errors. For instance, by linking high request rates in metrics with specific errors or slow response times in logs, you can efficiently optimize configurations, fine-tune caching strategies, or address code-level issues to enhance NGINX performance. Or if you see an increase in 4XX errors in Nginx logs, monitoring can tell what's the impact on Nginx's response times and CPU usage.
To explore logs and services across multiple hosts, navigate to Fleet & Discovery > Discovery > Services (or Sematext Cloud Europe). From there, you can create additional Apps or stream data to existing ones without requiring any additional installations.
Nginx Metrics
| Metric Name | Key | Agg | Type | Description |
|---|---|---|---|---|
| requests | nginx.request.count | Sum | Long | requests: Request count |
| reading | nginx.requests.connections.reading | Avg | Double | reading: Nginx reads request header |
| writing | nginx.requests.connections.writing | Avg | Double | writing: Nginx reads request body, processes request, or writes response to a client |
| waiting | nginx.requests.connections.waiting | Avg | Double | waiting: keep-alive connections |
| active | nginx.requests.connections.active | Avg | Double | active: number of all open connections |
PHP-FPM Monitoring
PHP-FPM monitoring can be enabled along with Nginx monitoring. See PHP-FPM for more details.
NginxPlus Metrics
| Metric Name Key (Type) (Unit) |
Description |
|---|---|
| cache size nginxp.cache.size (long gauge) |
The current size of the cache |
| max cache size nginxp.cache.size.max (long gauge) |
The limit on the maximum size of the cache specified in the configuration |
| cold state nginxp.cache.cold (long gauge) |
The number of time cache in cold state |
| responses hits nginxp.cache.hits.responses (long counter) |
The number of responses read from the cache |
| responses hits size nginxp.cache.hits.bytes (long counter) (bytes) |
The number of bytes read from the cache |
| stale responses nginxp.cache.stale.responses (long counter) |
The number of stale responses read from the cache |
| stale responses size nginxp.cache.stale.bytes (long counter) (bytes) |
The number of stale bytes read from the cache |
| updating responses nginxp.cache.updating.responses (long counter) |
The number of updating responses read from the cache |
| updating responses size nginxp.cache.updating.bytes (long counter) (bytes) |
The number of updating bytes read from the cache |
| revalidated responses nginxp.cache.revalidated.responses (long counter) |
The number of revalidated responses read from the cache |
| revalidated responses size nginxp.cache.revalidated.bytes (long counter) (bytes) |
The number of revalidated bytes read from the cache |
| cache missed responses nginxp.cache.miss.responses (long counter) |
The number of responses not taken from the cache |
| miss responses size nginxp.cache.miss.bytes (long counter) (bytes) |
The number of bytes read from the proxied server |
| miss responses written nginxp.cache.miss.responses.written (long counter) |
The number of miss responses written to the cache |
| miss written size nginxp.cache.miss.bytes.written (long counter) (bytes) |
The number of miss bytes written to the cache |
| expired responses nginxp.cache.expired.responses (long counter) |
The number of expired responses not taken from the cache |
| expired responses size nginxp.cache.expired.bytes (long counter) (bytes) |
The number of expired bytes written to the cache |
| expired responses written nginxp.cache.expired.responses.written (long counter) |
The number of expired responses written to the cache |
| expired responses written size nginxp.cache.expired.bytes.written (long counter) (bytes) |
The number of expired bytes written to the cache |
| bypass responses nginxp.cache.bypass.responses (long counter) |
The number of bypass responses not taken from the cache |
| bypass responses size nginxp.cache.bypass.bytes (long counter) (bytes) |
The number of bypass bytes written to the cache |
| bypass responses written nginxp.cache.bypass.responses.written (long counter) |
The number of bypass responses written to the cache |
| bypass responses written size nginxp.cache.bypass.bytes.written (long counter) (bytes) |
The number of bypass bytes written to the cache |
| accepted connections nginxp.connections.accepted (long counter) |
The number of accepted client connections |
| dropped connections nginxp.connections.dropped (long counter) |
The number of idle client connections |
| active connections nginxp.connections.active (long gauge) |
The current number of active connections |
| idle connections nginxp.connections.idle (long gauge) |
The current number of idle client connections |
| total requests nginxp.requests (long counter) |
The total number of client requests |
| current active requests nginxp.requests.current (long gauge) |
The current number of client requests |
| zone total requests nginxp.zone.requests (long counter) |
The total number of client requests received from clients |
| processing requests nginxp.zone.requests.processing (long gauge) |
The number of client requests that are currently being processed |
| discarded requests nginxp.zone.requests.discarded (long counter) |
The number of requests completed without sending a response |
| received clients data nginxp.zone.traffic.rx.bytes (long counter) (bytes) |
Bytes received from clients |
| sent clients data nginxp.zone.traffic.tx.bytes (long counter) (bytes) |
Bytes sent to clients |
| 1xx responses nginxp.zone.responses.1xx (long counter) |
The number of responses with status codes 1xx |
| 2xx responses nginxp.zone.responses.2xx (long counter) |
The number of responses with status codes 2xx |
| 3xx responses nginxp.zone.responses.3xx (long counter) |
The number of responses with status codes 3xx |
| 4xx responses nginxp.zone.responses.4xx (long counter) |
The number of responses with status codes 4xx |
| 5xx responses nginxp.zone.responses.5xx (long counter) |
The number of responses with status codes 4xx |
| total responses nginxp.zone.responses (long counter) |
The total number of responses |
| status backup nginxp.upstream.server.backup (long gauge) |
A value indicating whether the server is a backup server |
| server weight nginxp.upstream.server.weight (long gauge) |
Weight of the server |
| state up nginxp.upstream.state.up (long counter) |
Server is up |
| state down nginxp.upstream.state.down (long counter) |
Server is down |
| state unavailable nginxp.upstream.state.unavailable (long counter) |
Server is unavailable |
| state unhealthy nginxp.upstream.state.unhealthy (long counter) |
Server is unhealthy |
| received data nginxp.upstream.traffic.rx.bytes (long counter) (bytes) |
The number of bytes sent to this server. |
| sent data nginxp.upstream.traffic.tx.bytes (long counter) (bytes) |
The number of bytes received from this server. |
| upstream check fails nginxp.upstream.checks.fail (long counter) |
The number of unsuccessful attempts to communicate with the server |
| upstream check unavailable nginxp.upstream.checks.unavailable (long counter) |
How many times the server became unavailable for client requests (state “unavail”) due to the number of unsuccessful attempts reaching the max_fails threshold |
| downtime nginxp.upstream.downtime (long counter) (ms) |
Total time the server was in the unavail/checking/unhealthy states |
| downstart nginxp.upstream.downstart (long gauge) (ms) |
The time (in milliseconds since Epoch) when the server became unavail/checking/unhealthy |
| total responses nginxp.upstream.responses (long counter) |
The total number of responses obtained from this server |
| 1xx responses nginxp.upstream.responses.1xx (long counter) |
The number of responses with status codes 1xx |
| 2xx responses nginxp.upstream.responses.2xx (long counter) |
The number of responses with status codes 2xx |
| 3xx responses nginxp.upstream.responses.3xx (long counter) |
The number of responses with status codes 3xx |
| 4xx responses nginxp.upstream.responses.4xx (long counter) |
The number of responses with status codes 4xx |
| 5xx responses nginxp.upstream.responses.5xx (long counter) |
The number of responses with status codes 5xx |
| upstream health checks nginxp.upstream.health.checks (long counter) |
The total number of health check requests made |
| upstream health fails nginxp.upstream.health.fails (long counter) |
The number of failed health checks |
| upstream unhealthy count nginxp.upstream.health.unhealthy (long gauge) |
How many times the server became unhealthy (state unhealthy) |
| upstream health last passed nginxp.upstream.health.passed (long gauge) |
Value indicating if the last health check request was successful and passed tests |
| active connections nginxp.upstream.connections.active (long gauge) |
The current number of active connections |
| keepalive connections nginxp.upstream.connections.keepalive (long gauge) |
The current number of idle keepalive connections |
| zombie connections nginxp.upstream.connections.zombies (long gauge) |
The current number of servers removed from the group but still processing active client requests |
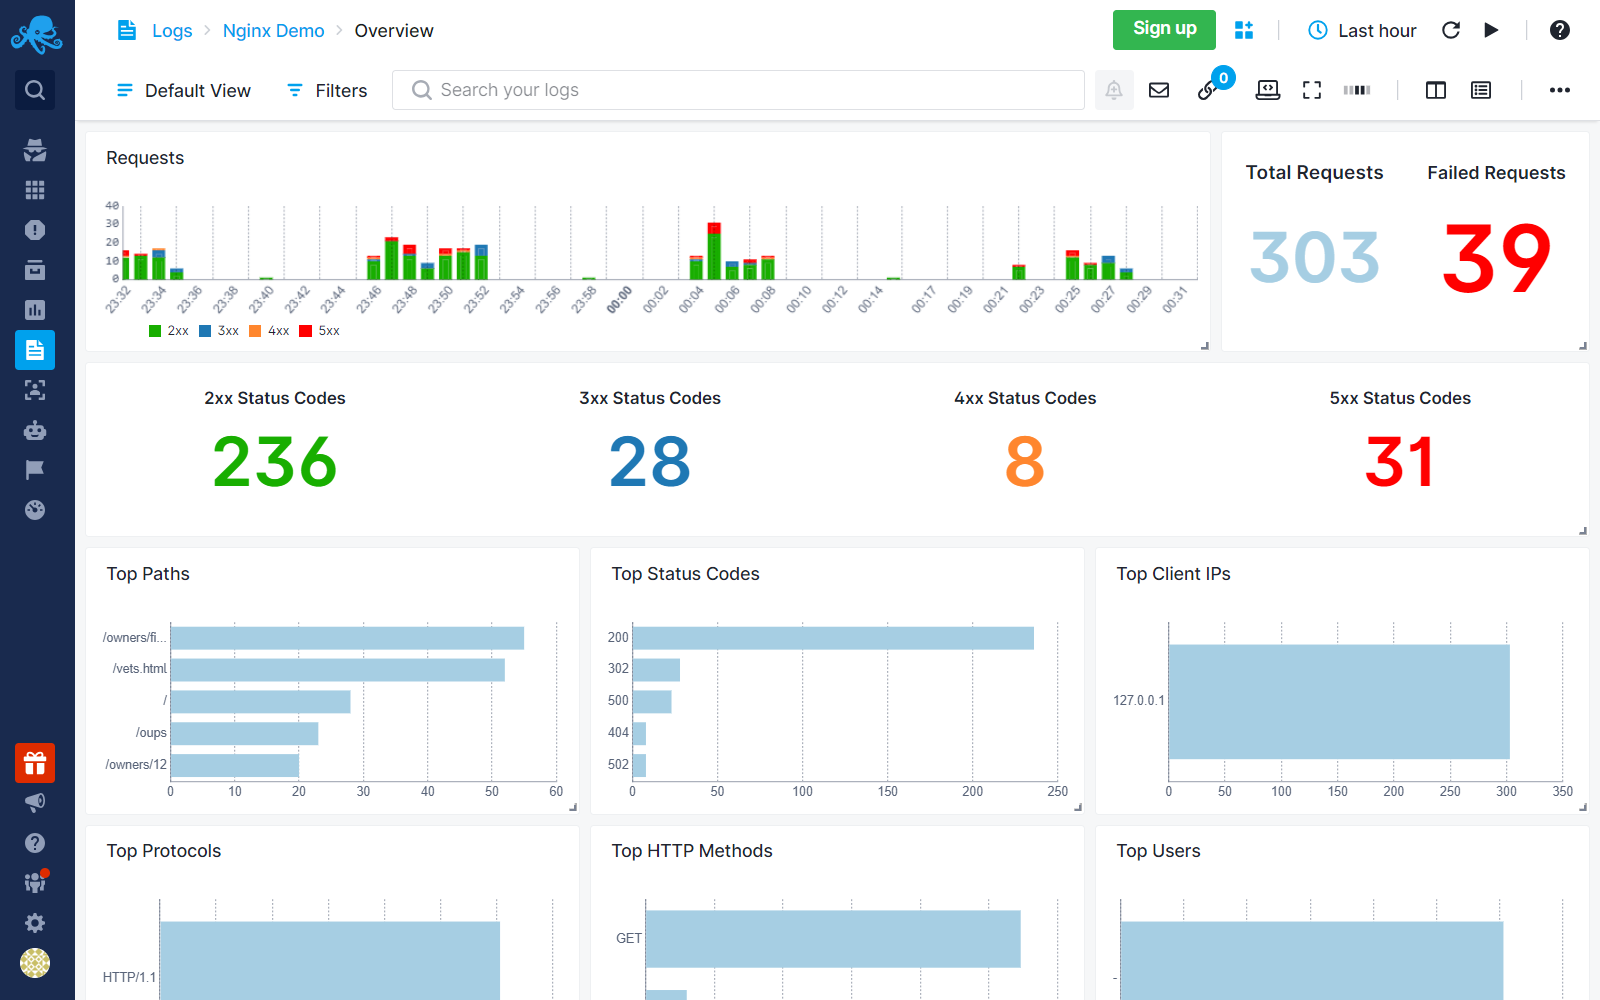
Logs
Once data is in, you can explore it via the built-in reports:
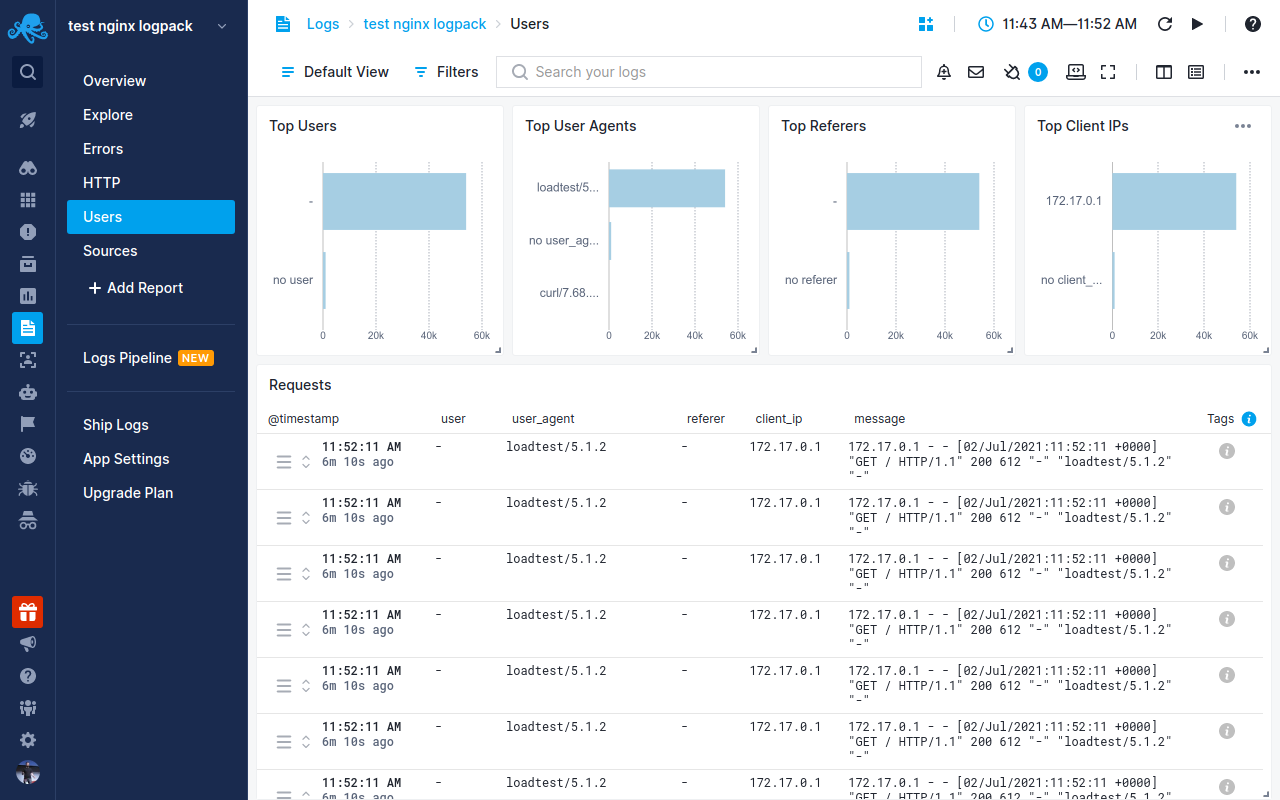
Exploring logs
Once data is in, you can explore it using the built-in reports or create your own. For example, you can use the Users report to check on where the requests are coming from:
Other built-in reports include:
- Errors: Logs specifically about errors. You can see which status codes are returned and which errors are logged by your Nginx server.
- HTTP: Logs about Nginx access logs. Use this report to view any and all data about HTTP requests and responses.
- Sources: Logs about Nginx source files. You can view where the logs are collected from and from where in the world users are accessing your Nginx server.
Troubleshooting
If you have trouble sending logs, try out the latest version of Sematext Agent. Also, make sure Sematext Agent is configured to send logs to your Nginx Logs App. If you're using Nginx in a container, make sure to configure it to output logs to the stdout/stderr streams. Last, check the Log Agents panel for any errors, and refer to our Sematext Logs FAQ for useful tips.
If you are having issues with Sematext Monitoring, i.e. not seeing Nginx metrics, see How do I create the diagnostics package.
For more troubleshooting information please look at Troubleshooting section.