OpenSearch
OpenSearch is a powerful, open-source search and analytics engine built for scalability, flexibility, and advanced data exploration capabilities. The Sematext Agent collects OpenSearch metrics and logs, transmits them to Sematext Cloud; installing the agent takes less than 5 minutes.
Install Sematext Agent
- Create an OpenSearch Logs or Monitoring App. This will let you install the agent and control access to your monitoring and logs data.
- Install the Sematext Agent according to the https://apps.sematext.com/ui/howto/Opensearch/overview displayed in the UI.
- After installing the agent, discovered logs or metrics from OpenSearch services detected on the host will start shipping automatically.
- If you've created an OpenSearch Monitoring App and want to collect OpenSearch logs as well, or vice versa, click on the Create Logs App button from the left menu panel. This will take you to the Create Logs App (or Monitoring App) page. When you select Use Existing Agent, all discovered log sources from OpenSearch services are listed, allowing you to set up log and metric shipping easily without any additional installation.
Having both OpenSearch Logs and Monitoring Apps lets you correlate performance metrics and logs, and accelerate troubleshooting using Split Screen for faster resolution. For example, if you see logs of a node restarting, metrics let you see the impact on the rest of the cluster in terms of CPU, GC, and other metrics. Including query time metrics, even if you don't collect slowlogs from [all] queries.
To explore logs and services across multiple hosts, navigate to Fleet & Discovery > Discovery > Services (or Sematext Cloud Europe). From there, you can create additional Apps or stream data to existing ones without requiring any additional installations.
Important Metrics to Watch and Alert on
OpenSearch specific metrics
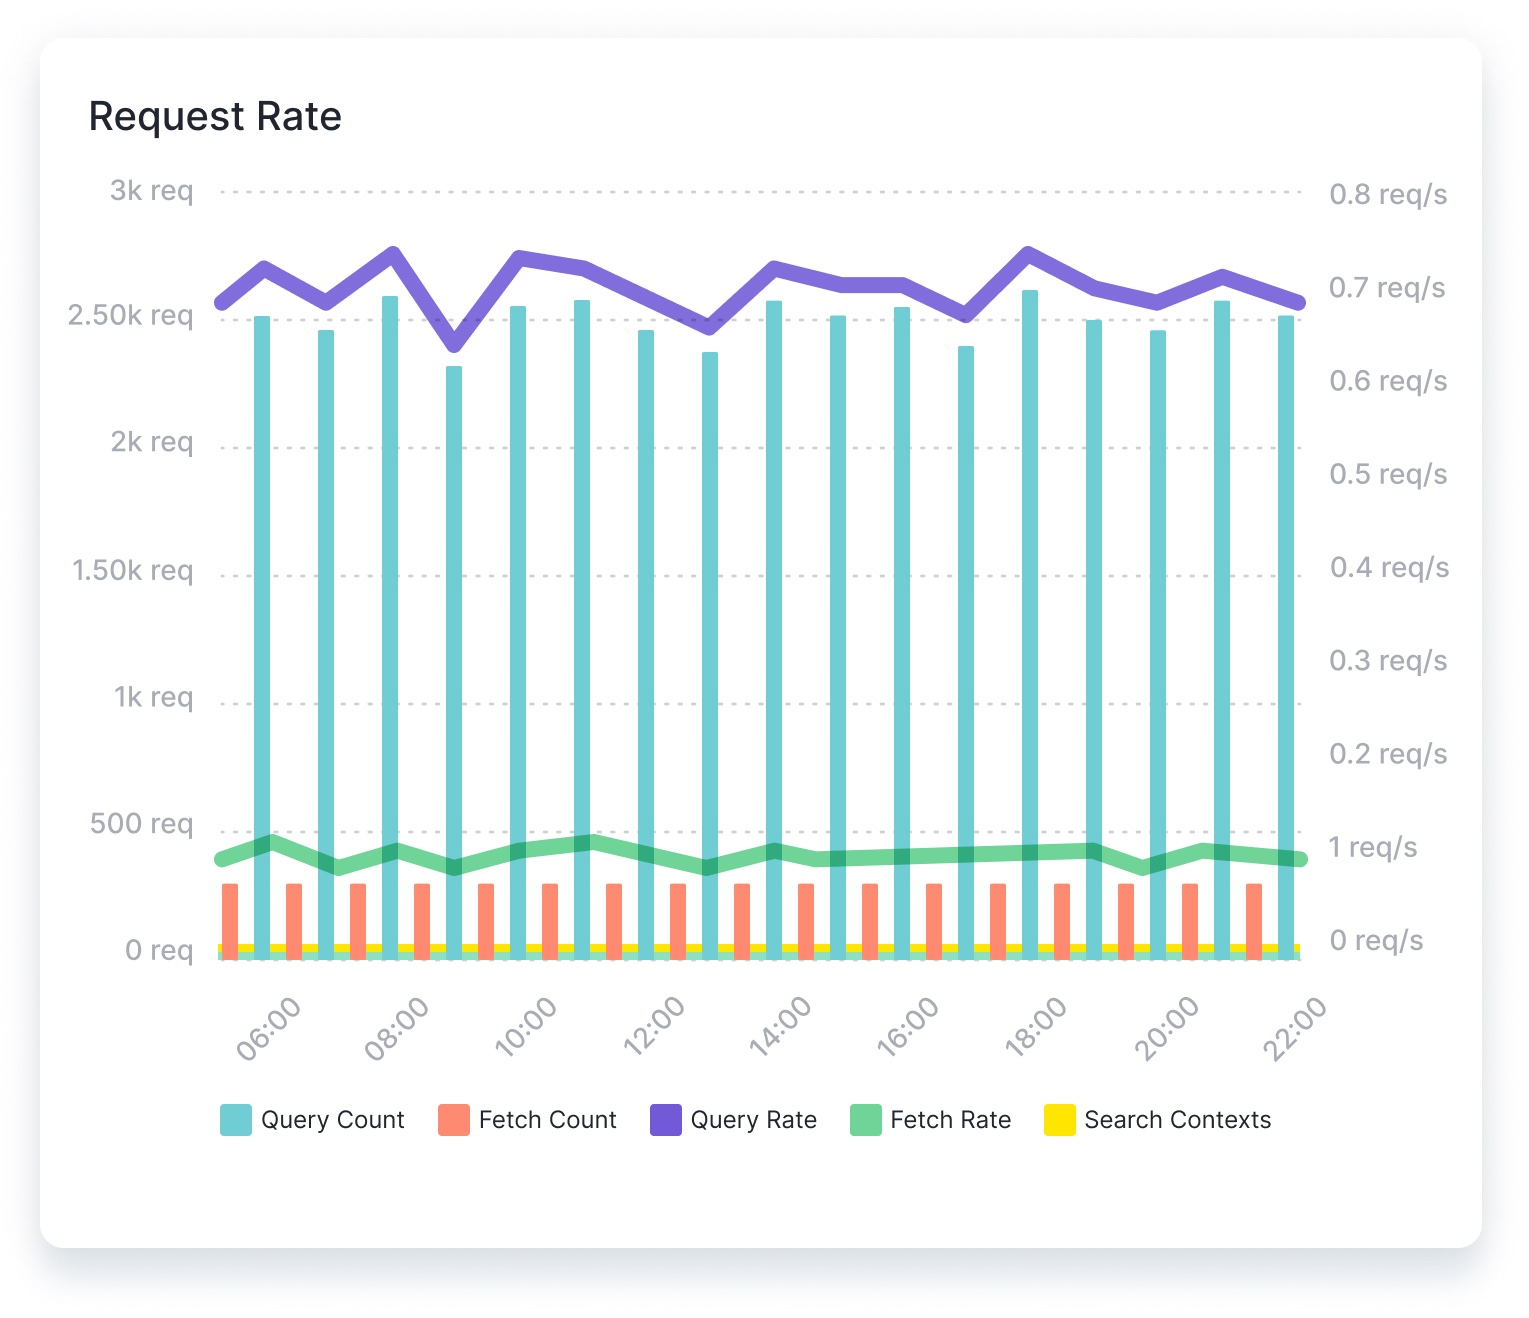
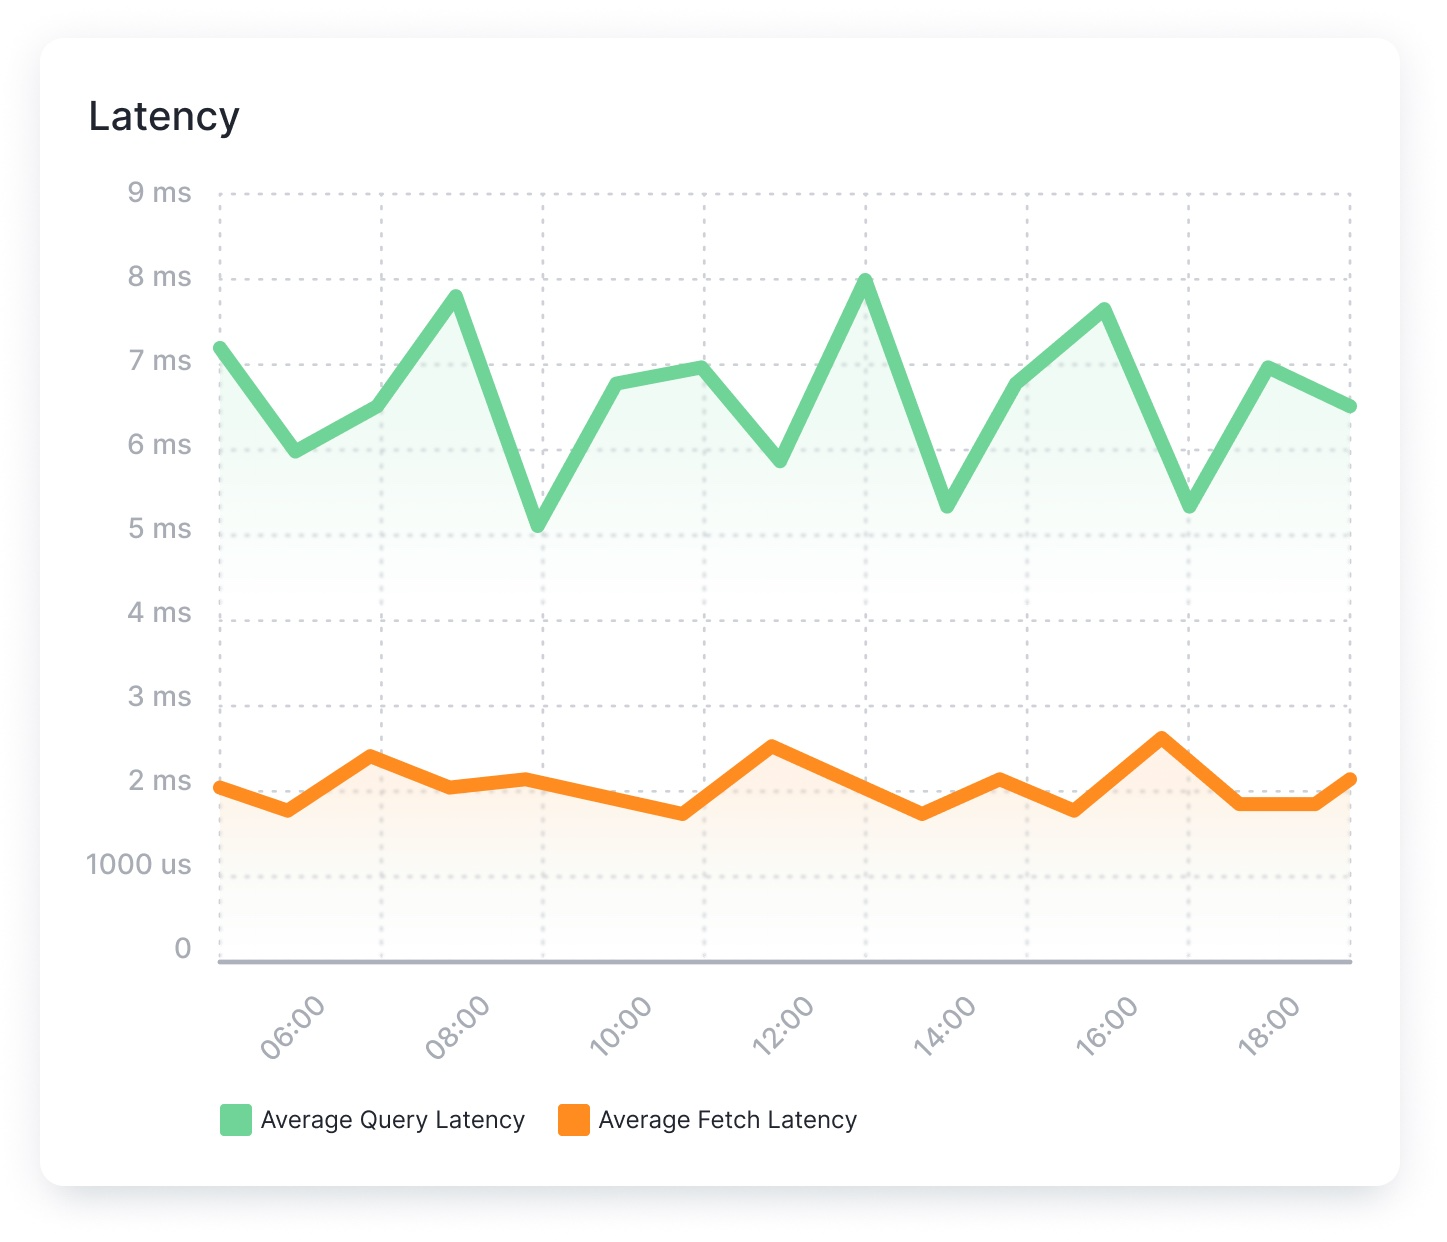
Search Query performance metrics: Request Rate and Latency
When the cluster receives a request, it may need to access data from multiple shards, across multiple nodes. Knowing the rate at which the system is processing and returning requests, how many requests are currently in progress, and how long requests are taking can provide valuable insights into the health and performance of the OpenSearch cluster.
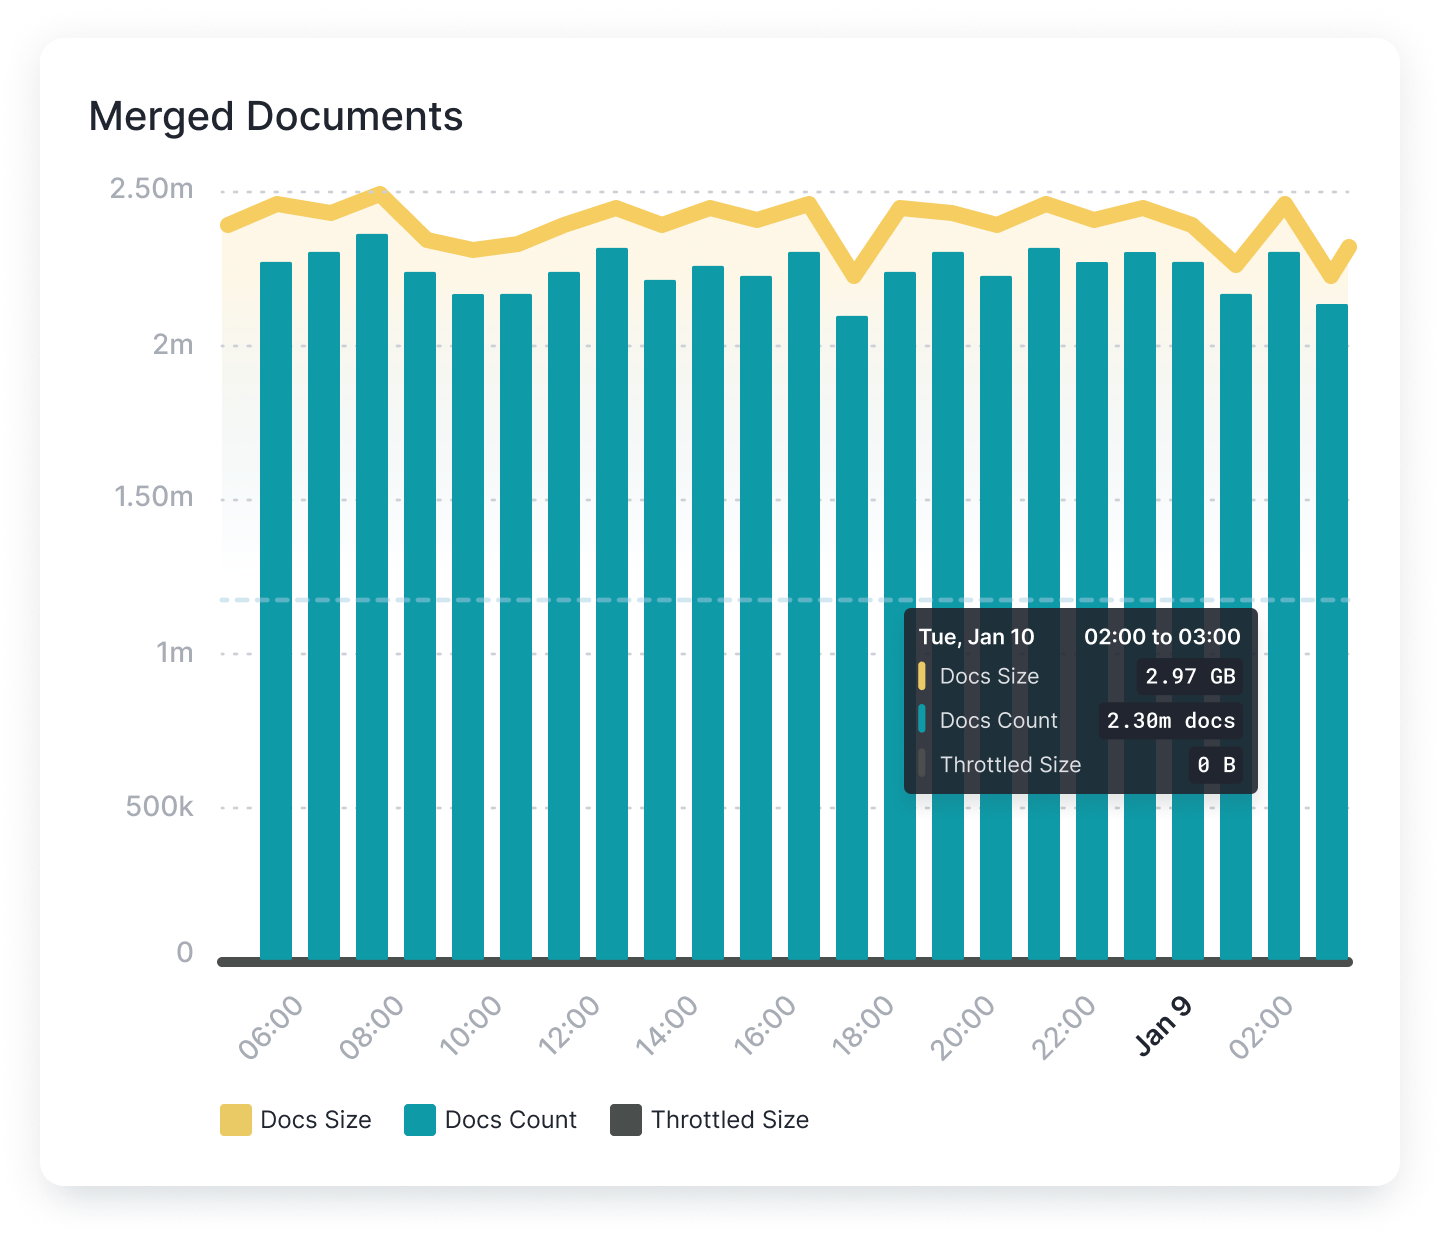
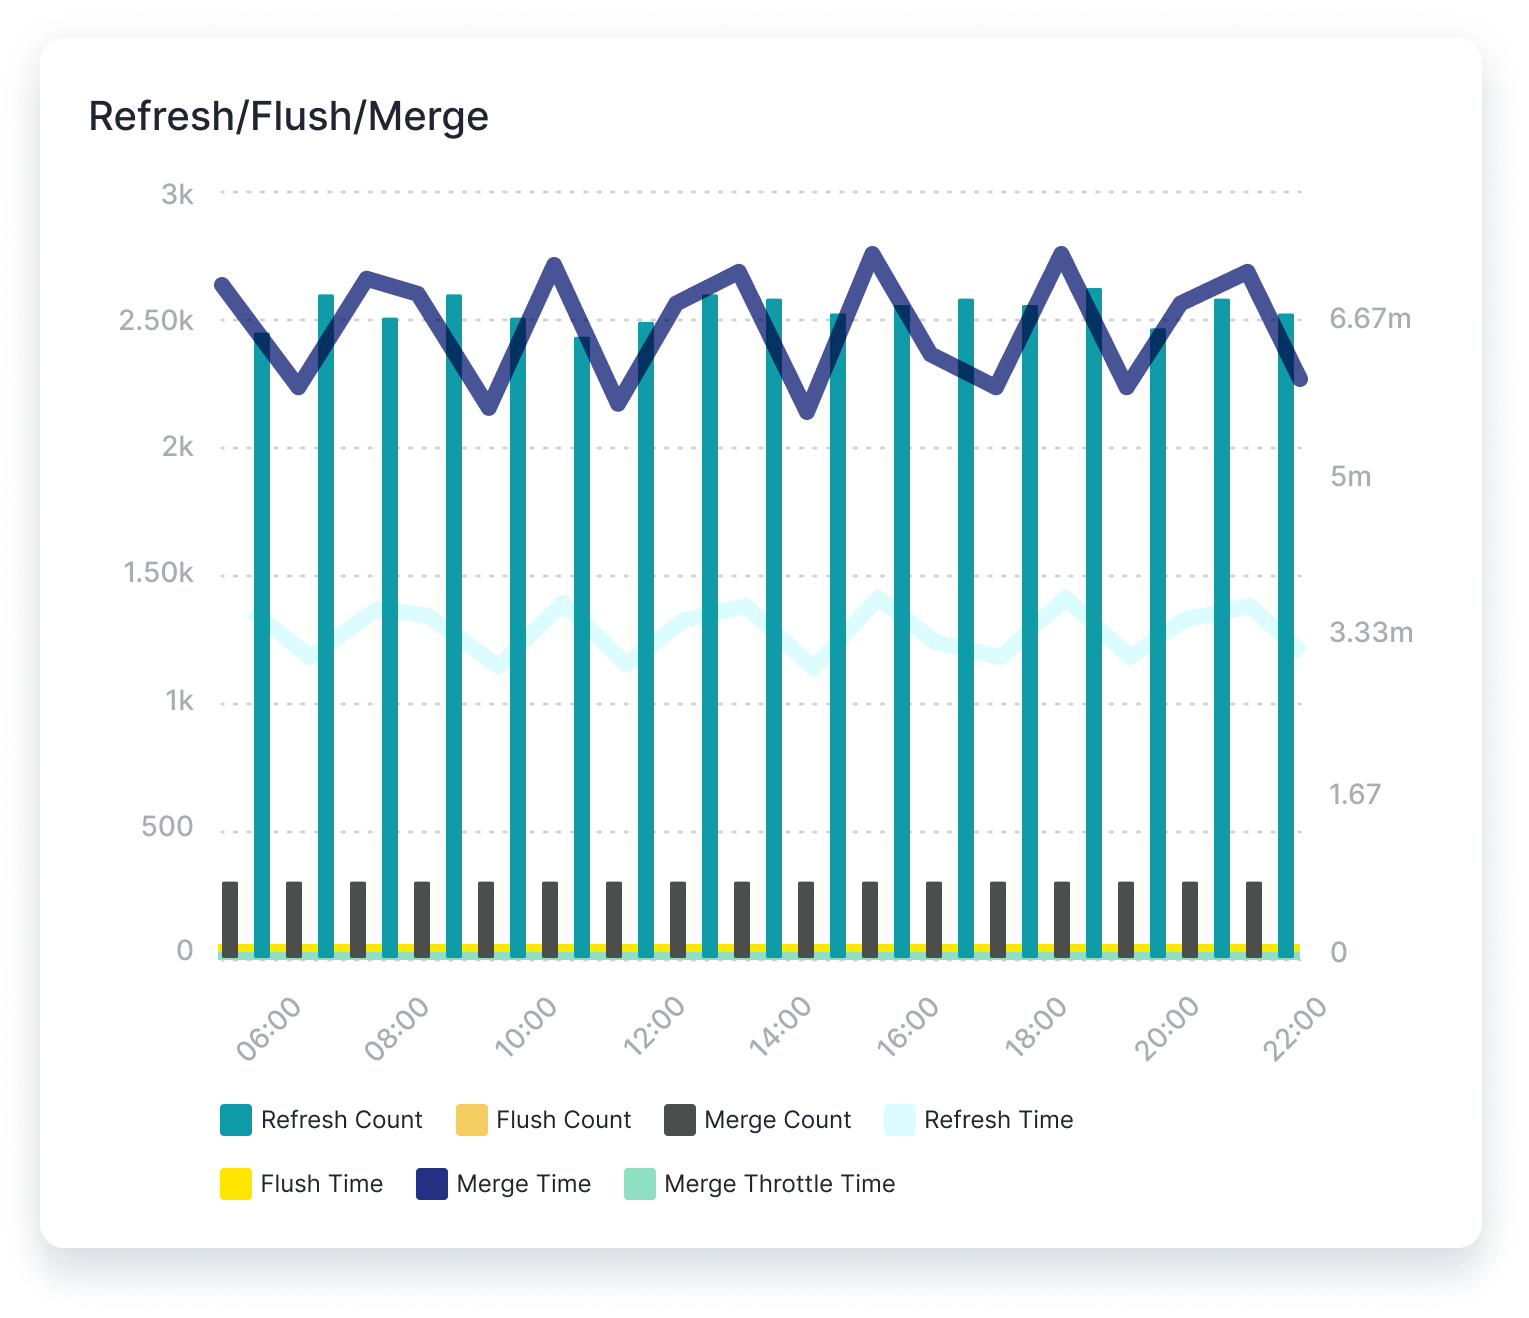
Indexing Rate and Merge Times
Monitoring the OpenSearch document indexing rate and merge time can help detect anomalies and related problems before they begin to affect the performance of the cluster. Considering these metrics in parallel with the health of each node can provide essential clues to potential problems within the system, or opportunities to optimize performance.
System and JVM Metrics
OS metrics like CPU, memory, disk I/O, and network play an essential role in OpenSearch monitoring.
OpenSearch runs within a Java Virtual Machine (JVM) and monitoring JVM heap usage is critical to ensure cluster performance. Moreover, JVM supports garbage collection, which means that garbage collection frequency and duration are just as important to measure.
Finally, high disk reads and writes can indicate a poorly tuned system. Since accessing the disk is an expensive process in terms of time, a well-tuned system should reduce disk I/O wherever possible.
OpenSearch Default Alerts
As soon as you create an OpenSearch App, you will receive a set of default alert rules. These pre-configured rules will notify you of important events that may require your attention, as shown below.
Node count anomaly
This alert rule continuously monitors the count of nodes in an OpenSearch cluster, detecting anomalies in the number of nodes present within the cluster. When anomalies are detected, it triggers a warning (WARN priority). The minimum delay between consecutive alerts triggered by this alert rule is set to 10 minutes.
Suppose an OpenSearch cluster typically maintains a stable number of nodes, but due to various factors such as node failures, scaling activities, or network issues, the node count experiences sudden changes. When this happens, the alert rule checks for anomalies in the count of nodes over the last 90 minutes. Upon detecting the anomaly, the alert rule triggers a warning.
Actions to take
- Check the status of nodes within the OpenSearch cluster for any nodes that may be offline, unavailable, or experiencing issues
- Check the logs of the node that went down and/or logs of the master node
- If node failures are detected, you may need to restart failed nodes or replace hardware
- If the node count changes due to scaling activities (e.g., adding or removing nodes), review the recent scaling events to confirm that they are intentional and expected
- Monitor network connectivity between nodes within the OpenSearch cluster for any network issues that may be affecting communication and node discovery
Java old gen usage > 97%
This alert rule continuously monitors the usage of Java's old generation heap memory in an OpenSearch environment, triggering a warning if the usage exceeds 97%. Note that this shouldn't happen in a healthy environment. It's likely that the node will either face an out of memory exception or run into the Parent Circuit Breaker. Either way, you'd have unexpected failures. The minimum delay between consecutive alerts triggered by this alert rule is set to 10 minutes.
Suppose the Java old generation heap memory usage in the OpenSearch environment starts increasing and eventually exceeds 97% over a 5-minute period.
Actions to take
- Analyze the application's memory usage patterns for any memory leaks
- Review and optimize the Java Virtual Machine (JVM) configuration, including heap size settings, garbage collection algorithms, and memory management parameters
- Monitor system resources, including memory, CPU, and disk I/O, and consider scaling them up if necessary
- Investigate recent application changes, updates, or deployments that may have contributed to the spike in memory usage
Field data size
This alert rule continuously monitors the field data size in an OpenSearch cluster and triggers a warning if the field data size exceeds a certain threshold (20 in this case). The minimum delay between consecutive alerts triggered by this alert rule is set to 10 minutes.
Significant field data usage points to a misconfiguration. Normally, you'd only use field data for global ordinals. If you're using >20%, you probably do sorting/aggregations on a text field with field data enabled. Which is dangerous (you may run out of heap on an expensive query). So you'd want to pre-process the data in the pipeline before OpenSearch and do your sorting/aggregations on doc_values instead.
Actions to take
- Check _cat/fielddata, it will tell you which fields use more field data
- Consider scaling up the resources allocated to the OpenSearch cluster, such as increasing the JVM heap size, to accommodate the increased field data size
Tripped parent circuit breaker
This alert rule continuously monitors the tripping of the parent circuit breaker in an OpenSearch cluster, detecting instances where the circuit breaker has been triggered usually due to very high memory usage (for real memory, current default is 95% of JVM heap). When such instances are detected, it triggers a warning (WARN priority). The minimum delay between consecutive alerts triggered by this alert rule is set to 10 minutes.
Suppose an OpenSearch cluster experiences a sudden increase in query load or indexing throughput, leading to very high memory usage and triggering the parent circuit breaker. When this happens, the alert rule checks for instances of the parent circuit breaker being tripped over the last 5 minutes. The alert is triggered as soon as the circuit breaker is tripped at least once within the specified timeframe.
Actions to take
- Analyze resource usage metrics for the OpenSearch cluster, including CPU, memory, and disk utilization, to find the source of the increased load
- Review and optimize search queries or indexing operations that may be contributing to the increased load on the cluster. Consider optimizing query performance, reducing indexing throughput
- Consider scaling up the resources allocated to the OpenSearch cluster, such as increasing the JVM heap size and number of nodes
Unassigned shards anomaly
This alert rule continuously monitors the presence of unassigned shards in an OpenSearch cluster, detecting anomalies in the number of unassigned shards over time. When anomalies are detected, it triggers a warning (WARN priority). The minimum delay between consecutive alerts triggered by this alert rule is set to 10 minutes.
Suppose an OpenSearch cluster typically maintains a low number of unassigned shards, but due to issues such as node failures or disk space constraints, the number of unassigned shards suddenly increases. When this happens, the alert rule checks for anomalies in the number of unassigned shards over the last 30 minutes. Upon detecting the anomaly, the alert rule triggers a warning.
Actions to take
- Check the status of OpenSearch nodes to determine if any nodes are experiencing issues or are offline
- Review disk space on OpenSearch nodes to see if there is sufficient space available for shard allocation
- Review shard allocation settings in the OpenSearch cluster configuration to make sure that shards are allocated properly and evenly across nodes
- Recover unassigned shards and allocate them to available nodes in the cluster
Thread pool rejections anomaly
This alert rule continuously monitors thread pool rejections in an OpenSearch environment, detecting anomalies in the rate at which thread pool requests are rejected. When anomalies are detected, it triggers a warning (WARN priority). The minimum delay between consecutive alerts triggered by this alert rule is set to 10 minutes.
Suppose an OpenSearch cluster experiences a sudden increase in thread pool rejections, potentially due to resource limitations or high query loads. When this happens, the alert rule checks for anomalies in thread pool rejections over the last 90 minutes. Upon detecting the anomaly, the alert rule triggers a warning.
Actions to take
- Review system metrics for the OpenSearch cluster, including CPU, memory, and disk usage, for any resource constraints that may be contributing to thread pool rejections
- Analyze query patterns for any inefficient or resource-intensive queries. Optimize queries to reduce the load on the cluster (only applies for the search thread pool)
- Check the calling applications and use fewer threads to talk to OpenSearch
Used memory > 80%
This alert rule continuously monitors memory usage in an OpenSearch environment and triggers a warning (WARN priority) when the used memory exceeds 80% of the total available memory. The minimum delay between consecutive alerts triggered by this alert rule is set to 10 minutes.
If the heap size is set too high in the OpenSearch configuration, it might lead to excessive memory usage. In such cases, when the heap memory usage goes over 80% of the total available memory, the alert rule checks memory usage over the last hour. Upon crossing the threshold, the alert rule triggers a warning.
Actions to take
- Review and optimize the configuration settings of the OpenSearch cluster, including heap size allocation
Swap usage
This alert rule continuously monitors swap usage in an OpenSearch environment by tracking the rate of swap input/output operations. When any amount of swap usage is detected, it triggers a warning (WARN priority). This includes even the slightest swap activity, such as reading or writing a single byte to or from swap space.
The minimum delay between consecutive alerts triggered by this alert rule is set to 10 minutes.
Suppose there is some activity detected in the swap usage on a node in the OpenSearch cluster. Despite the relatively small amount of swap activity, the alert rule triggers a warning to prevent any big (and potentially unacceptable) slowdowns in OpenSearch caused by accessing swap memory.
Action to take
- Turn off swap usage
Open files > 85%
This alert rule continuously monitors the percentage of open files in an OpenSearch cluster. When the percentage exceeds 85% within the specified timeframe, it triggers a warning (WARN priority). The minimum delay between consecutive alerts triggered by this alert rule is set to 10 minutes.
Suppose an OpenSearch cluster typically operates with a healthy percentage of open files, but due to increased usage or resource limitations, the percentage of open files exceeds 85%. When this happens, the alert rule checks for instances where the percentage of open files exceeds 85% within the last 10 minutes and triggers a warning.
Actions to take
- Verify and adjust open file limits for OpenSearch processes. The default open file limit for most systems is 65,536
- If the open file limit is approaching the recommended threshold, check unusual merge policies or a large number of very small shards
- A high percentage of open files usually signals a misconfiguration. Review OpenSearch cluster configuration settings and consider optimizing resource allocation and file management settings to better handle file usage and prevent excessive file opening
Load average
This alert rule continuously monitors the load average of an OpenSearch cluster and triggers a warning when the load average exceeds a specified threshold (currently when load average is more than 2). The minimum delay between consecutive alerts triggered by this alert rule is set to 10 minutes.
Suppose the average load on the OpenSearch cluster typically remains below 2, but due to increased query loads or resource constraints, the load average spikes above 2. When this happens, the alert rule checks for load average values over the last 30 minutes. Upon detecting the load average anomaly, the alert rule triggers a warning.
Actions to take
- Review thread pools, indexing and search operations, heap usage, etc.
- Review and optimize queries or indexing processes that may be contributing to the increased load on the cluster
- If the increased load is due to resource limitations, consider scaling up resources such as CPU or memory
You can create additional alerts on any metric.
Metrics
| Metric Name Key (Type) (Unit) |
Description |
|---|---|
| outgoing searches adaptiveReplicaSelection.searches.outgoing (long gauge) |
Searches from the monitored node to the remote node |
| average queue size adaptiveReplicaSelection.queue.size.avg (double gauge) |
Exponentially weighted moving average queue size for searches on the remote node |
| average service time adaptiveReplicaSelection.service.time.avg (long gauge) (ns) |
Exponentially weighted moving average task execution time on the remote node |
| average response time adaptiveReplicaSelection.response.time.avg (long gauge) (ns) |
Exponentially weighted moving average response time on the remote node |
| rank adaptiveReplicaSelection.rank (double gauge) |
Rank of the remote node used for replica selection |
| inFlightRequests max size circuitBreaker.inFlightRequests.size.max (long gauge) (bytes) |
Max in-flight requests size |
| inFlightRequests estimated size circuitBreaker.inFlightRequests.size.estimate (long gauge) (bytes) |
Estimated in-flight requests size |
| inFlightRequests overhead circuitBreaker.inFlightRequests.size.overhead (double gauge) |
In-flight requests overhead |
| inFlightRequests tripped circuitBreaker.inFlightRequests.tripped (counter) |
In-flight requests circuit breaker tripped |
| nodes cluster.nodes (long gauge) |
Number of nodes in the cluster |
| data nodes cluster.nodes.data (long gauge) |
Number of data nodes in the cluster |
| active primary shards cluster.health.shards.active.primary (long gauge) |
Number of active primary shards |
| active shards cluster.health.shards.active (long gauge) |
Number of active shards |
| relocating shards cluster.health.shards.relocating (long gauge) |
Number of currently relocating shards |
| unassigned shards cluster.health.shards.unassigned (long gauge) |
Number of currently unassigned shards |
| pending tasks cluster.health.pendingTasks.total (long gauge) |
Number of currently pending tasks in master's queue |
| pending tasks max waiting time cluster.health.pendingTasks.maxQueueTime (long gauge) (ms) |
Maximum time for a task in master's queue |
| open TCP conns connection.tcp.server.open (long gauge) |
Open TCP conns (server_open) |
| network received packets transport.rx.packets (counter) |
Network received packets count (rx_count) |
| network received size transport.rx.bytes (counter) (bytes) |
Network received size (rx_size) |
| network transmitted packets transport.tx.packets (counter) |
Network transmitted packets count (tx_count) |
| network transmitted size transport.tx.bytes (counter) (bytes) |
Network transmitted size (tx_size) |
| cluster state incompatible diff updates cluster.state.published.diff.incompatible (counter) |
Cluster state incompatible diff updates published |
| cluster state compatible diff updates cluster.state.published.diff.compatible (counter) |
Cluster state compatible diff updates published |
| docs count index.docs.total (long gauge) |
Docs count on all (primary and replica) shards |
| docs deleted index.docs.deleted.total (long gauge) |
Docs deleted on all (primary and replica) shards |
| ingest calls ingest.calls.total (counter) |
Number of calls to this pipeline |
| ingest failures ingest.calls.errors (counter) |
Number of failed calls to this pipeline |
| ingest time ingest.time (counter) (ms) |
Time spent in this pipeline |
| read ops disk.io.operations.read (counter) |
Disk IO read operations |
| write ops disk.io.operations.write (counter) |
Disk IO write operations |
| gc collection count gc.collection.count (counter) |
Count of GC collections |
| gc collection time gc.collection.time (counter) (ms) |
Duration of GC collections |
| heap_used heap.used (gauge) (bytes) |
JVM heap used memory |
| heap.committed heap.committed (gauge) (bytes) |
JVM heap committed |
| non_heap_used nonheap.used (gauge) (bytes) |
JVM non-heap used memory |
| non_heap_committed nonheap.committed (gauge) (bytes) |
JVM non-heap committed |
| open files files.open (gauge) |
JVM currently open files |
| max open files files.max (gauge) |
JVM max open files limit |
| used pool.used (gauge) (bytes) |
JVM pool used memory |
| max pool.max (gauge) (bytes) |
JVM pool max memory |
| thread count threads (gauge) |
JVM thread count |
| peak thread count threads.peak (gauge) |
Peak JVM thread count |
| merge count indexing.merges.total (counter) |
Merge count on all (primary and replica) shards |
| merge time indexing.merges.time.total (counter) (ms) |
Merge time on all (primary and replica) shards |
| merged docs count indexing.merges.docs.total (counter) |
Merged docs count on all (primary and replica) shards |
| merged docs size indexing.merges.docs.size.total (counter) (bytes) |
Merged docs size on all (primary and replica) shards |
| throttled merge time indexing.merges.throttled.time.total (counter) (ms) |
Throttled time for merges (i.e. when merges fall behind) on all (primary and replica) shards |
| throttled merge size indexing.merges.throttled.size.total (counter) (bytes) |
Size of throttled merges on all (primary and replica) shards |
| field cache evictions cache.field.evicted (counter) |
Field cache evictions |
| field cache size cache.field.size (long gauge) |
Field cache size |
| number of processors cpu.allocated.count (long gauge) |
Number of processors allocated to the OpenSearch process |
| refresh count indexing.refreshes.total (counter) |
Refresh count on all (primary and replica) shards |
| refresh time indexing.refreshes.time.total (counter) (ms) |
Refresh time on all (primary and replica) shards |
| script compilations script.compilations.total (counter) |
Script compilations (use params in scripts to reduce them) |
| script cache evictions script.cache.evictions (counter) |
Script cache evictions |
| script compilations limit triggered script.compilations.limitTriggered (counter) |
Script compilations circuit breaker triggered (see script.max_compilations_rate setting) |
| query count query.count.total (counter) |
Query count on all (primary and replica) shards |
| query latency query.latency.time.total (counter) (ms) |
Query latency on all (primary and replica) shards |
| fetch count fetch.count.total (counter) |
Fetch count on all (primary and replica) shards |
| fetch latency fetch.latency.time.total (counter) (ms) |
Fetch latency on all (primary and replica) shards |
| suggest count suggest.count.total (counter) |
Suggest count on all (primary and replica) shards |
| suggest latency suggest.latency.time.total (counter) (ms) |
Suggest latency on all (primary and replica) shards |
| scroll count scroll.count.total (counter) |
Scroll count on all (primary and replica) shards |
| scroll latency scroll.latency.time.total (counter) (ms) |
Scroll latency on all (primary and replica) shards |
| search open contexts search.opencontexts.total (long gauge) |
Open search contexts on all (primary and replica) shards |
| avg. query latency query.latency.total.avg (gauge) (ms) |
Avg. query latency on all (primary and replica) shards |
| segments count segments.count.total (long gauge) |
Number of segments |
| segments memory segments.memory.total (long gauge) (bytes) |
Total memory for segment-related data structures |
| terms memory segments.memory.terms (long gauge) (bytes) |
Memory used by the terms dictionary |
| stored fields memory segments.memory.storedFields (long gauge) (bytes) |
Memory used by stored fields |
| term vectors memory segments.memory.termVectors (long gauge) (bytes) |
Memory used by term vectors |
| norms memory segments.memory.norms (long gauge) (bytes) |
Memory used by (length) norms |
| points memory segments.memory.points (long gauge) (bytes) |
Memory used by point fields (includes numeric, date, geo) |
| doc values memory segments.memory.docValues (long gauge) (bytes) |
Memory used by doc values |
| indexing buffer memory segments.memory.indexWriter (long gauge) (bytes) |
Memory used by the IndexWriter |
| version map memory segments.memory.versionMap (long gauge) (bytes) |
Memory used by the version map |
| fixed bitset memory segments.memory.fixedBitSet (long gauge) (bytes) |
Memory used by the fixed bitset that speeds up nested queries/aggregations |
| unassigned shards cluster.shards.unassigned (long gauge) |
Number of unassigned shards |
| active shards cluster.shards.active (long gauge) |
Number of active shards |
| active primary shards cluster.shards.active.primary (long gauge) |
Number of active primary shards |
| initializing shards cluster.shards.initializing (long gauge) |
Number of initializing shards |
| relocating shards cluster.shards.relocating (long gauge) |
Number of relocating shards |
| active threads thread.pool.active (long gauge) |
Active threads |
| thread pool size thread.pool.size (long gauge) |
Thread pool size |
| thread pool queue thread.pool.queue (long gauge) |
Thread pool queue |
| thread pool queue size thread.pool.queue.size (long gauge) |
Thread pool queue size |
| rejected threads thread.pool.rejected (counter) |
Rejected threads |
| thread pool largest thread.pool.largest (long gauge) |
Thread pool largest |
| completed threads thread.pool.completed (counter) |
Complete threads |
| thread pool min thread.pool.min (long gauge) |
Thread pool min |
| thread pool max thread.pool.max (long gauge) |
Thread pool max |
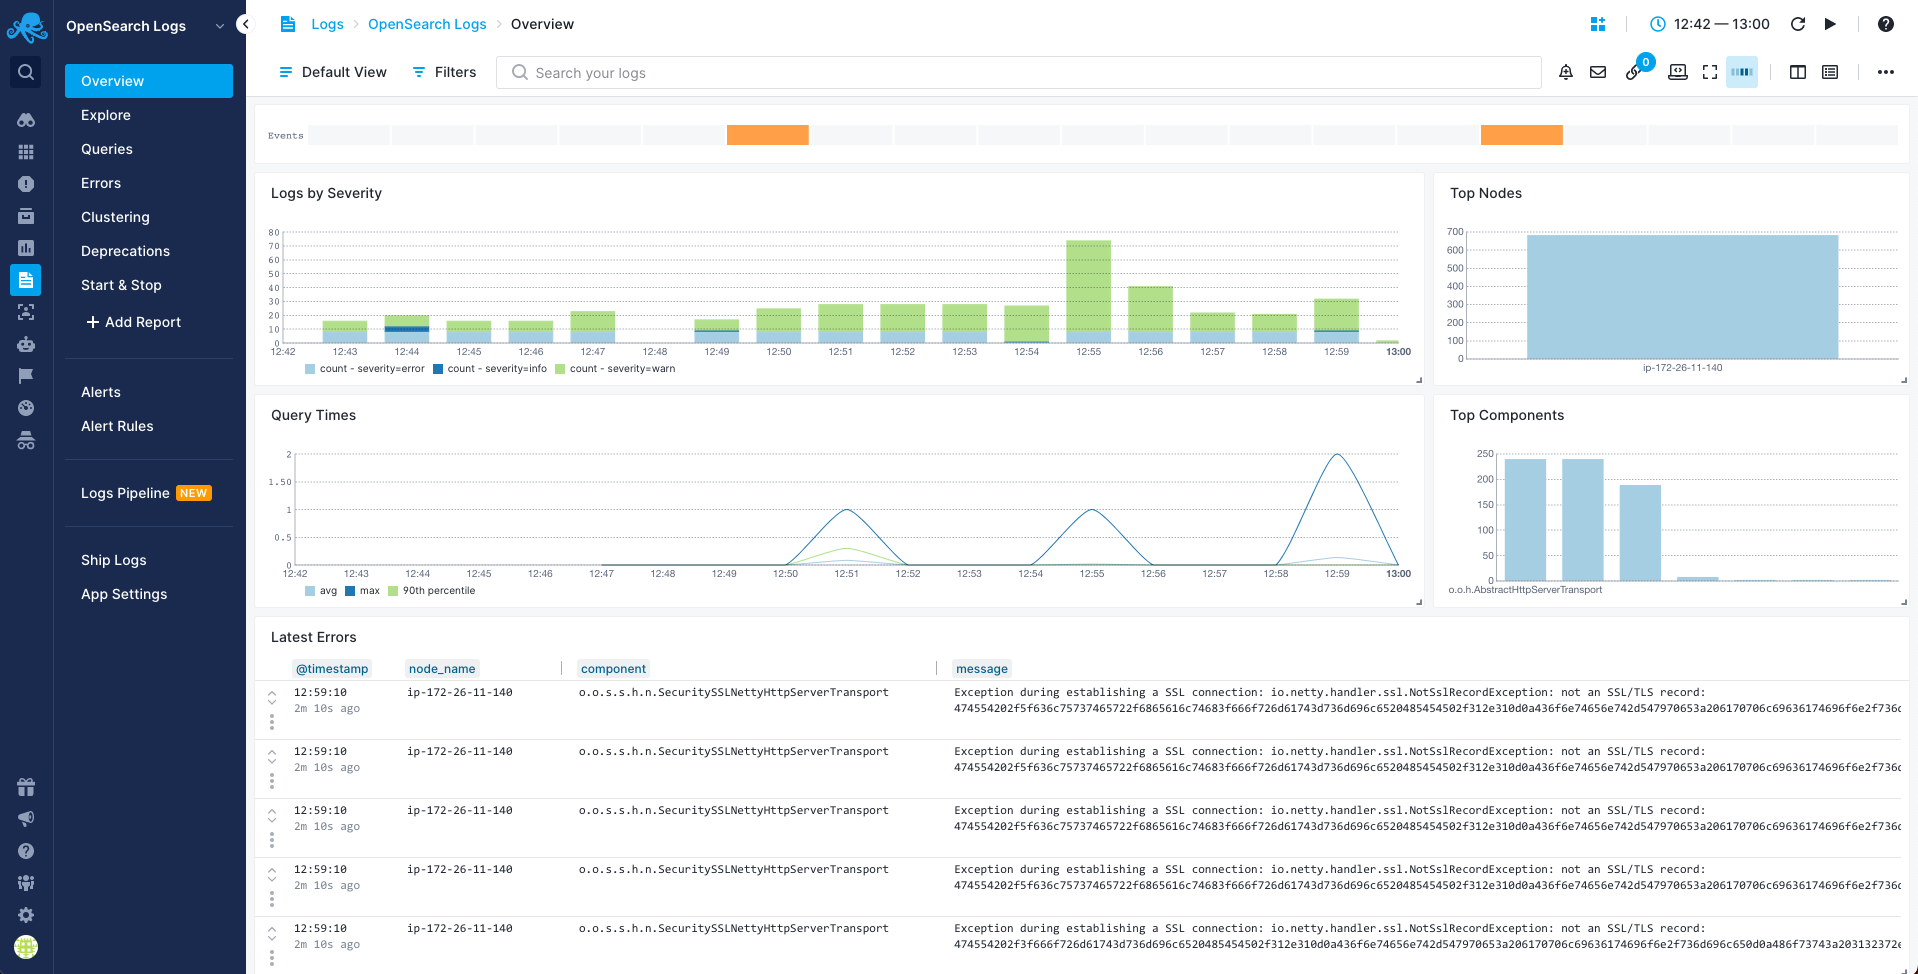
Logs
Once data is in, you can explore it via the built-in reports or create your own:
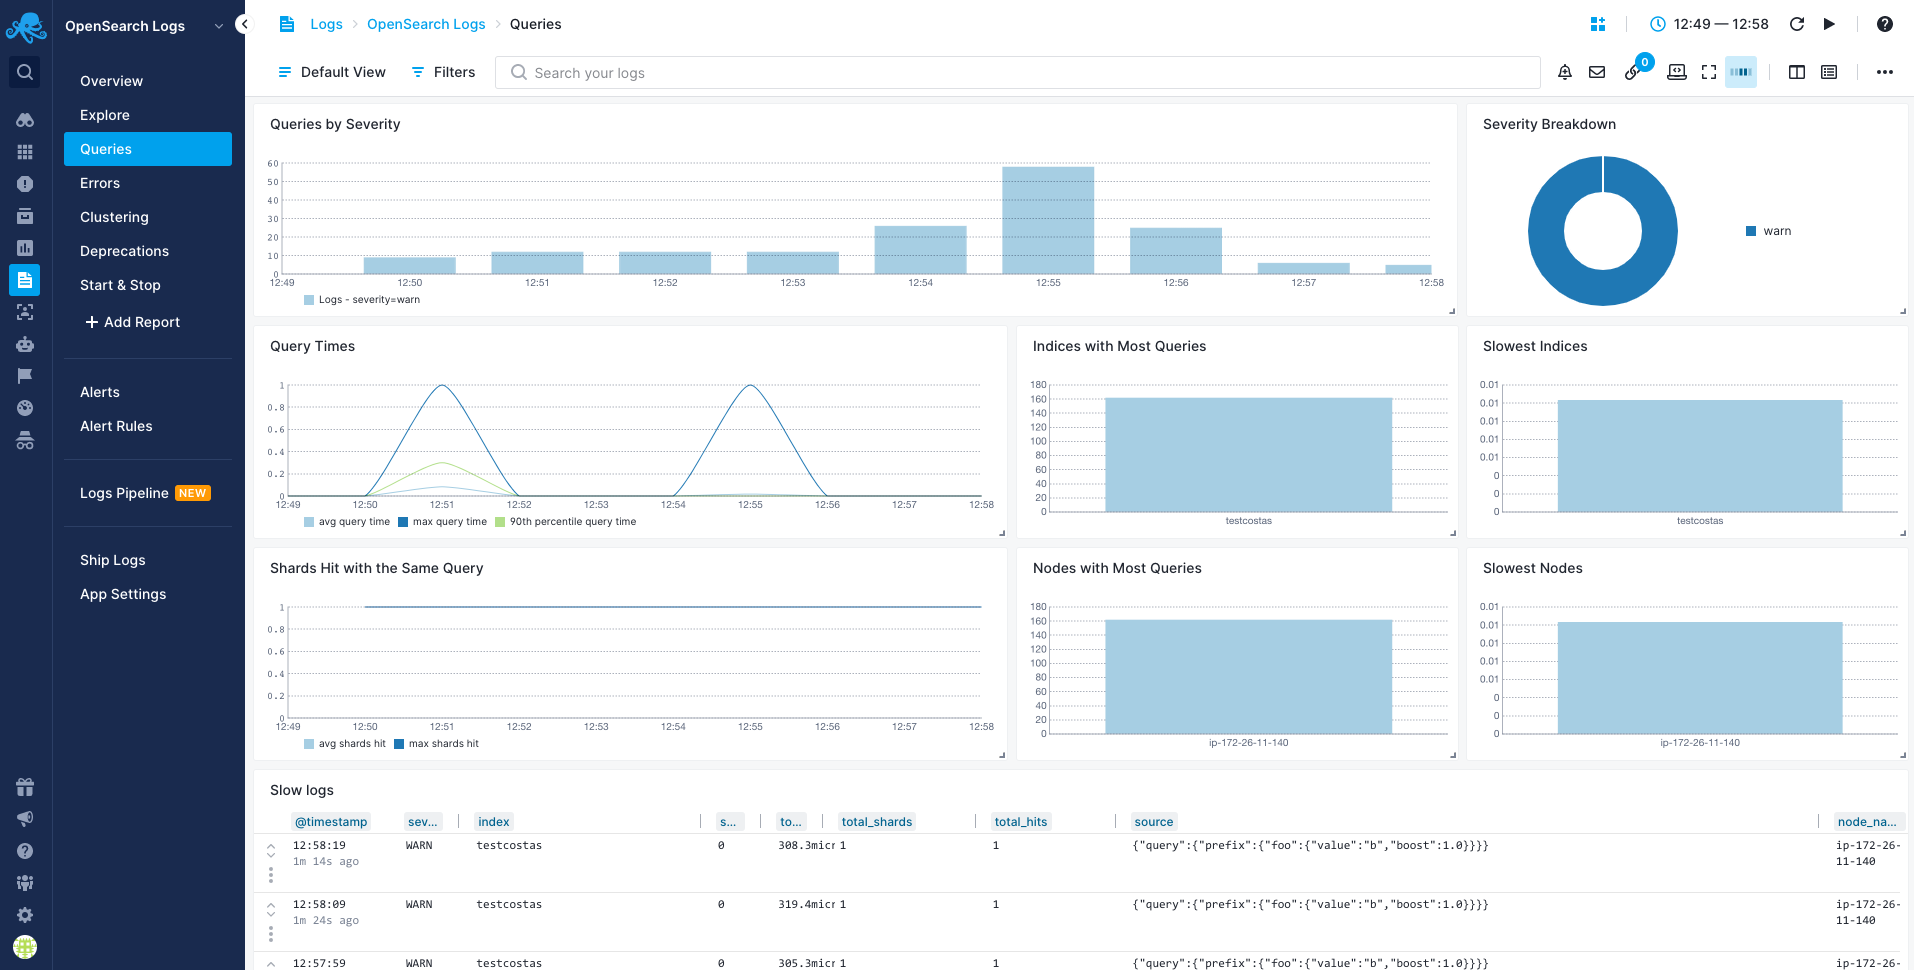
Queries Report
You can use the Queries report to see a breakdown of your queries and "zoom in" to the ones you're interested in:
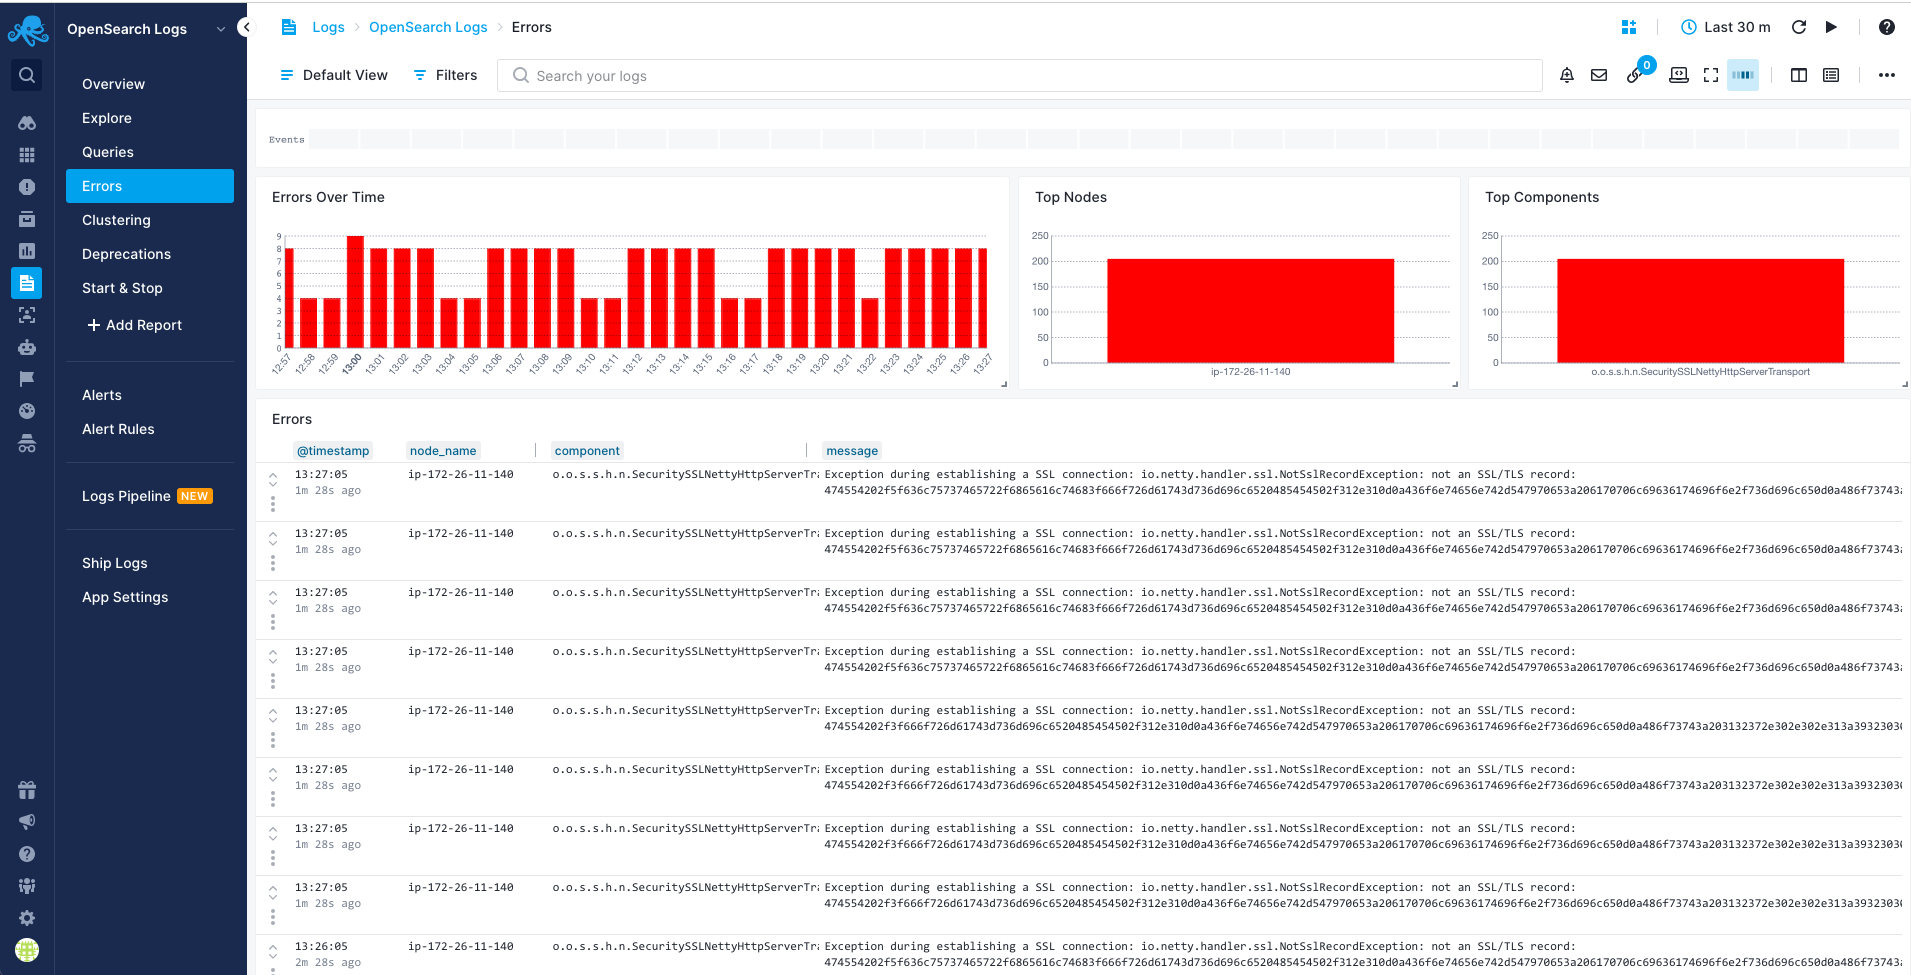
Errors Report
You can use the Errors report to see breakdown of what's wrong, for example, which nodes or components generate errors:
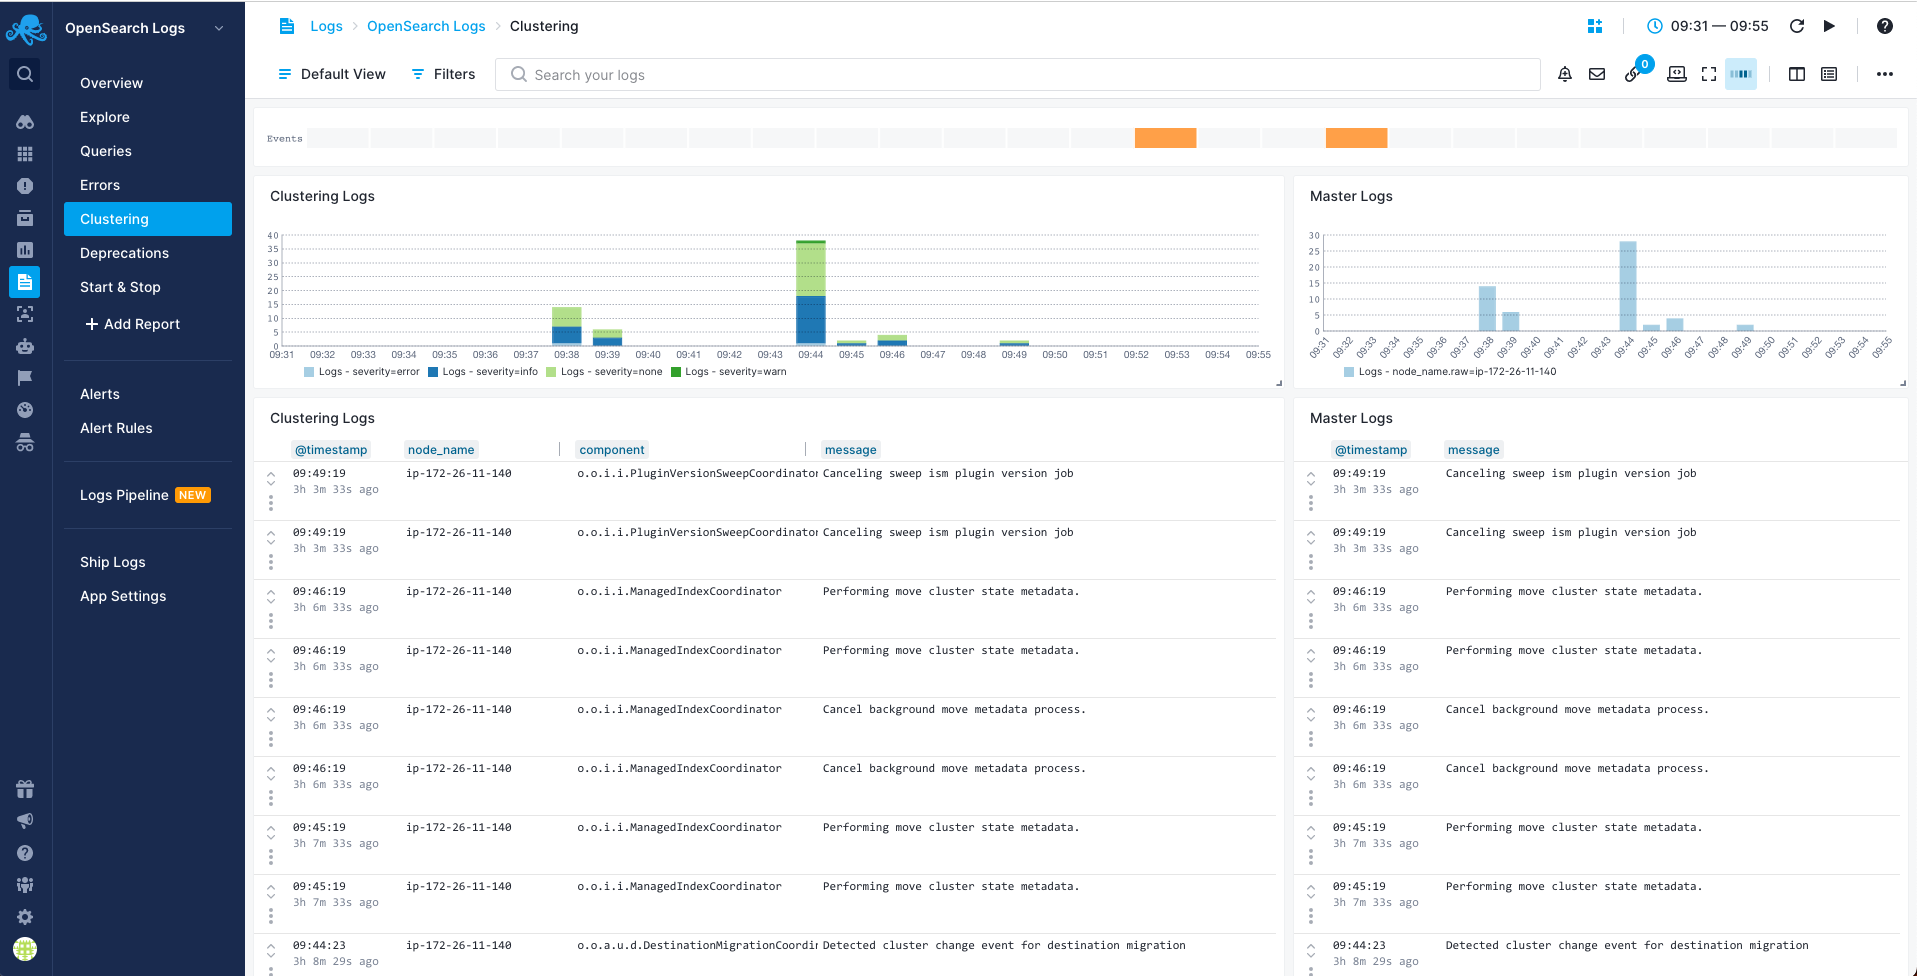
Clustering Report
You can use the Clustering report to see logs produced by components that have to do with cluster coordination. Cluster coordinator logs, logs related to a node joining/leaving a cluster and shard allocation:
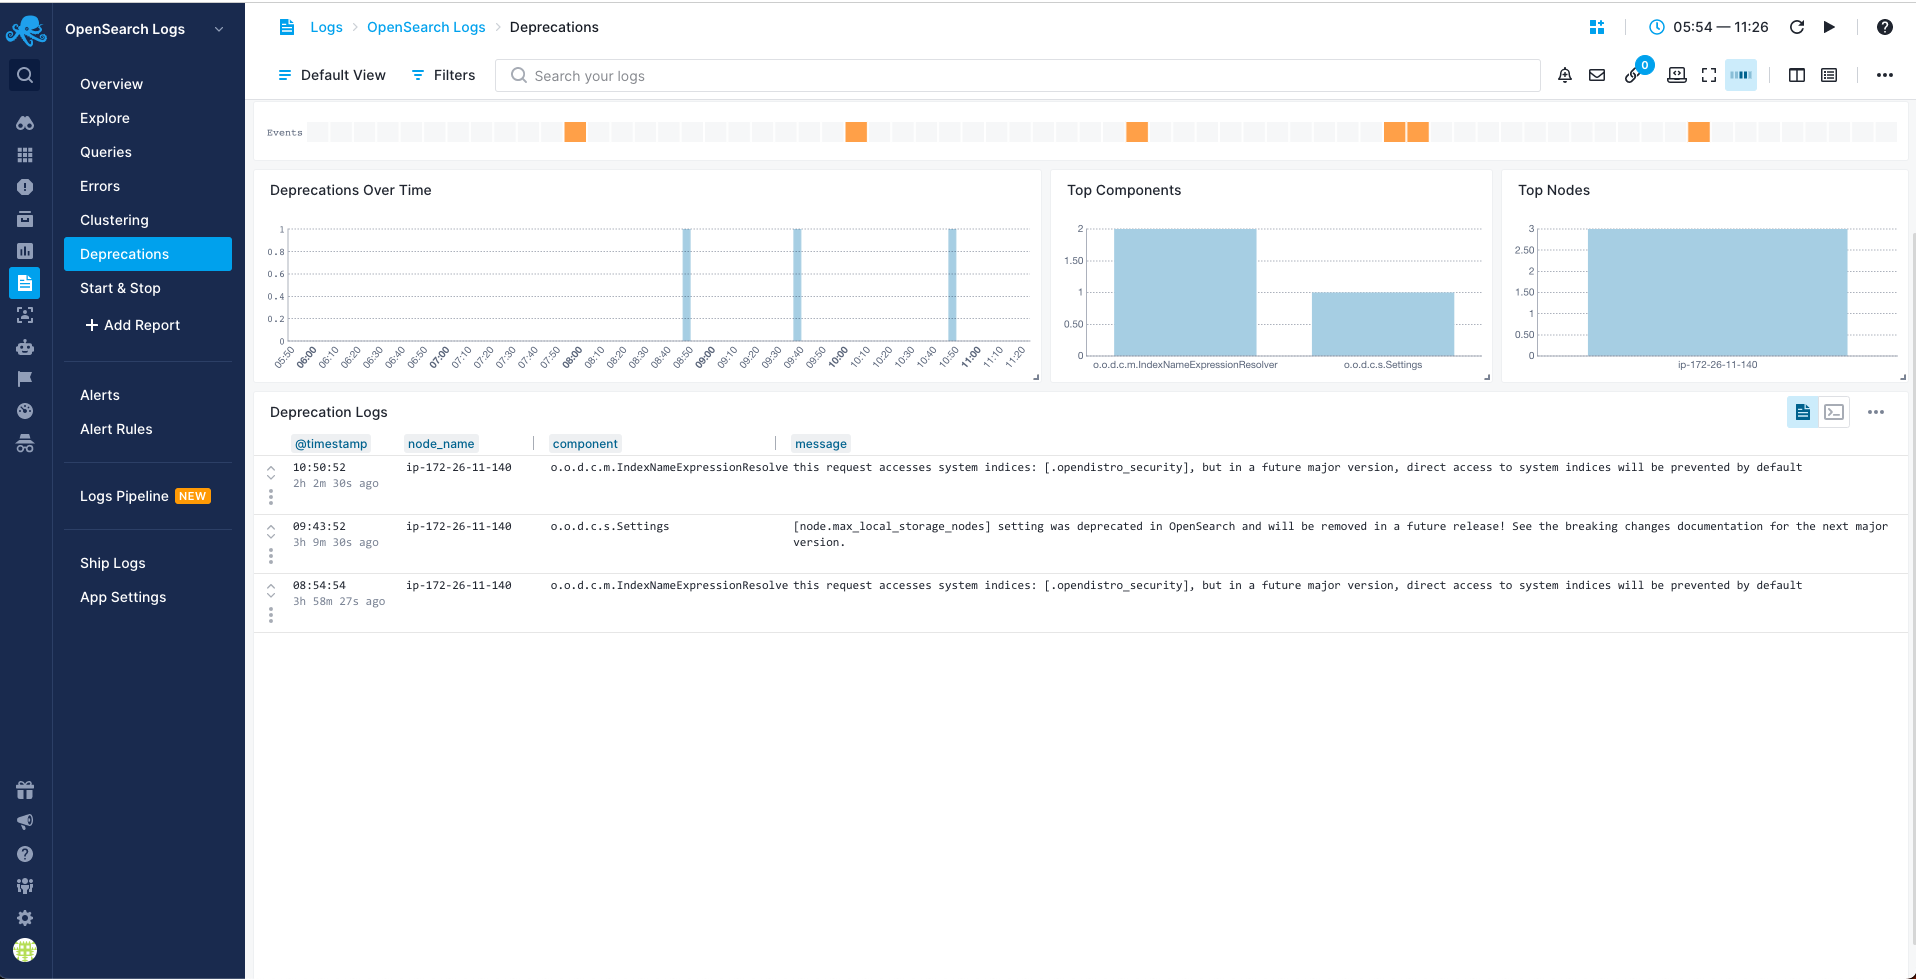
Deprecation Report
You can use the Deprecation report to see a breakdown of deprecation logs by node and component:
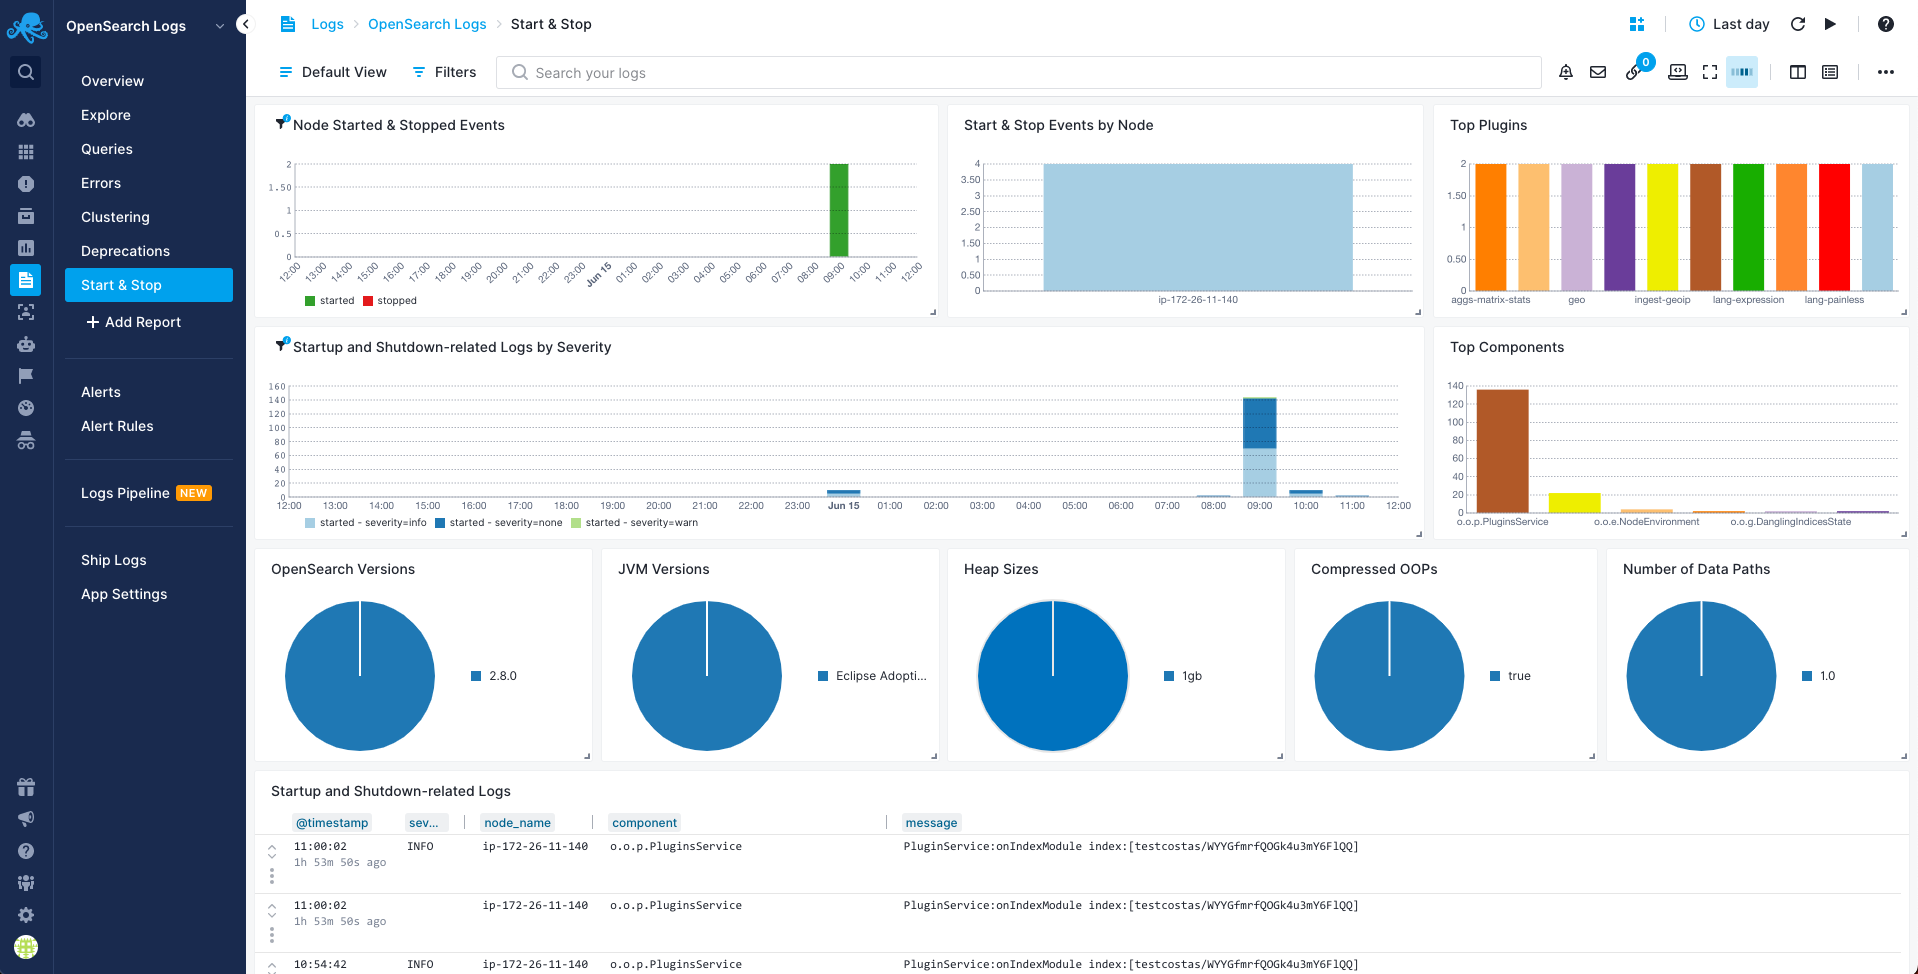
Start & Stop Report
You can use the Start & Stop report to see startup-related and shutdown-related logs. Look here if a node went down unexpectedly or doesn't show up in the cluster when started:
Troubleshooting
If you have trouble sending logs, try out the latest version of Sematext Agent. Also, make sure Sematext Agent is configured to send logs to your OpenSearch Logs App. Last, check the Log Agents panel for any errors, and refer to our Sematext Logs FAQ for useful tips.