Reports & Components
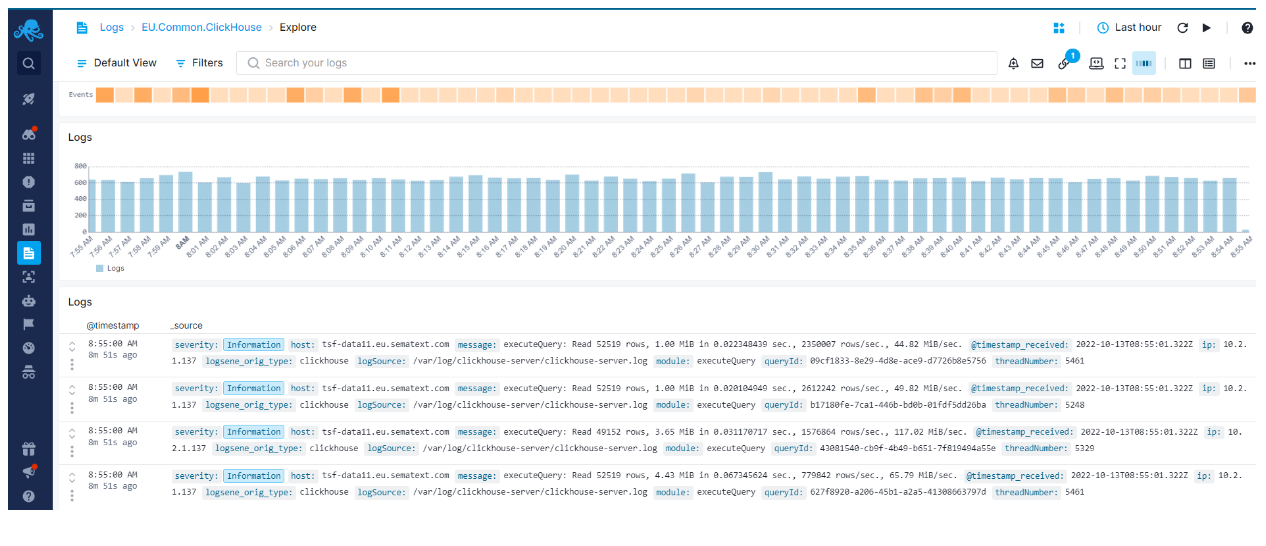
Each Logs App has one default Report called Explore. You can create as many reports as you want with custom Components.
Logs Search and Report Menu
App State
When your Logs App is loaded the Save and Reset buttons will be hidden since you see the App's default state. If a new component is added or any existing component is edited, alert created, and report component removed, the Save and Reset buttons will appear in the report menu and allow for changes to be saved or reset to the initial state. If your browser is suddenly closed, and no changes were saved or reset, the App will preserve its initial state.
Report Actions
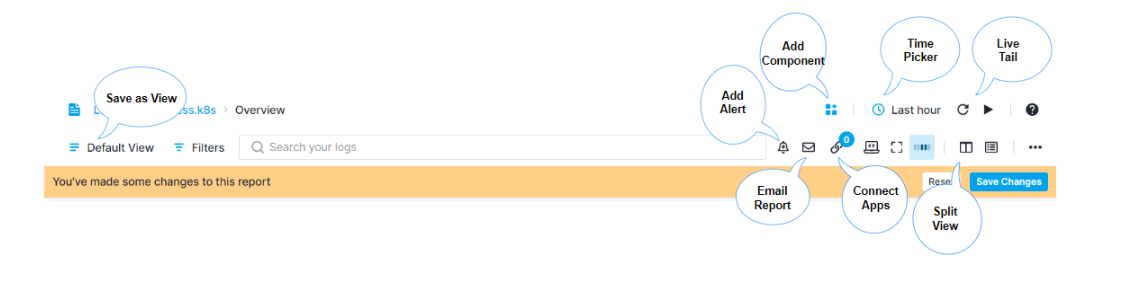
The set of icons in the logs search and report menu let you:
- Save as View - Filtering and grouping data is a central part of the Sematext Cloud user interface. With Saved Views you can save your filters and groups for faster access later. If you find yourself often applying the same filters on your data then this feature can be a time saver.
-
Add Alert - Every query can be use as an alert query. The ability to save alerts is part of the essential tools for searching, correlating and investigating logs data.. Each alert query is visible in the Alert Rules list.
-
Email Report - There are E-mail and Subscription types available with time, frequency, and time range defined so your team can get automatated reports about your logs and system health.
-
Full Screen Mode - Entering full screen mode brings only the component you choose into view. It's useful for presentations and viewing detailed info of a single component. All charts have zoom, crosshair, and time navigation tools with tooltips available for effective chart interaction and data analysis.
-
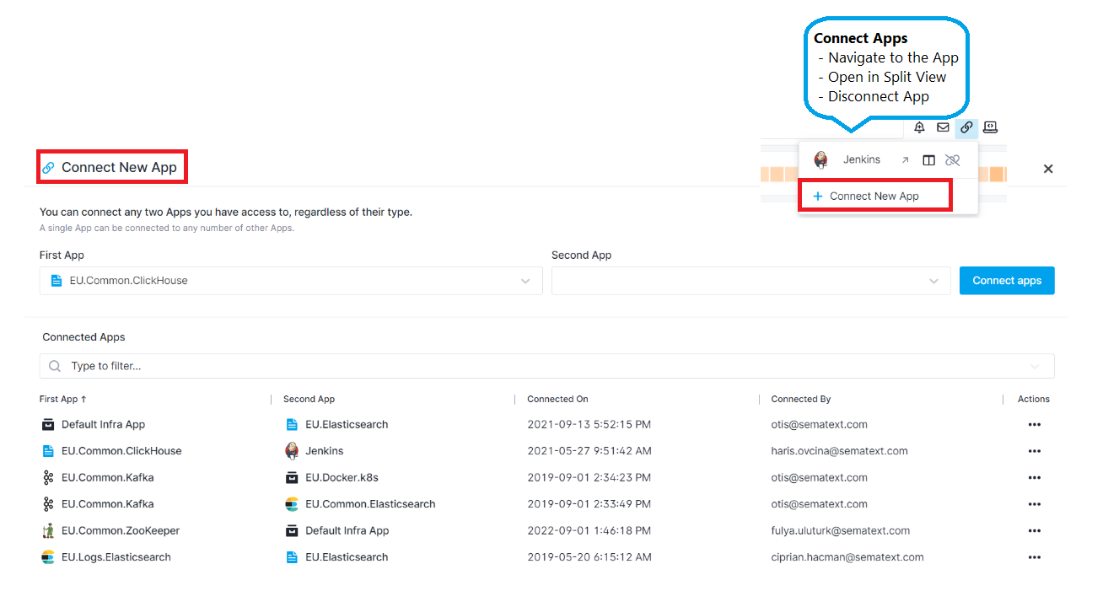
Connected Apps - Connecting a Logs App to a Monitoring App will pre-select that Logs App when you decide to correlate metrics from the connected Monitoring App. When you receive an alert notification for an App, the alert notification will automatically include information and charts from connected Apps, and thus provide more information and context for you. You can connect any two Apps you have access to, regardless of their type. Any App can be connected to any number of other Apps.
-
Split Screen - Split Screen is a product-wide correlation and data-pivoting feature. With Split Screen you can compare any two reports or dashboards, even the same report or dashboard but with different filters and groups in the two different screens.
-
Time Picker - The Time Picker is available whenever an App is selected as well as when any custom dashboards are being used. One minute is the shortest time increment you can select. Thirty minutes, one and two hours, and one, two, seven, and thirty days time-span shortcuts are exposed as well. A custom time range can be selected using the time picker dropdown menu. The Logs App will automatically refresh upon selection and update all the reports accordingly.
-
Live Tail - Refresh data and Live Tail options are located next to the time picker. The Live Tail feature provides real-time insights as soon as your data is consumed and indexed. It can also be stopped so the auto-refresh does not update the data, in case you need to inspect specific incidents or anomalies within a certain time segment.
Components
Using custom components you can add metrics time series, events count time series, events, markdown notes, and create custom reports with rich data visualizations and chart tools to analyze data.
Some components are common for both Logs and Monitoring, while other are specific for either one. They will be contextually available depending on whether you're adding them to a Monitoring or Logs App. Each component can be also added to custom dashboards you create.
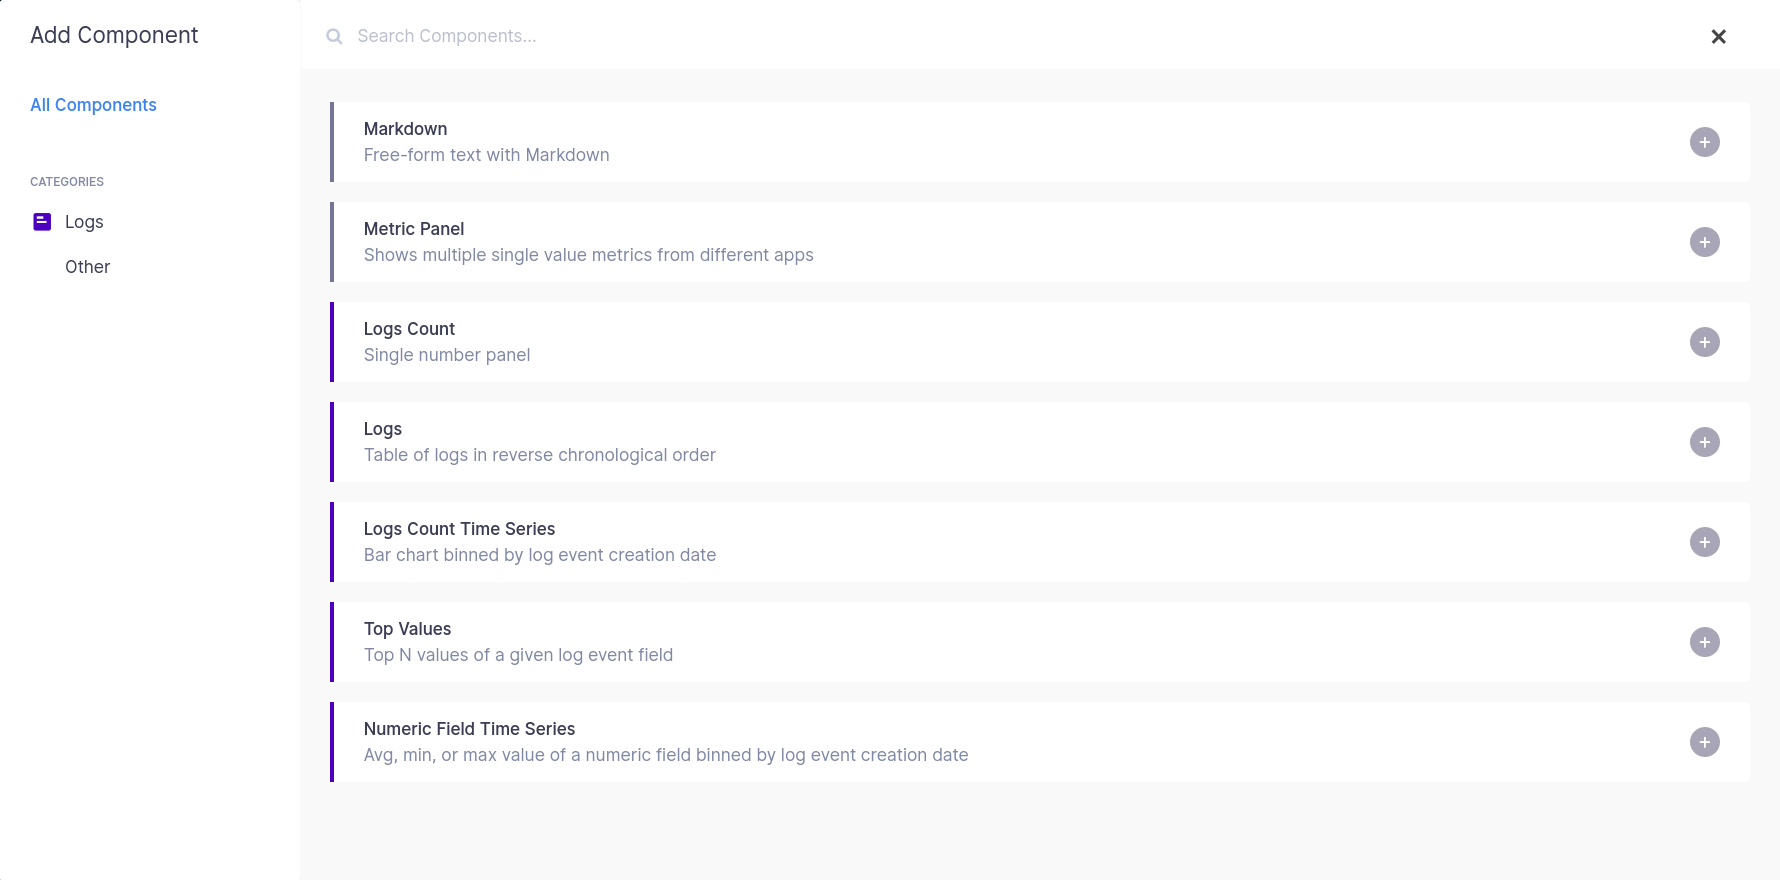
Logs Components
The Logs and Logs Count Time Series components are added by default to your Logs App. Additional Logs components that can be added to your App are Metric Panels, Logs Count, Top Values and Numeric Field Time Series.
These can be configured by whichever search query you want in any way you want. Making it easy to set up your Logs Report just the way you want.
Use them together with out-of-the-box metrics, from a Monitoring App, and you will go from metric spikes to Logs in seconds, and get to the root cause in minutes. Forget about ssh-ing to servers and grepping logs and find similar metric patterns with built-in metric correlations.
Logs Component Settings
Here's an image of the Log Table Component dropdown menu with options to add/remove columns, add to dashboard, go to the field editor, and export logs.
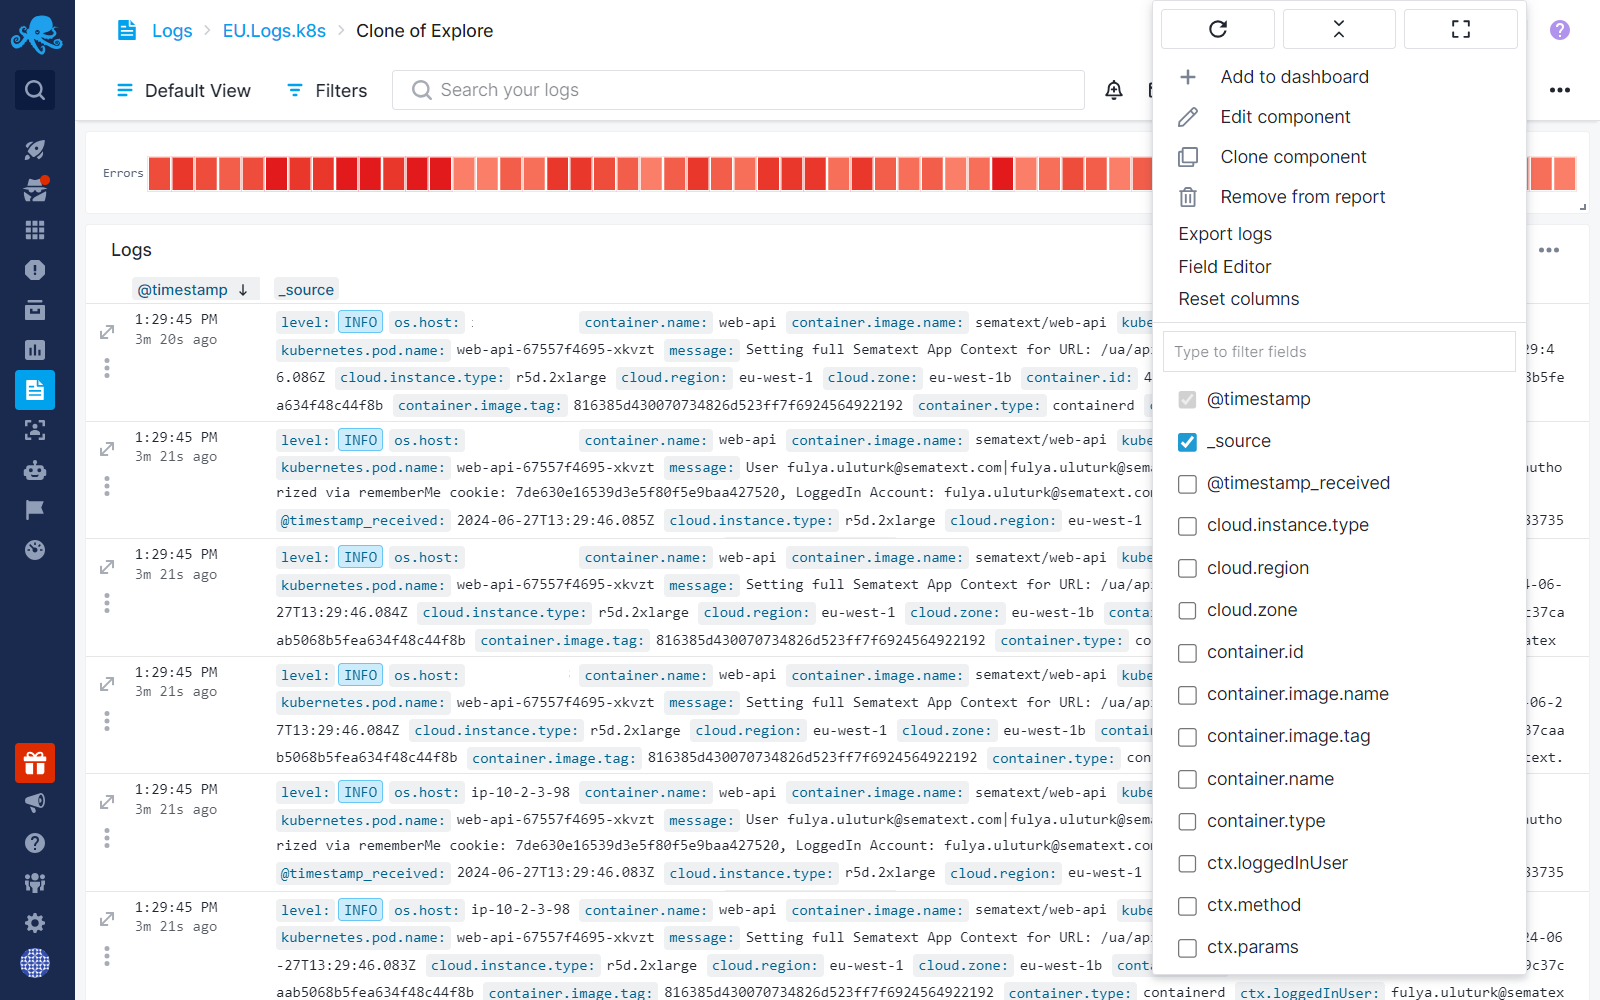
From the Log Table Component, you can quickly add or remove columns, highlight values, create charts, and apply filters. See Logs Table Quick Actions for more details.
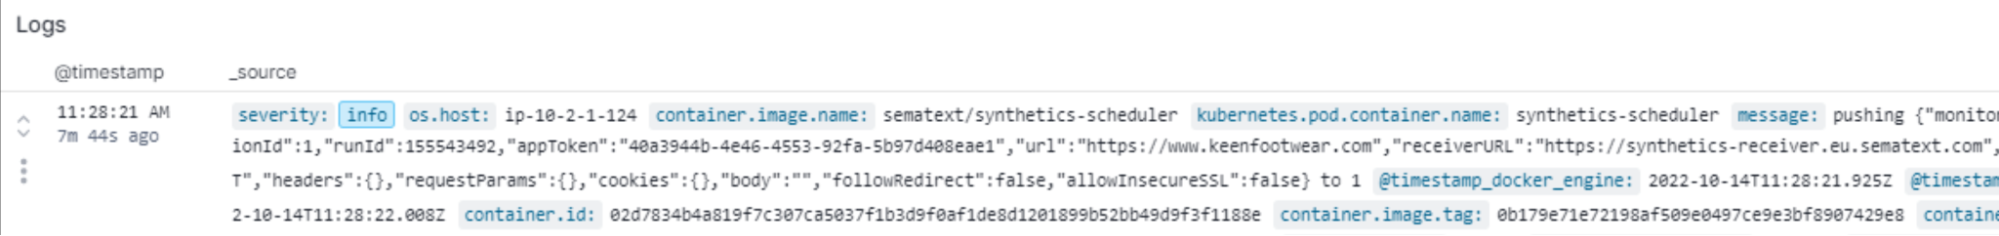
Additionally, you can open each log in a side panel to view its details in either Table or JSON format, providing you with easy access to the full log event payload, the ability to add additional field value-based filters, copy field values, etc.
You can adjust the side panel width by clicking and holding the vertical bar located in the middle of the left side of the panel, then dragging it to your desired width. This width will be saved in your local storage and will be remembered the next time you open it.
You can open the side panel by clicking on the icon located on the top left of each log or by double-clicking the log. While the side panel is open, you can switch between logs with the up and down arrow keys and close the side panel with the escape key or by clicking on the "x" in the side panel.
Furthermore, you have the option to switch to Terminal View, which allows you to view your logs in a more condensed and compact format.
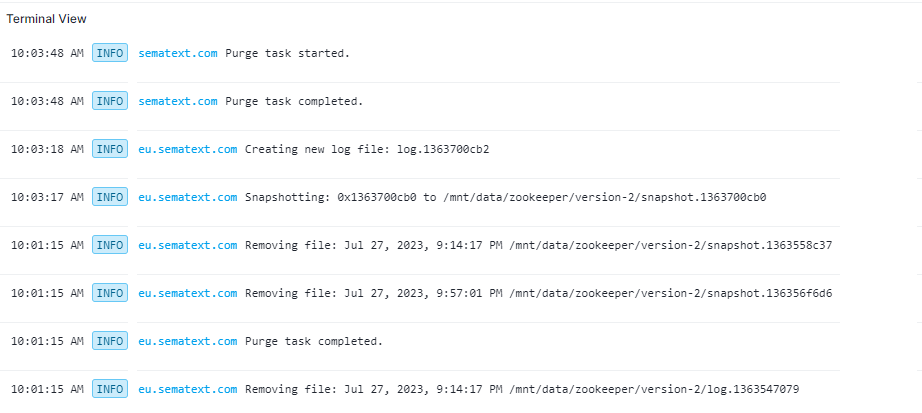
See Logs Terminal View for more details.
Each component can be added to a Custom Dashboard by clicking on the three dots in the top-right corner of the component.
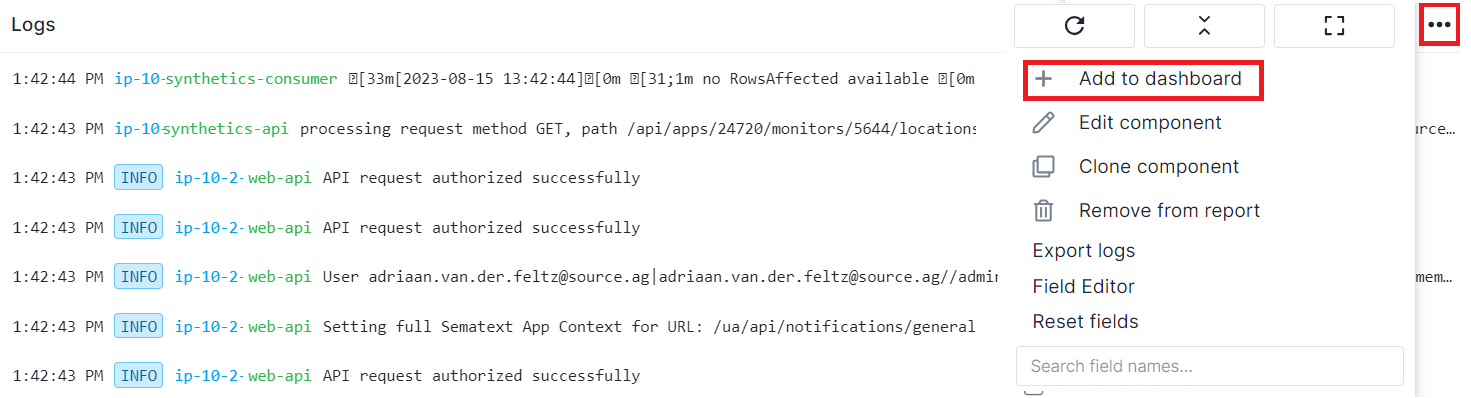
You can organize reports from one or several Apps, both Logs Apps as well as Monitoring, Synthetics and Experience Apps.
Table Density Modes
You can set different table density for each Logs Table from Edit Component > Styles tab.
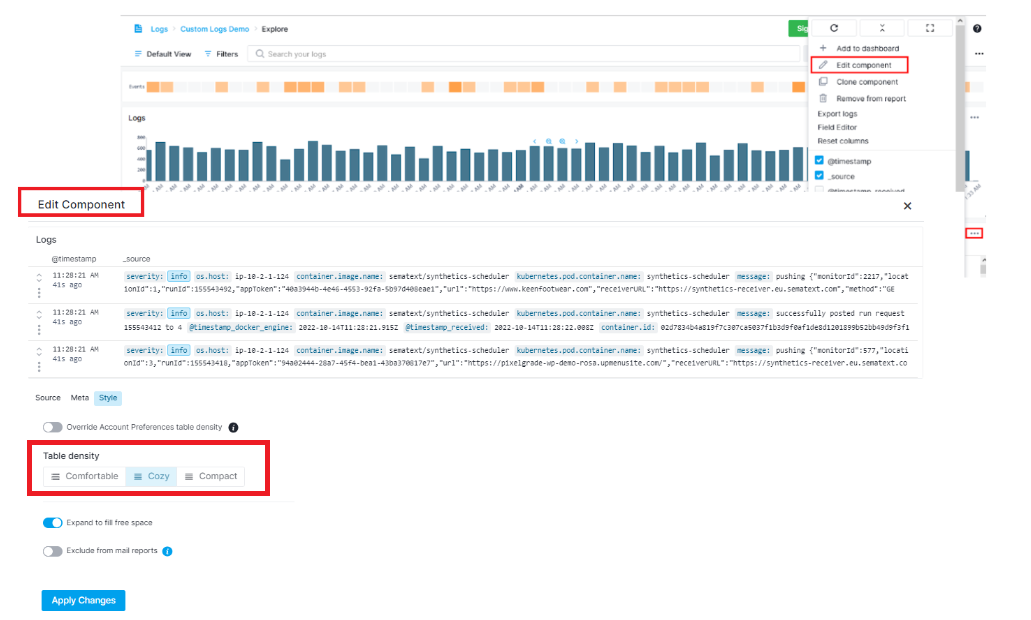
Choose between 3 density options for your table rows and control how many rows fit on a single page.
- Comfortable - Your rows are less dense and easier on the eyes.
- Cozy - Your tables will remain just as they have been so far.

- Compact - Your tables will fit more rows in the same space.

You can also override account preference and set the default table density level. Account level density preference will be applied to all of your data tables. See Control density in other tables.
Infrastructure Group
Each Logs App includes an Infrastructure group in the left navigation menu. This group provides detailed reports that offer insights into the environment of the log sources within each App.
Currently, the Infrastructure group contains the following two reports:
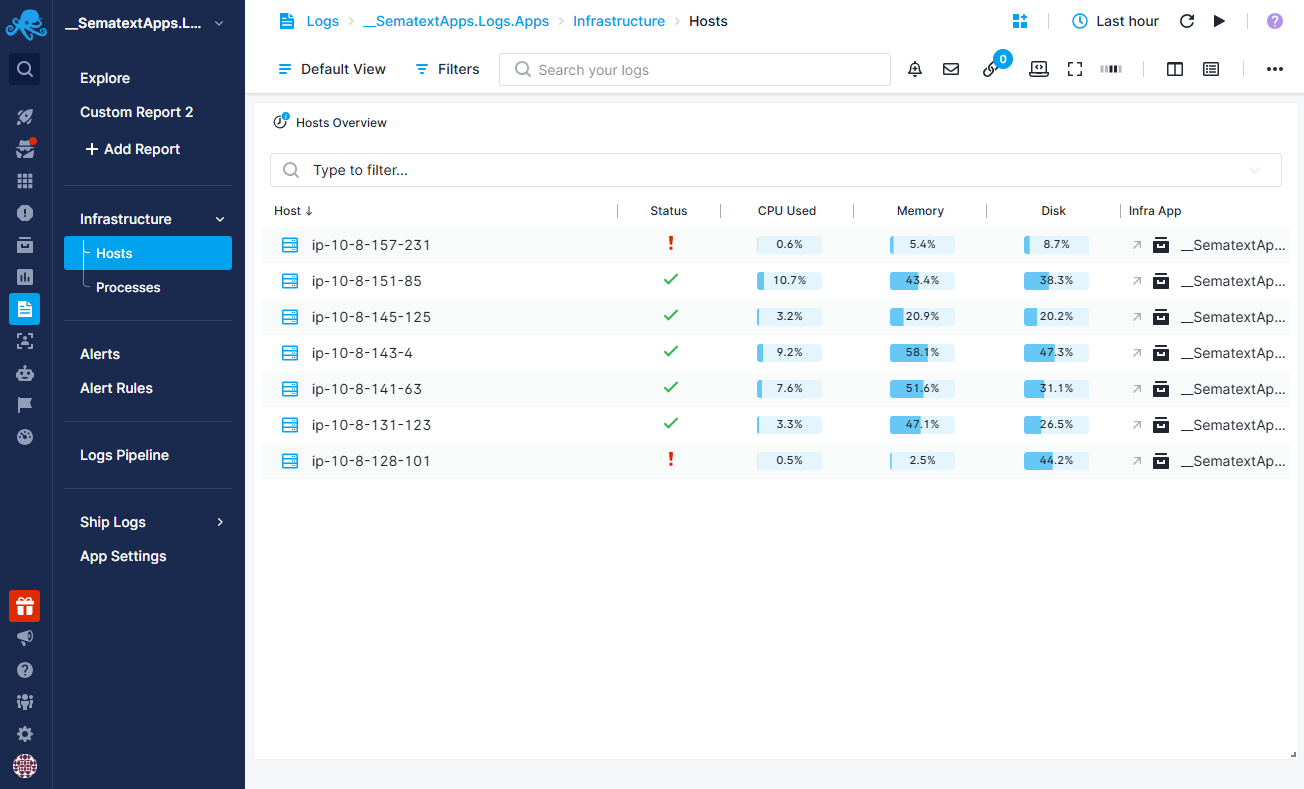
Hosts Report
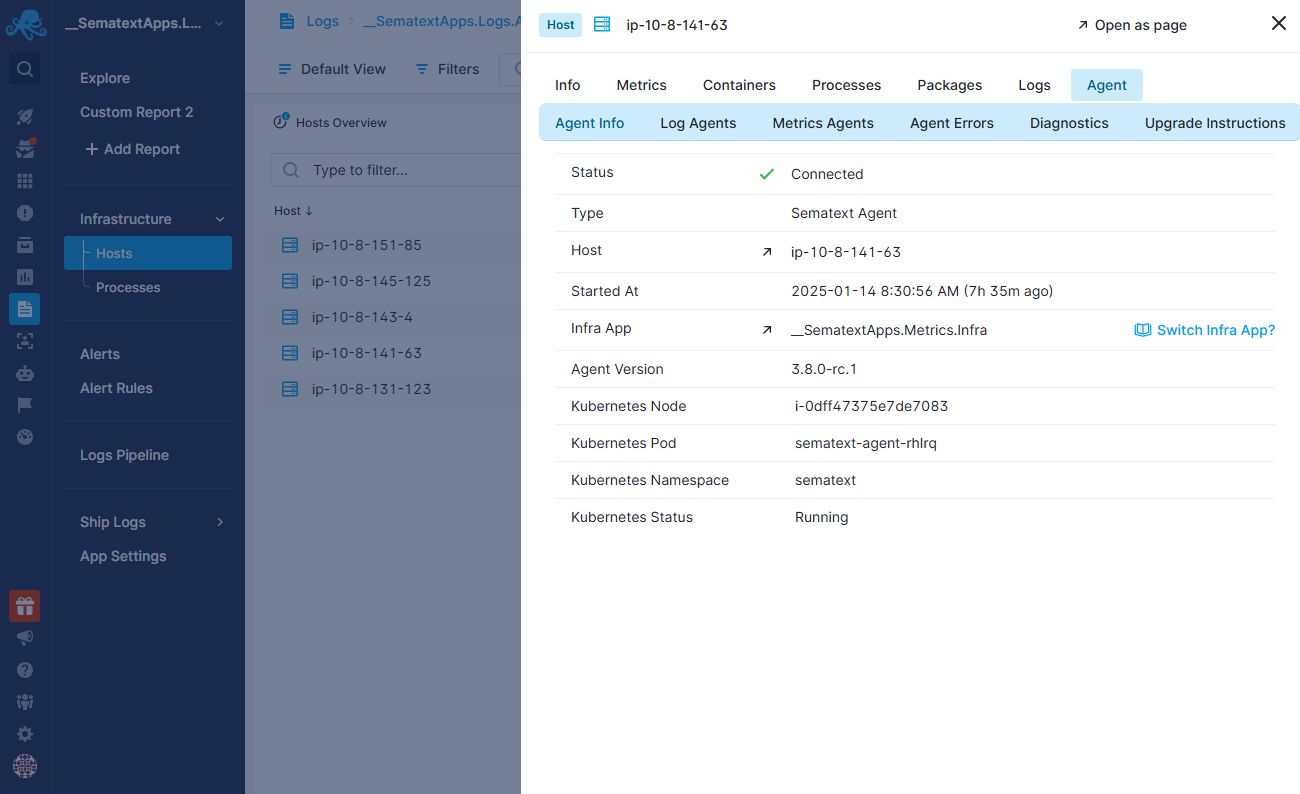
The Hosts report displays a list of hosts sending logs to the Logs App. Selecting a host opens a detailed flyout menu containing information such as:
- General Host Information: Basic details about the host.
- Performance Metrics: Key performance metrics, including CPU, memory and disk usage.
- Container Information: Details about containers running on the host.
- Running Processes: A list of processes currently active on the host.
- Software Packages: Information about available software packages on Linux-based hosts.
- Host System Logs: Access to system-wide logs of the host.
- Sematext Agent Details: Diagnostic information, including details about installed Sematext agents, errors and troubleshooting insights.
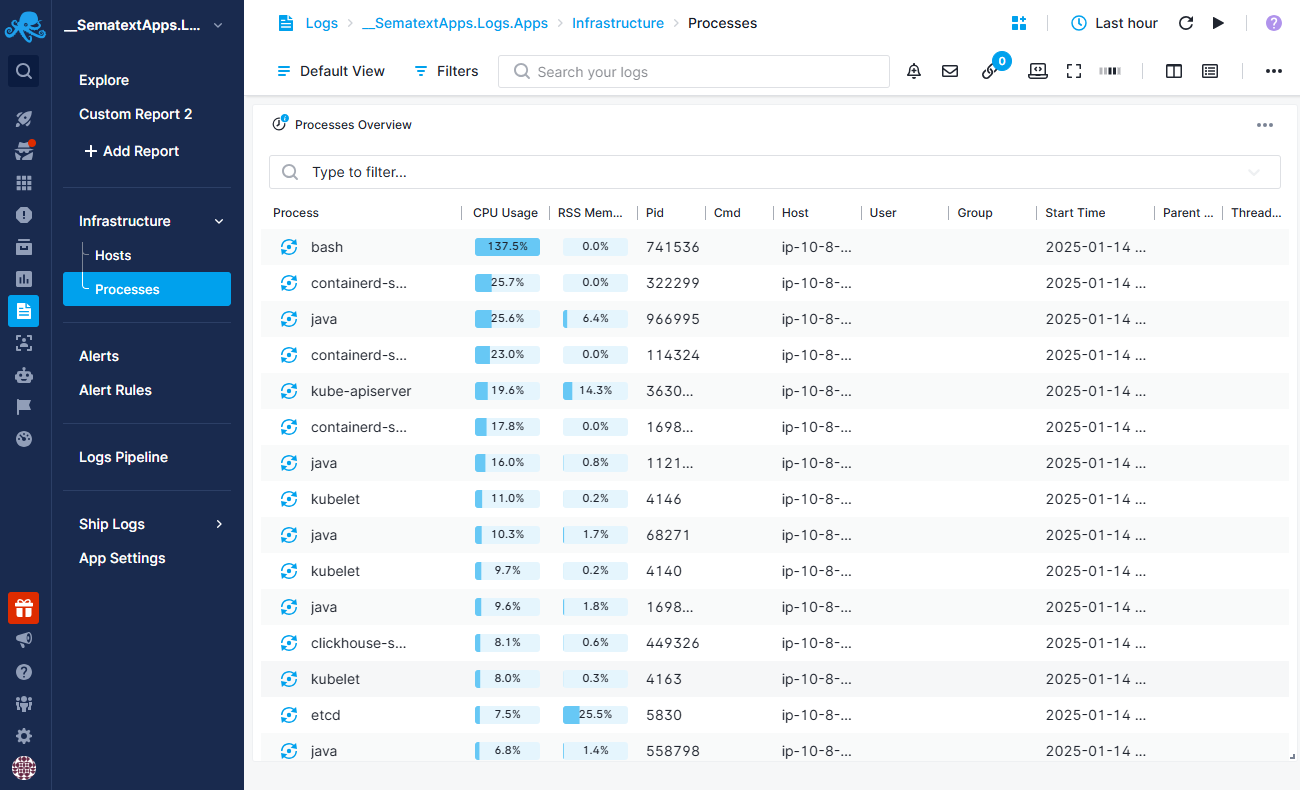
Processes Report
The Processes report provides an in-depth view of the most active processes running on a selected host. It includes:
- Process Information: Details such as process name, PID, PPID, host, user, and group.
- Performance Metrics: Insights into CPU and memory usage for each process.
- Command Line Arguments: The exact command-line arguments used to execute the process.
Key Features of Infrastructure group
- Advanced Filtering: Both reports allow filtering using a wide range of tags, including process name, hostname, container name/ID, Kubernetes tags, and more.
- Easy Troubleshooting: Designed to help you quickly identify potential issues and gain a deeper understanding of the underlying infrastructure (hosts, agents, etc.) shipping logs and metrics to your App.