PHP
Overview
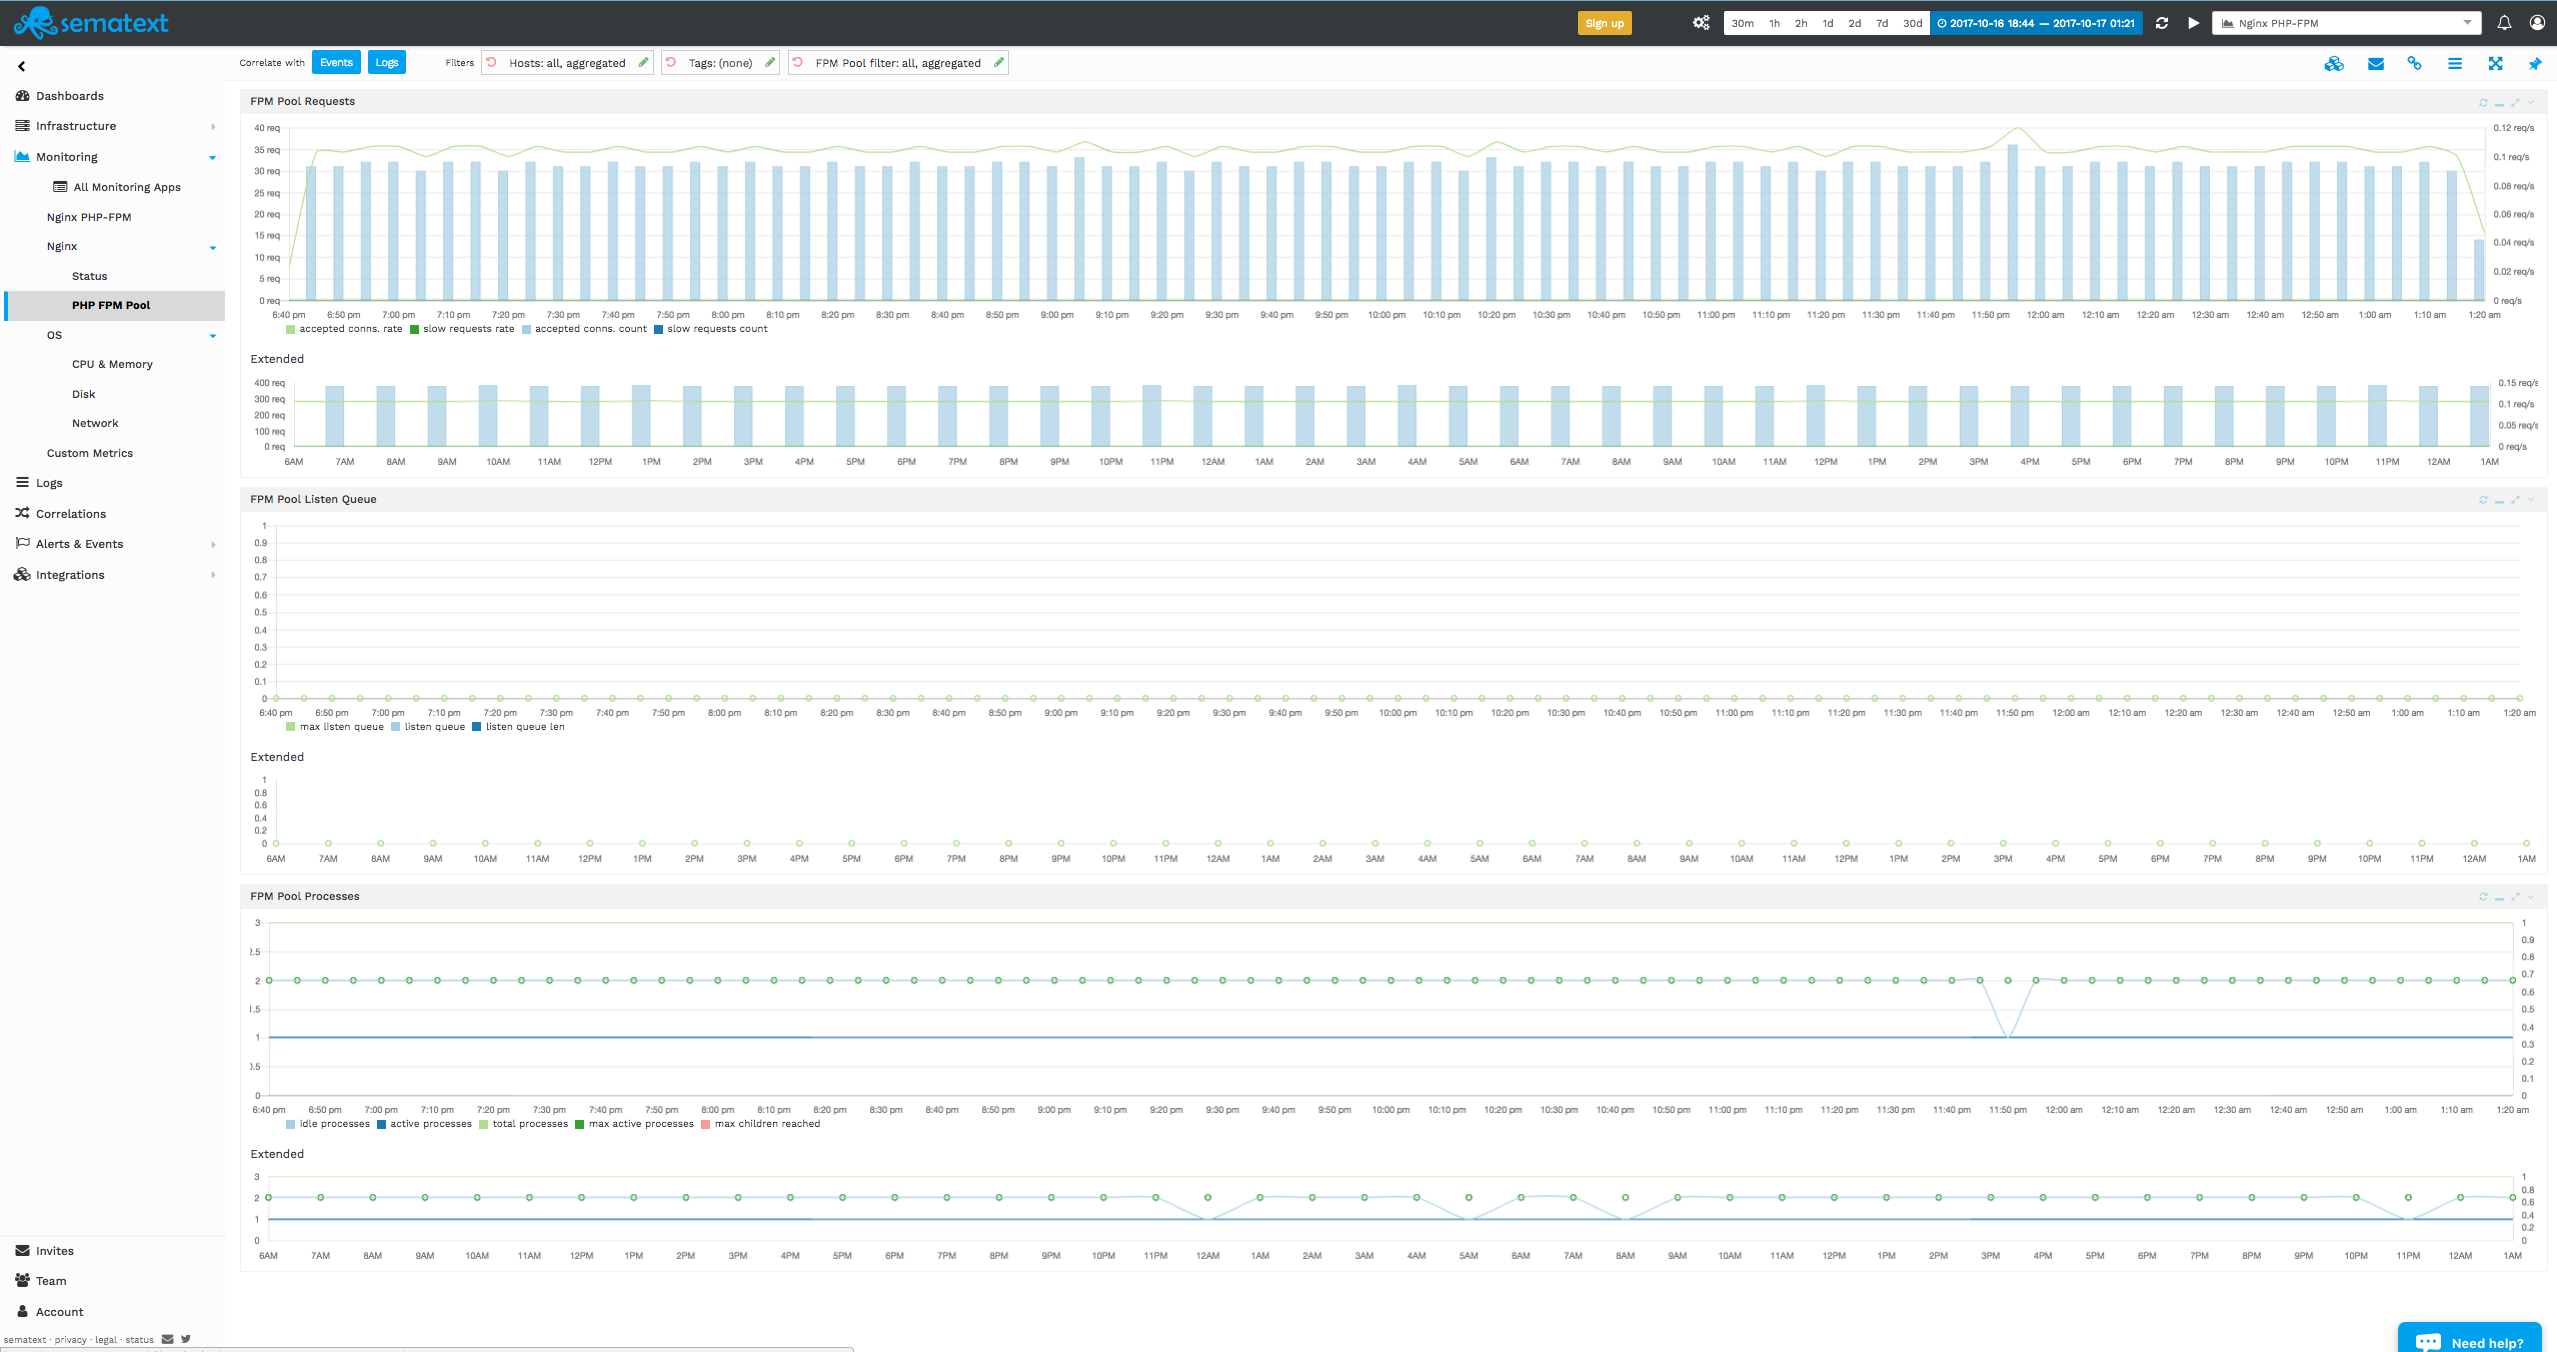
PHP FPM module is integrated with Nginx and Apache and its metrics are displayed as part of Nginx and Apache monitoring in Sematext.
Integration
PHP-FPM monitoring instructions are below. To set up Nginx monitoring or Apache monitoring see their integration instructions.
** Preparation for PHP-FPM monitoring **
Activate PHP-FPM status page in your php-fpm config by removing the leading semicolon in the ;pm.status_path = /status entry:
Or edit the file /etc/php-fpm.d/www.conf manually and ensure it contains this line:
Restart php-fpm:
Integration with Apache
Sematext Agent can be installed to monitor Apache.
When using Autodiscovery, Sematext Agent will automatically discover PHP-FPM status URL and will gather additional metrics from it.
Otherwise, when using manual installation instruction, additional parameter ST_MONITOR_PHPFPM_STATUS_URL can be passed
to setup scripts to define how to access PHP-FPM metrics.
** Setup monitoring with PHP-FPM status page via UNIX socket (recommended) **
Add a parameter ST_MONITOR_PHPFPM_STATUS_URL with a value
http://unix:/var/run/php-fpm.sock:/status. E.g., when using Ubuntu instructions add
--ST_MONITOR_PHPFPM_STATUS_URL=http://unix:/var/run/php-fpm.sock:/status param when calling
sudo bash /opt/spm/bin/setup-sematext ... command.
** Setup monitoring with PHP-FPM status page via HTTP **
In some scenarios, e.g. in Docker containers, the monitoring agent
might not have access to the local UNIX socket. In such cases the
PHP-FPM status page needs to be exposed via Apache httpd. To expose
the PHP-FPM status page via Apache httpd change the configuration
/etc/httpd/conf.d/mod_fastcgi.conf e.g.:
LoadModule fastcgi_module modules/mod_fastcgi.so

<IfModule mod_fastcgi.c>
          DirectoryIndex index.php index.html index.shtml index.cgi
          AddHandler php5-fcgi .php
          Action php5-fcgi /php5-fcgi
          Alias /php5-fcgi /usr/lib/cgi-bin/php5-fcgi
          FastCgiExternalServer /usr/lib/cgi-bin/php5-fcgi -socket /var/run/php-fpm.sock -pass-header Authorization

   # For monitoring status with e.g. Sematext Monitoring for Apache httpd
   <LocationMatch "/(ping|status)">
                  SetHandler php5-fcgi-virt
                  Action php5-fcgi-virt /php5-fcgi virtual
   </LocationMatch>
</IfModule>
In this case, parameter ST_MONITOR_PHPFPM_STATUS_URL should have a value http://localhost/status.
Integration with Nginx
Sematext Agent can be installed to monitor Nginx.
When using Autodiscovery, Sematext Agent will automatically discover PHP-FPM status URL and will gather additional metrics from it.
Otherwise, when using manual installation instruction, additional parameter ST_MONITOR_PHPFPM_STATUS_URL can be passed
to setup scripts to define how to access PHP-FPM metrics.
** Setup Nginx Agent with php-fpm UNIX socket (recommended) **
Add a parameter ST_MONITOR_PHPFPM_STATUS_URL with a value
http://unix:/var/run/php-fpm.sock:/status. E.g., when using Ubuntu instructions add
--ST_MONITOR_PHPFPM_STATUS_URL=http://unix:/var/run/php-fpm.sock:/status param when calling
sudo bash /opt/spm/bin/setup-sematext ... command.
** Setup with PHP-FPM status page via HTTP **
In some scenarios, e.g. in Docker containers, the monitoring agent
might not have access to the local UNIX socket. In such cases the
PHP-FPM status page needs to be exposed via Nginx. To expose
the PHP-FPM status page via Nginx, change the Nginx configuration
/etc/nginx/sites-enabled/default:
location ~ ^/(status|ping)$ {
       # access_log off;
       allow all;
       # allow SPM-MONITOR-IP;
       # deny all;
       fastcgi_pass unix:/var/run/php-fpm.sock;
       fastcgi_param SCRIPT_FILENAME $document_root$fastcgi_script_name;
       fastcgi_param SCRIPT_NAME $fastcgi_script_name;
       include fastcgi_params;
}
In this case, parameter ST_MONITOR_PHPFPM_STATUS_URL should have a value http://localhost/status.
Metrics
| Metric Name | Key | Agg | Type | Description |
|---|---|---|---|---|
| total processes | php.fpm.process.total | Avg | Long | the number of idle + active processes |
| active processes | php.fpm.process.active | Avg | Long | the number of active processes |
| max active processes | php.fpm.process.active.max | Max | Long | the maximum number of active processes since FPM has started |
| idle processes | php.fpm.process.idle | Avg | Long | the number of idle processes |
| accepted conns. count | php.fpm.request.acceptedconns.count | Sum | Long | the number of requests accepted by the pool |
| listen queue | php.fpm.queue.listen | Avg | Long | the number of requests in the queue of pending connections |
| listen queue len | php.fpm.queue.listen.len | Avg | Long | the size of the socket queue of pending connections |
| max listen queue | php.fpm.queue.listen.max | Max | Long | the maximum number of requests in the queue of pending connections since FPM has started |
| slow requests count | php.fpm.request.slow.count | Sum | Long | the number of requests that exceeded your request_slowlog_timeout value |
| max children reached | php.fpm.process.childrenReached.max | Sum | Long | the number of times, the process limit has been reached, when pm tries to start more children (works only for pm dynamic and ondemand) |