Linux
Sematext Linux Monitoring provides insights into your Linux infrastructure, automatically monitoring servers, processes, packages and more across various Linux distributions. Check the following areas for more information:
How it works
A lightweight agent, called Sematext Agent, will be installed on your Linux machine. This agent sends all infrastructure data to an Infra App in Sematext Cloud, whose token is configured during the agent's installation.
The agent itself can be installed either using a native package manager for each distribution or using configuration automation tools like Ansible. Every option is available together with instructions during the creation of an Infra App.
Supported Linux distributions
Linux Monitoring supports the following Linux distributions:
- Ubuntu
- Debian
- CentOS
- Red Hat Enterprise Linux (RHEL)
- Fedora
- openSUSE
- Amazon Linux
For more information, please refer to our platform support policy page.
Infrastructure Reports
As soon as the Sematext Agent is installed, you can navigate to Sematext Cloud > Infrastructure section and access a wide variety of prebuilt reports. These reports contain hundreds of live infrastructure metrics together with their historical data.
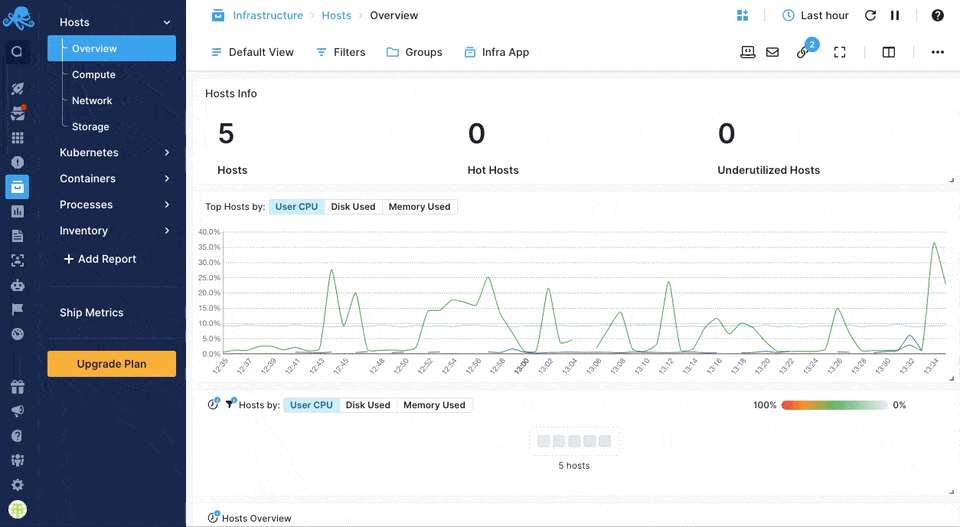
All the metrics can be filtered or grouped by each individual host among other supported tags.
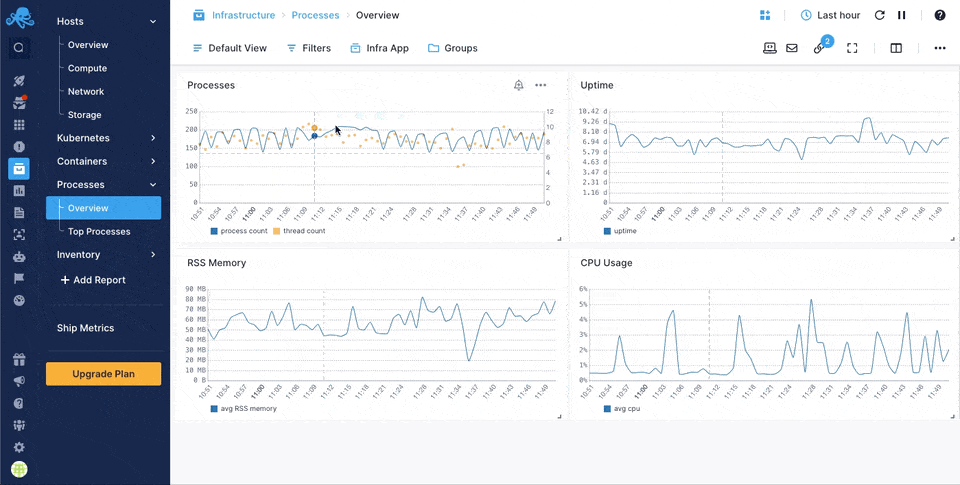
Moreover, some reports contain useful information about the processes running on your Linux servers
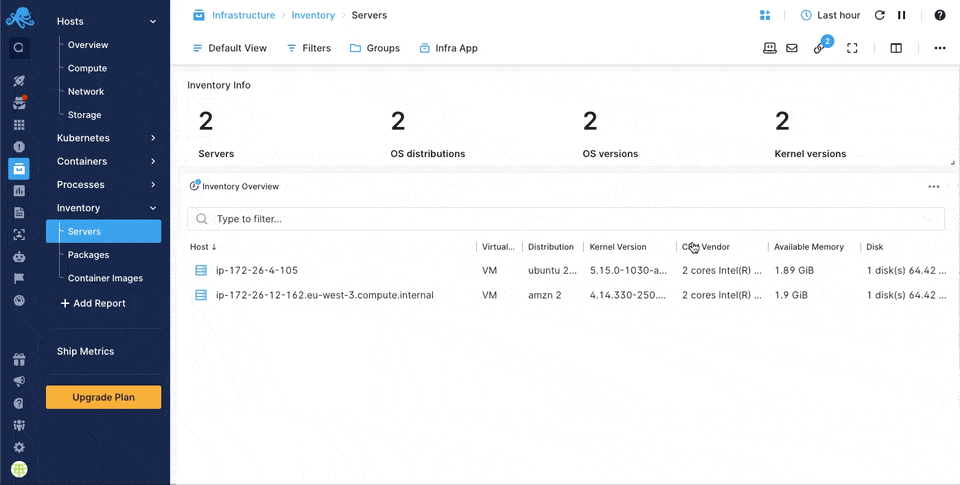
Other reports give you insights about machine-related information such as host, VM, or container properties, kernel versions, and installed packages. All these are part of Inventory Monitoring.
Out of the box alerts
Each time you create a new Infra App in Sematext Cloud to monitor your Linux servers, a number of pre-configured alerts are created as well, fine tuned to catch various issues and prevent your systems to go down.
Refer to our infrastructure default alerts to learn more information.
Logs
Sematext Agent is capable of collecting Linux File and JournaId logs logs along with metrics.
Install Sematext Agent
- Create a Linux Logs App. This will let you install the agent and control access to your logs data.
- Install Sematext Agent on each host you want to monitor according to the instructions displayed in the UI
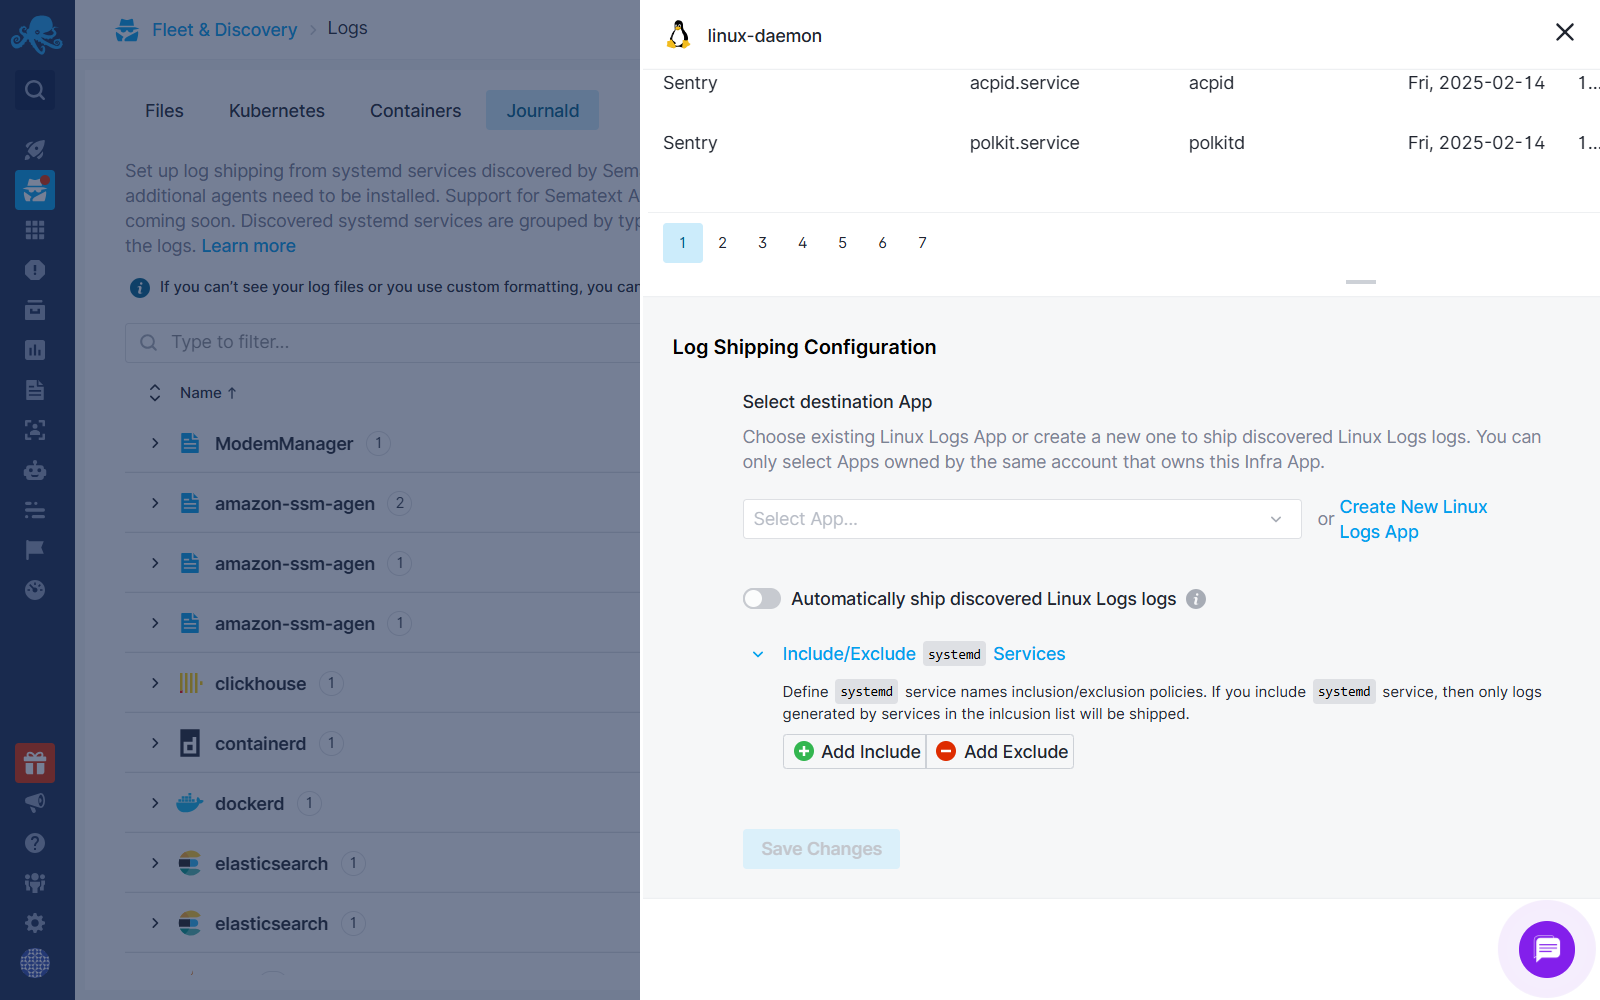
- Once the Sematext Agent is up and running, discovered file and journaId logs from your Linux operating system will be shipped to your Logs App automatically.
When automatic log shipping starts from systemd service units or when you configure the log shipping via Fleet & Discovery, the following values will be automatically set in the agent, and the agent will ship service start-stop logs, audit logs, kernel logs, etc.
include-linux-matches:
  SYSLOG_IDENTIFIER:
    -"systemd"
    -"audit"
    -"systemd-shutdown"
  SYSLOG_FACILITY
    -"0"
    -"2"
  _COMM:
    -"sudo"
    -"su"
You can configure these settings by altering the include-linux-matches section in the /opt/spm/properties/st-agent.yml file.
Additionally, you can define inclusion and exclusion policies for systemd service names. If you include a systemd service, only logs generated by services in the inclusion list will be shipped.
Reports
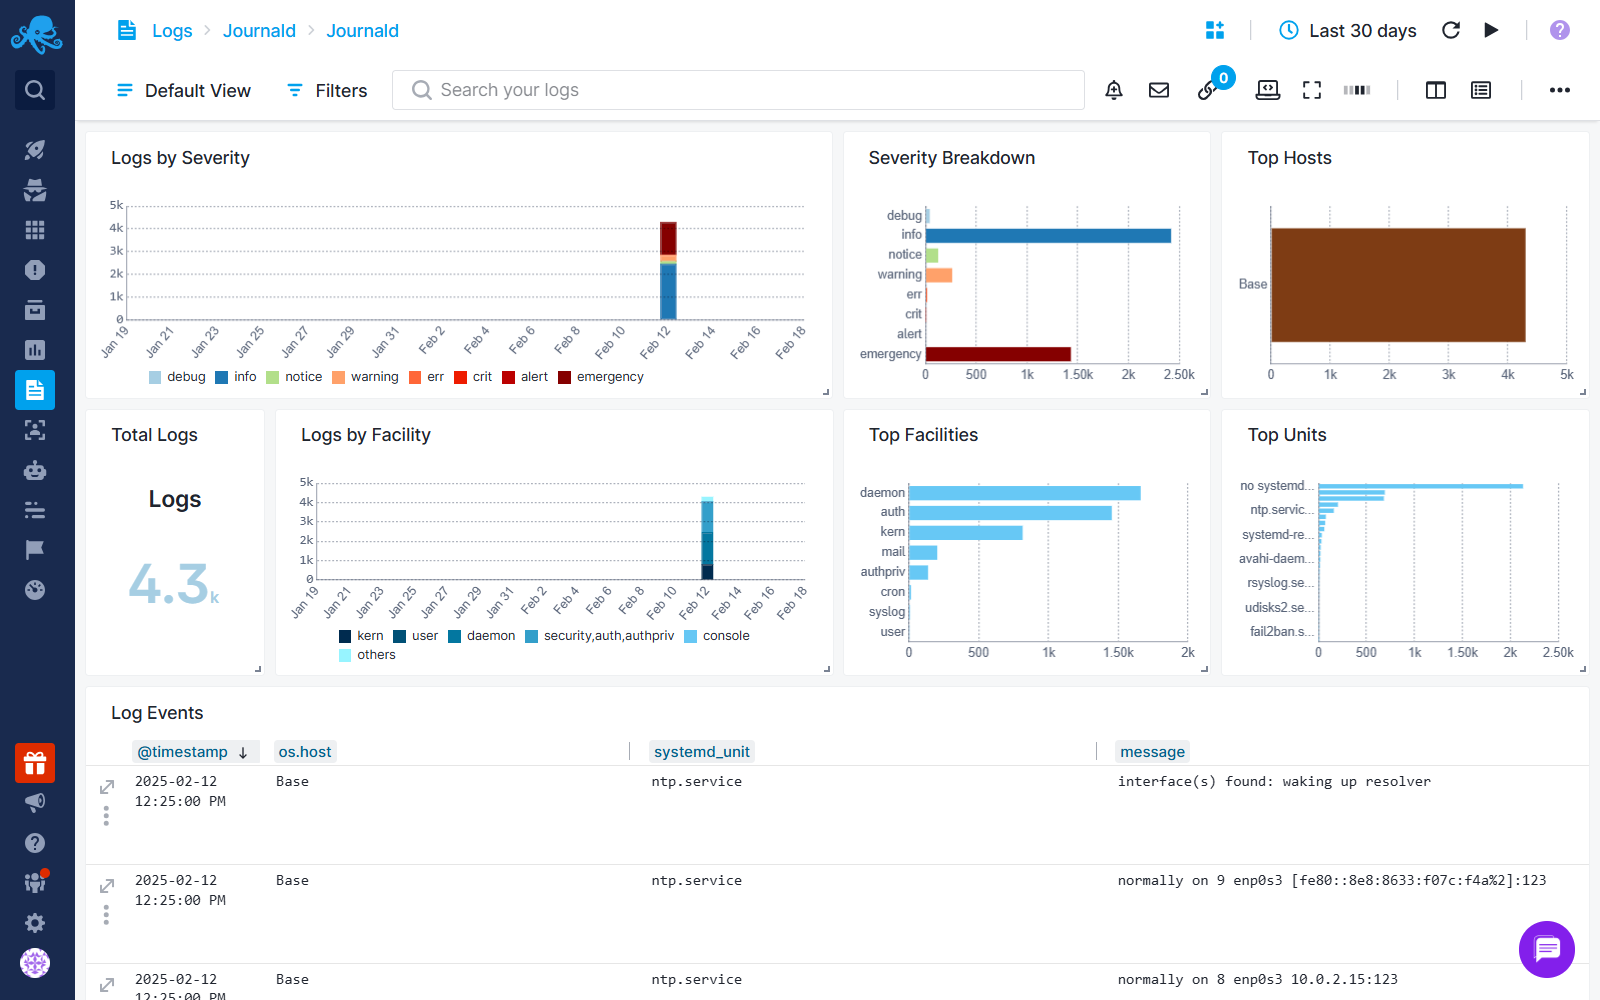
The reports are divided into two categories: File and Journald. Additionally, there is an Explore report that includes all log data shipped from Linux machines.
Journald Reports (logs collected from systemd's journald):
The Overview report provides a high-level summary of Journald logs, showing key trends and important system events at a glance.
In addition to the Overview report, the following built-in reports are available:
- Auth – Tracks user logins, authentication attempts, and security events.
- Kernel – Captures messages from the Linux kernel, including system errors and warnings.
- SSH – Monitors SSH login attempts and connections.
- Services – Logs service start, stop, and failure events.
- Startup & Shutdown – Records system boot and shutdown activities.
- Audit – Includes security and compliance-related logs.
- Cron – Tracks scheduled tasks run via cron jobs.
- YUM/Snap – Logs package installations and updates from YUM and Snap.
- Mail – Captures logs related to email services.
- DNS – Records DNS queries and responses.
File Reports (logs collected from traditional log files):
- Auth – Similar to Journald Auth, tracking authentication events.
- Audit – Security logs stored in audit.log.
- Access – Logs web server access events (e.g., Nginx, Apache).
- Kernel – Kernel-related logs from log files.
- Syslog – General system logs, including messages from various services.
- Fail2Ban – Tracks IP bans due to failed login attempts.
- Mail – Logs email server activity.
Out of the box alerts
Each time you create a new Infra Logs App in Sematext Cloud, a number of pre-configured alerts are automatically created. These alerts are fine-tuned to detect various issues and help prevent system downtime.
- Anomaly alerts triggered when an unexpectedly high number of error or warning logs are detected
- Service failure alerts
- Alerts for unexpected system reboots or shutdowns
- Failed cron job alerts
- Alerts for unusual outbound network traffic
- Alerts for unusual inbound network traffic
Troubleshooting
If you have trouble sending logs, try out the latest version of Sematext Agent. Also, make sure Sematext Agent is configured to send logs to your Logs App. Last, check the Log Agents panel for any errors, and refer to our Sematext Logs FAQ for useful tips.